Can we see the bottom?
An impact measurement study on the ten least developed
countries in the world (plus Haiti)
João Flores Roxo Martins
Advisor:
Professor Susana Frazão Pinheiro
Dissertation submitted in partial fulfilment of the requirements for the degree of MSc in Business Administration, at Universidade Católica Portuguesa
Abstract
In the last 50 years aid has extrapolated its diplomatic objective. The total amount of aid flows disbursed by developed countries has summed lots of billion of dollars. The expectations, were, for a long period of time, not even measured or quantified. The buzz and the media circus created around aid have made African children a trademark used to gather millions. But in the middle of such buzz, the potential effectiveness of these large disbursements was not regarded.
The tremendous flow of money has created regional elites, feeding their bank account from the total lack of responsibility that some aid agencies strongly practice. The track record for failed countries is, still today, incredible high, considered the amount of money and resources disbursed.
How well is aid working in terms of economic growth and human development? What is the current development picture of the poorest of the poorest? The aim of this dissertation is clear: ascertain the impact of the world’s social investment, measured through its return in development and growth. How positive is world’s current ROSI (return on social investment)? We will therefore, review the main authors on effectiveness of aid and how do they engage with the current efforts in monitoring and control aid.
We will give a special focus on human developing index, as a measure of both poverty and as the main guideline regarding development by crossing net official development assistance (1960-‐2010) with three different proxies (GDP per capita, Infant mortality rate and School enrolment), representative of each one of HDI’s levels (Income, Education and Health). We found no significant impact of the total flow of ODA given to a specific country, and its economic growth or human development.
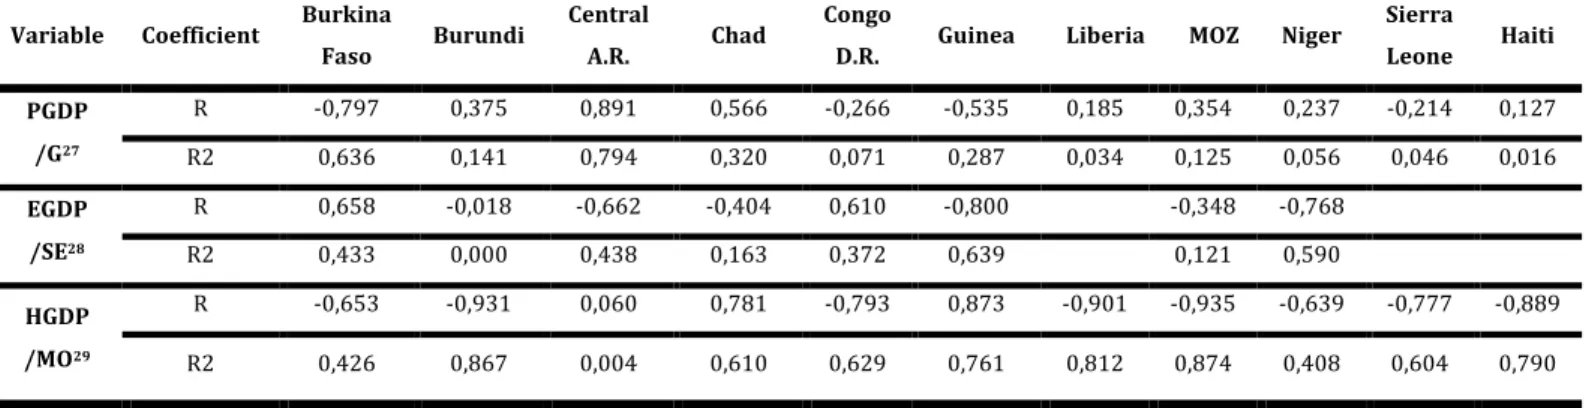
Subsequently we have disaggregated the aid flow, narrowing its purpose and increasing its explicative power by filtering ODA according to the sector where it was used (ODA used in Production, ODA used in Education and ODA used in Health), and then crossing it again with the three development proxies referred above. None significant correlation was found, although health sector stood out as the sector more susceptible to ODA inflows.
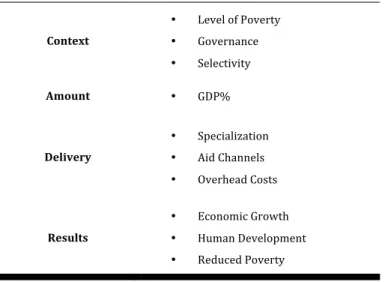
The evidences collected over the resolution of this exercise led to the construction of an operational framework, prepared to analyse and structure aid disbursement based on its potential effectiveness. This framework will operate upon aid’s end-‐to-‐end flow by analysing all the resources and constrains experienced during the process. The guiding axes will the amount of aid, the context where aid is disbursed, , the conditions and resources behind its disbursement and finally the results achieved within this constrains.
The extremely poor data availability has defined a constrained economic exercise; nonetheless we were able to find no significant relation between the inflow of a specific aid amount and the associated proxy capable of measuring that flow’s potential.
Resumo
Nos últimos cinquenta anos, a ajuda extrapolou o seu objectivo diplomático, tendo o valor total entregue por países desenvolvidos atingido valores record. Durante a maior parte destes cinquenta anos, as expectativas associadas a estas transações não foram quantificadas. O circo mediático criado à volta da caridade transformou crianças africanas em marcas registadas, desequilibrou estruturas sociais, criando elites dependentes, alimentadas por agências irresponsáveis. Mas no meio de tanta entropia criada, a efetividade potencial destas doações não foi sequer considerada.
Quão efetiva está a ser a ajuda em promover crescimento económico e desenvolvimento humano? Qual é a situação real do mais pobres, e como é possível encontrar investimentos sociais milionários transformados em disparidades sociais tão flagrantes?
O objectivo desta dissertação é claro: perceber qual é o retorno dos investimentos sociais no dez países mais pobres e menos desenvolvidos.
Vamos analisar os autores mais relevantes sobre efetividade e boas práticas no que toca à cooperação internacional e rever qual é o nível de alinhamento entre o protocolo atual seguido na gestão destes fluxos e as diretrizes teóricas veiculadas pelas agências de controlo. Iremos utilizar o Indicie de desenvolvimento humano como referência para aferir o nível de pobreza dos países analisados e como diretiva principal quanto à definição de desenvolvimento.
Inicialmente pretende-‐se analisar esta relação através do cruzamento dos fluxos totais de ajuda com a variação temporal de indicadores humanos e económicos. Subsequentemente desagregaram-‐se os fluxos de acordo com o sector a que foram alocados, aumentando assim o seu poder explicativo.
É importante fazer referência à inadmissível falta de dados significativos, que condicionou o nosso exercício à partida. Não foi encontrada nenhum tipo de relação significativa entre o fluxo de ajuda e o progresso no indicador responsável por medir o nível de desenvolvimento da área específica a que o fluxo foi direcionado.
Acknowledgments
This dissertation was more than a conclusion of a degree…was a culmination of a set of special experiences that led me to picture the world, the people and a society in a more conscious way.
My sincerely thanks to Professor Susana Frazão Pinheiro, who provide me the outstanding opportunity of being part of her personal and so dear project, Safe Haiti and for introducing me to the most relevant subjects in the social perspective of business in such a clear and driven way.
I also owe much gratitude to Professor Maria João Cortinhal, for her altruist availability, impressive professionalism and commitment that have really made the difference.
My thanks also to Professor Luís Francisco Carvalho for important feedback on economics, and to Phil Harding for reviewing and commenting my framework.
Thank you Marta for your presence and patience during our Haitian adventure. Despite of the humidity, round the clock roosters, burning garbage, poulet frite avec banana, red zones and stoned buses…we made it.
Thank you to my mentor Luis Veiga Martins, for his time, friendship and experience.
For everyone in Mozambique, for everyone in Guinea-‐Bissau, for everyone in Haiti, for my exceptional family and for my friends: a truth and sincere thank you.
Motivation
LIGI Safe Haiti Diary, Day 5
“So there I was, on the basement of UN complex building, having a routine meeting when the floor start to tremble. We just stood there, hopping that those 35 seconds ended up soon. After it, we ran. The dust, the cries, the tension…was overwhelming. As bad as the situation was, my thoughts were only on my wife: she had arrived in Port-‐Au-‐ Prince days before.
As we came to surface, the blur of the shock started to fade away. The image was devastating… it was 16: 53 local time, and the night was falling.
From the tree-‐building complex, mine was the only one standing. Where 2 hours ago was UN mega complex, with thousands of fellow colleagues, now was a pile of rumble...”
Antonio Perera, UN Sanitation Department
Try to understand what that moment might have been, is, at least, presumptuous. How the screams, cries and pleas would sound, how the face of that city, of that country was changed forever.
Here we were, 19 months after the massive shock, looking over our 4x4 Toyota, trying to find a meaning for such poverty, lack of dignity and a completely absence of hope.
The roads lie side by side to open-‐air swages, where women sell the midday meal (frequently the only for the day). Large pigs, divide the garbage with chickens, goats and children. Here the air is stained with a heavy grey tone due to extreme traffic pollution and burning garbage. It is a striking scenario that after some setbacks is capable of draining out your energy, your breath, and your will...
This was the Haitian Fact’s list that we had to deal with1:
• Because of both violence and AIDS, Haiti has the highest percentage of orphans of any country in the Western Hemisphere. Before the 2010 earthquake, the United Nations estimated there were 430,000 orphans.
• In 1803, Jean-‐Jacques Dessalines (1758-‐1806), Haiti’s first ruler, created the nation’s flag by ripping out the white stripe in the French red, white, and blue flag, claiming he would rip white people from the nation.
• Only about 10% of all Haitian children enrolled in elementary school go on to a high school.
• From 1804-‐1915, more than 70 dictators ruled Haiti.
• Haiti’s entire annual budget is $300 million, less than that of many small cities in the United States. Since the 1980s, its economy has shrunk steadily.
• Approximately 1% of Haiti's population owns more than 50% of the nation’s wealth.
• Experts claim that it will take decades for Haiti to recover from the January 2010 earthquake. Nearly 75% of the capital will need to be rebuilt, not from zero, but from, as officials declare, “below zero”.
Alongside with this “tough” social and political context (that somehow we were expecting), we found a tremendous gap between the potential results of aid and its effectiveness, and the stories about aid “fails” kept on being told to us:
• PNUD has paid to some local workers to clean up some major water corridors. After the work done obviously the payments were suspended. The workers refill again the conducts with garbage to keep receiving money.
1 Blashfield, Jean F. 2008. Haiti: Enchantment of the World. New York, NY: Scholastic and Inc.“The World Factbook: Haiti.”
• Approximately 1/3 of the total tent refugees actually need it to survive. The remaining number uses it as a way to pressure government to give them houses.
• The major concentration of tents is in Port-‐Au-‐Prince main avenues and squares (high visibility). During our month and half in Carrefour (one of the most impacted areas of the earthquake) we rarely saw any tent. It was crystal clear that the concentration of tends depended on the proximity and concentration of International NGO’s.
• FAO had an agriculture program in Haiti. By distribution a bag of corn seeds they expect to forest agriculture and harvests. Farmers would take the bag of corn seeds, grind them and make some bread. No crops were seeded.
• Wyclef Jean (known hatian-‐american singer) made a proposition to Haitian government to collect and manage the entire country’s garbage needs. It is said that the refuse was partly because more garbage implies more sick people, and more external money entering the country.
Although those facts lack formal references, they arise from empirical evidences and consensual informal conversations with many Haitian civil actors (professors, international and national NGO’s workers, services workers, etc…).
I could not stop myself from wondering how was possible that aid could have such a perverse and nefarious effects. How Haiti’s economic and human development is only one more item on international cooperation list, when it should be the primary one? How are NGOs able to create a dependent economic elite which unbalances social scheme, and increase prices indiscriminately? How so many relevant donors do not care how such large-‐scale aid disbursements are deployed?
Obviously my background in management and my arrogance (inherent to my privilege of living above poverty line, having a proper education and living in a continent capable of enable me to explore a set of opportunities and possibilities) promptly led me to suggest a handful of “simple” organizational and strategic ideas, which seemed so obvious.
Those “so apparent” errors have revealed themselves far more intricate as I understood the dimensions and the level of complexity inherent to such diverse organizations.
Managing a project in Haiti, in Guinea-‐Bissau and volunteering in Mozambique, clearly allowed me to have a deeper understanding upon development economics. All these experiences gave me valuable insights that will certainly help me to draw a research dissertation aimed to understand the effectiveness of aid and its relation with the human development.
Table of Contents
ABSTRACT IIRESUMO IV
ACKNOWLEDGMENTS V
MOTIVATION VI
TABLE OF CONTENTS X
ACRONYMS 1
1
INTRODUCTION 2
1.1
METHODOLOGY 5
1.2
STRUCTURE 6
2
LITERATURE REVIEW 7
2.1
TYPES OF AID 7
2.1.1 OFFICIAL DEVELOPMENT ASSISTANCE 7
2.1.2 TIED AID 7
2.1.3 OTHER TYPES OF AID 8
2.2
AID LAFFER CURVE 9
2.2.1 TURNING POINT 10
2.3
AID EFFICIENCY 10
2.3.1 POVERTY-‐EFFICIENT AID ALLOCATION 12
2.4
AID TRANSPARENCY 13
2.4.1 THE PARIS DECLARATION AND THE ACCRA AGENDA FOR ACTION 13
2.5
AID BEST PRACTICES 14
2.5.1 CURRENT AID PRACTICES 15
2.5.2 MONITORING AND CONTROL 20
3
RESEARCH METHODOLOGY 21
3.2
RESEARCH QUESTION 21
3.3
RESEARCH MODEL 22
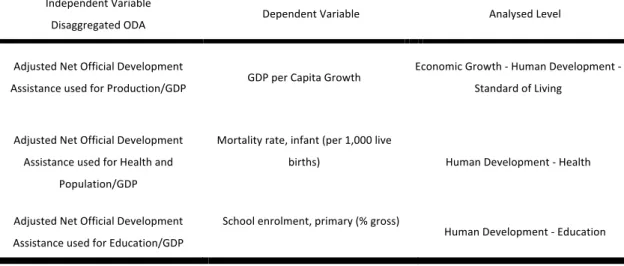
3.3.1 ANALYSIS 1 23
3.3.2 ANALYSIS 2 28
3.3.3 RESULTS 29
4
DISCUSSION OF THE RESULTS 32
4.1
AID EFFECTIVENESS FRAMEWORK 33
4.1.1 LEVEL ANALYSIS 34
4.1.2 FRAMEWORK LIMITATIONS AND FUTURE OPTIONS 38
4.2
LIMITATIONS 39
5
CONCLUSIONS 42
5.1
FUTURE RESEARCH 43
6
REFERENCES 43
6.1
BIBLIOGRAPHY 44
6.2
NETGRAPHY 48
7
APPENDICES 49
7.1
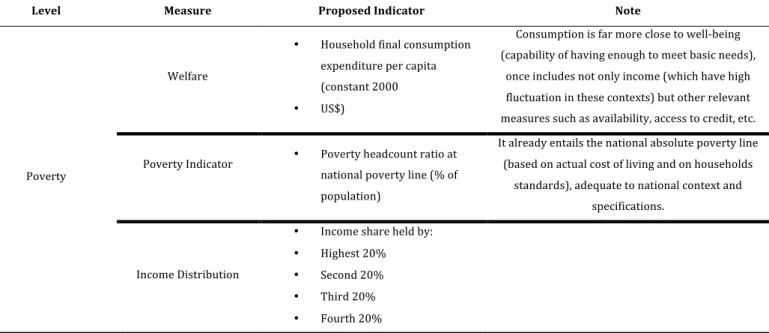
APPENDIX A: INDICATORS DESCRIPTION 49
7.2
APPENDIX B: HUMAN AND ECONOMIC DEVELOPMENT INDICATORS 50
7.2.1 GDP 50
7.2.2 THE HUMAN DEVELOPMENT APPROACH 52
7.3
APPENDIX C: LIST OF VARIABLES AND SOURCES 53
Acronyms
Central A. R. Central African Republic
Congo D.R. Democratic Republic of Congo
DAC Development Co-‐operation Directorate
E.U. European Union
GDP Gross Domestic Product
GNI Gross National Income
MOZ Mozambique
NGO Non-‐Governmental Organization
ODA Official Development Assistance
OECD Organization for Economic Co-‐operation and Development
OOF Other Official Flows
UN The United Nations
UNDP United Nations Development Programme
UNHCR The United Nations High Commissioner for Refugees
PPP Purchase Power Parity
1 Introduction
The simple exercise of google Africa, may translate itself as an endless display of volunteering and donation adverts. The thrill that civil society has created around aid, has led to unimaginable flows of money, glorious causes, hit songs, celebrity becoming ambassadors, “one in a life time” paid experiences and incredible CV highlights. We may agree on something: even though the majority of this entire circus is based on well-‐ intended, charitable ideas; the overall result is no more than an empty development concept.
Development cannot be about collecting and donating large amounts of money or about performing efficiently under humanitarian emergences; development has primarily to do with long-‐term perspectives — it is about erecting the needed infrastructures and contexts, to guarantee a sustained economic growth.
In 1999, the United Nations declared that 70 countries — all of them, aid recipients — were then poorer than they were in 1980. An astonishing number of 43 countries were actually worse off than in 1970. Following this declarations and as a response to President Clinton’s plea to the congress to give more money to Africa, critic Dog Bandow mentioned 13 foreign aid failures – Haiti, Somalia, Sierra Leone, Liberia, Angola, Chad, Burundi, Rwanda, Uganda, Zaire, Mozambique, Ethiopia and Sudan – which with the exception of Haiti, were all in sub-‐Saharan Africa (The Cato Institute, 1999). This declaration refers to a timeframe, where the amount of aid given to Africa by its three main bilateral donors reached it highest value of all time to the date (1970-‐1990)2.
Chart 1 -‐ USD billion, 2008 prices and exchange rates, 3-‐year average net bilateral disbursements
Source: Adapted from World Development Indicators, World Bank, 2011. Set of primary indicators used by World Bank regarding aid effectiveness
2
From OECD -‐ International Development Statistics -‐ http://www.oecd.org/dataoecd/
-‐1 1 3 5 7 1970 1975 1980 1985 1990 1995 2000 2005 United States France United Kingdom
Simultaneous to a growth in the amount of aid (aimed to promote development), there was a clear worsening of the economic and human developing of such recipient countries. Why?
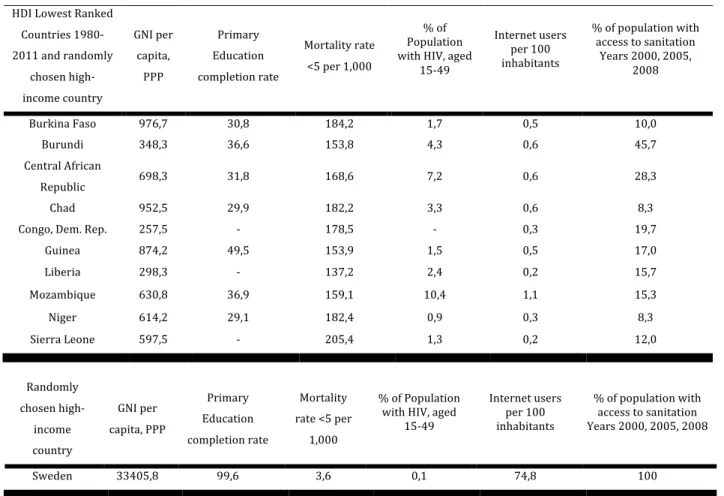
We may take Africa, where the ten countries with the lowest human development are located, as the most glaring example. Sub-‐Saharan Africa has been growing, until 2009, 5% a year during the last decade; and although there is a tenuous optimistic climate, due to slender improvements on life expectancy, health and economic performance, a simple comparison between the bottom countries on human development and a random selected high-‐income country, highlights clear problems that need to be addressed.
Table 1 – Key Development Indicators Across HDI’s Lowest Ranked Countries and High Income Country
Average of the past 12 years – 1999-‐2010 HDI Lowest Ranked
Countries 1980-‐ 2011 and randomly chosen high-‐ income country GNI per capita, PPP Primary Education completion rate Mortality rate <5 per 1,000 % of Population with HIV, aged
15-‐49 Internet users per 100 inhabitants
% of population with access to sanitation
Years 2000, 2005, 2008 Burkina Faso 976,7 30,8 184,2 1,7 0,5 10,0 Burundi 348,3 36,6 153,8 4,3 0,6 45,7 Central African Republic 698,3 31,8 168,6 7,2 0,6 28,3 Chad 952,5 29,9 182,2 3,3 0,6 8,3
Congo, Dem. Rep. 257,5 -‐ 178,5 -‐ 0,3 19,7
Guinea 874,2 49,5 153,9 1,5 0,5 17,0 Liberia 298,3 -‐ 137,2 2,4 0,2 15,7 Mozambique 630,8 36,9 159,1 10,4 1,1 15,3 Niger 614,2 29,1 182,4 0,9 0,3 8,3 Sierra Leone 597,5 -‐ 205,4 1,3 0,2 12,0 Randomly chosen high-‐ income country GNI per capita, PPP Primary Education completion rate Mortality rate <5 per 1,000 % of Population with HIV, aged
15-‐49 Internet users per 100 inhabitants
% of population with access to sanitation Years 2000, 2005, 2008
Sweden 33405,8 99,6 3,6 0,1 74,8 100
Source: Author. Data From World Development Indicators, World Bank, 2011
When carefully analysed, the figures presented on Table 1, referent to global development indicators, draw a tremendous gap between what current society believes
to be a fair context to live and the real context where 1,022,234,0003 people actually live in. At the same time, data from OECD, claims that the last decade alone, the total amount of development assistant delivered to Africa alone was of 372 015 million USD. How has such flow of assistance done so little, in promoting economic and human developing? How such flow of money still allow 72,9%4 of Africa’s total population, to live under the $2 a day line?
Currently there are diverse schools of thought addressing this issue, and pointing out a various number of causes and another handful number of possible solutions. From Moyo’s radical perspective of ending Africa’s Aid flow on the next five years, to the new perspectives of betting on long-‐term capital (clearly more focus on investment rather than on money disbursements), there are a wide range of angles, which have a common axe: strategy and strategy.
“Each country should have a matrix; in one axis they should put what needs to be done in terms of infrastructures, job creation, business climate you need to create to forest investment…
In the other one you should have the donors...and then allocate donors to needs…because if you do not have de dam, does not matter how many agriculture experts you have, we are not going to have production.
President Bush likes to say how many roads and how many schools he has reconstructed… Afghanistan will have 1.3 million graduates an you do not have jobs. These people will either join the insurgency or leave the country. You cannot just build schools, or roads… you have to have an integrated strategy. If you’re going to focus in agriculture, we have to make sure you have the irrigation, the roads to take things to market…”
(Economist Graciana del Castillo Carnegie Council event, June 17, 2010)
Before trying to provide solutions and understand causes, we first need to understand until which extent is aid not fulfilling its role on promoting development. This understanding will certainly help in recognizing if there are any collateral adverse effects coming from aid. As in any social system, the integration of any service/product provider engine, as aid is, may easily promote a subversion of its primary objective: so, is it possible that aid ends up destroying more than building up?
On the other hand, aid effectiveness is now, more than ever, a global concern, addressed by several agencies and initiatives. There is a worldwide consensus on the need to
3,3 World Bank Development Indicators
monitor aid, and in scrutinize how the potential of improvement, carried out by development assistance, is being reached. Nonetheless the results of such effort fall short on expectations:
“The results are sobering. At the global level, only one out of the 13 targets established for 2010 – coordinated technical co-‐operation (a measure of the extent to which donors co-‐ ordinate their efforts to support countries’ capacity development objectives) – has been met, albeit by a narrow margin. Nonetheless, it is important to note that considerable progress has been made towards many of the remaining 12 targets.”
(OECD (2011), Aid Effectiveness 2005-‐10: Progress in implementing the Paris Declaration, OECD Publishing.)
Easterly and Williamson (2011) paper on aid best practices, gives another point of view over the global objectives on aid effectiveness. The conclusions on the OECD enforcement effort are negative and quite objective: the quality of data and its availability do not meet any transparency standard. Monitoring institutions and aid agencies together with governments and political bodies have to be accountable for the information and the rhetoric values that they convey.
Concluding, all supposedly made “efforts” cannot justify the current reality of a handful of countries, from sub-‐Saharan Africa to Latin America. There are tremendous flows of assistance, there are specialized, skilled human capital managing those flows, and there is a monitoring program to control its effectiveness. So, what is happening?
The research question of this dissertation arises from a genuine need in explaining several empirical experiences, where the poorest stand, cordially, side by the side, with a resourceful “circus” of international aid effort.
R.Q.1: Is there any relation between the overall inflow of aid and the overall development (human and economic) of the poorest countries?
• R.Q.1.1: To what extent does sectorial directed aid relates with the same sectorial development, of both economic and human progress?
1.1 Methodology
The empirical approach used to address this question, in general terms, will be presented in the following order:
(1) Definition of a 10-‐country sample, based on lowest ranked HDI countries plus Haiti.
(2) Establish and understanding a possible relation between development and aid by crossing data concerning three key human development indicators (plus a key economic growth indicator) with the total inflow of Official development assistance, for a given country. Based on the Human development index approach (see Appendix A).
(3) Draw a framework, based on the explored literature and on the previous results, for aid effectiveness measurement.
(4) Conducting an interview to a head Director of DFID (Department for international development), confronting the interviewed with the previous results.
1.2 Structure
The structure of this dissertation is disposed as following:
Section 2 addresses the main historical views, the most relevant trends and the diversity of perspectives on foreign aid, aid’s effectiveness and best practices.
Section 3 tackles the question proposed, by trying to establish a possible relation between aid and development: we narrow the study to the ten countries with the lowest human development plus Haiti; we then understand the relation between the flows of aid they have been subjected over time and both its economic growth and human development key indicators.
Section 4 discusses the main results obtained and the implications that they might have,. Also proposes a framework analysis based on the obtained results and it also highlights the main limitations of such economic exercise.
2 LITERATURE REVIEW
2.1 Types of Aid
2.1.1 Official Development Assistance
Development Co-‐operation Directorate (DAC) realized the importance to differentiate between official transactions, which are made with the main objective of promoting the economic and social development of developing countries, and other official flows (OOF) such as military assistance.
In order to accomplish this specific objective of differentiating flows aimed exclusively to promote development, the committee adopted the concept of Official Development Assistance (ODA) in 1969:
Official development assistance is considered as any flow to countries and territories on the DAC List of ODA Recipients5 and to multilateral development institutions that are provided
by official agencies (including state and local governments) or by their executive agencies; and each transaction of which6:
a) is administered with the promotion of the economic development and welfare of developing countries as its main objective
b) is concessional in character and conveys a grant element of at least 25 per cent (calculated at a rate of discount of 10 per cent)
DAC-‐OECD
It is also important to point out that ODA includes developmental and humanitarian aid, the latter being the smallest. Moreover it does not include aid for military use. Regarding economic restructuration, debt forgiveness is counted explicitly as a category of ODA.
2.1.2 Tied Aid
Another relevant issue concerning aid and the development effort highly considered by DAC, is the definition of tying aid -‐ The amount of implicit commitments and obligations carried out by specific types of aid, with both economic and political agendas. Tied aid is
5 www.oecd.org/dac/stats/daclist
6 http://www.oecd.org/dataoecd/21/21/34086975.pdf
foreign aid that is required to be spent in the country that as provided the aid (the donor country). It can be explained either by previous Historical relations, trade relationships, geopolitical interests or cultural ties.7
As a consequence of the creation of the committee, OECD claims that in 2009, 86% of total ODA provided was untied. (Clay,Geddes and Natali, 2009)
The latest evaluation report8 on the tied status of aid, conducted by OECD, gives clear indications on a positive evolution on the amount of untied aid – The ability of moving responsibility from donors to recipients by offering local business an opportunity to compete for the more advantageous contracts. Although this encouraging picture, the report concludes that there are still much opportunities to be explored on untying aid. (Clay,Geddes and Natali, 2009)
2.1.3 Other Types of Aid
The DAC committee has been responsible for collecting and making available the most relevant data on the international development effort. The primary sources of information are its own member states.
Besides ODA, the committee keeps monitoring of three other major groups:
• Other Official Flows (OOF): transactions by the official sector (not private) that are not "development-‐motivated". The main items in OOF are export credits, official sector equity and portfolio investment, and debt reorganization.
• Private Flows are basically composed by large transnational corporations investments, private banks, and export credits given by industries. The figures for Private Flows and OOF are quite volatile from year to year because they represent a balance between positive and negative flows.
• Net Private Grants: Aid from private sources such as NGO’s, which accounts for about 15% of the total aid disbursements.
7 www.oecd.org
8 Untying Aid: Is it working? An Evaluation of the Implementation of the Paris Declaration and of the 2001 DAC
Recommendation of Untying ODA to the LDCs
2.2 Aid Laffer Curve
To even consider that is possible to increase aid’s efficiency implies an objective understanding of governments and policies reactions to aid inflows.
Is there such a thing as an Aid Laffer Curve? Is it possible to draw an explanatory model that is able to show whether the positive returns on aid increase with initial inflows and after a certain amount of aid, start to decline, even to a point where the country would be better off with fewer aid?
Governments as any country’s decision centre, assume the responsibility of regulating and managing aid accordingly to their ideals and policies. Being an aid recipient country somehow implies deficient governance; poor economic and human development or an emergent humanitarian crisis (which by itself has consequences on institutions, policies and development).
It is possible to trace a series of political, economic, ideological or even cultural motivation that lead governments to underperform, to negligence and jeopardize development. Morss (1984) was able to identify “donor proliferation”: an emergent phenomenon that was diverting government officials into “pleasing donors” instead of acting accordingly to their role and to their inherent development responsibility.
On the other hand there is a relationship between aid and investment that can clearly affect aid’s positive returns (meaning human and economic development growth): if aid reduces the productivity of investment in a large scale, then aid will reduce growth (Griffin, 1970) mainly because if aid inflows are greater than those which can be properly used in profitable investment, some of the remaining aid needs to be consumed. How? Usually by directing remaining aid to all sorts of consumer subsidies; then when there is a significant reduction in aid, in order to keep subsidies commitments, government needs to borrow, which difficult good economic performances (Lay and Sheffer, 1991)
The destruction of the government’s core function becomes an inevitable consequence once all effort is being directed to manage aid itself and not in having overall good governance. The situation is worsened by the addition of aid-‐financed subsidies obligations, which end up threatening all long-‐term expectations (Lensik and White, 2000). Therefore it is possible to establish a limit on any receiving country absorptive
capacity; being this absorptive capacity defined by a country’s ability to manage the inflow of aid.
2.2.1 Turning Point
By considering the existence of an Aid Laffer Curve it becomes crucial to define a value, which draws the line that defines how much is too much.
World bank report “Assessing Aid” (1998) states that good governance influence the effectiveness of aid and that above a certain value the inflows of aid starts to have negative effects.
There is no clear evidence that good governance is positively correlated with returns on aid inflows, but there are indications that return on aid inflows starts to be negative when aid exceeds 50% of the GNP (Lensink and White,1999). Nonetheless there are other contemporaries’ studies claiming that the turning point is around 25%(Hadjimichael et al, 1995) and 51%(Durbarry et al, 1998).
The other corroborative study (although using different methods to estimate the turning point – does not use a quadratic term of aid, uses GDP and PPP values for GDP) suggest 18,5% (assuming that PPP values for GDP are 5 times the normal value of GDP) of the GDP. (Collier and Dollar,2001).
2.3 Aid Efficiency
Efficiency defines the degree of success of a specific task or purpose based on a good use of time and effort. It evaluates the capability of a specific combination of time and effort to produce an effective outcome with a minimum amount of expenditure or unnecessary effort.
On the other side, aid is about structuring and deploying a set of resources (human and financial) from a specific donor to a recipient in order to achieve specific development goals9. Therefore Aid Efficiency, is the extend to which international cooperation inflows are able to satisfy donors primary objectives based on the following obligations:
9 (1) Eradicate extreme poverty and hunger, (2) Achieve universal primary education, (3) Promote gender equality and
empower women, (4) Reduce child mortality, (5) Improve maternal health, (6) Combat HIV/AIDS, malaria and other diseases, (7) Ensure environmental sustainability and (8) Create a global partnership for development with targets for aid, trade and debt relief -‐ http://www.un.org/millenniumgoals/
“
• Ownership: developing countries set their own strategies for poverty reduction, improve their institutions and tackle corruption
• Alignment: donor countries align behind these objectives and use local systems,
Harmonisation: donor countries coordinate, simplify procedures and share
information to avoid duplication
• Results: developing countries and donors shift focus to development results and results get measured
• Mutual accountability: donors and partners are accountable for development results.
”10
As described before, there is an inseparable association between power and aid. Now it comes to understand if this relation is bidirectional, this means, if aid is able to affect governance’s quality or if governance is able to affect aid’s efficiency
There is a broad spectrum of different perspectives having the same outcome: the evidence that the amount of aid does not systematically affect the quality of policies (Collier,1997; Williamson, 1994; Rodrik, 1996; Alesina and Dollar, 2000).
On the other hand, there is a series of authors who do not find evidence that aid becomes more effective when it is given to countries with good policies (Boone, 1994; Lev, 1987; Lensink and White, 1999). However Burnside and Dollar (2000) were able to find some evidence but their correlation values were not significantly different from zero. The study had some limitations: not enough macroeconomics indicators to define growth and lack of quantitative measures comparing to the number of policies examined. Later Collier and Dollar (2001) where able to establish a significant correlation, by increasing to twenty the analysed components, covering diverse macroeconomic issues, structural policies, public sector management and policies for social inclusion, bridging Burnside and Dollar’s limitations.
Therefore it is possible to state that aid has a marginal efficiency, considering it as the increase of income, which depends directly on the quality of policies and on the amount of aid that a country receives (diminishing returns)(Collier and Dollar, 2001).
Concluding, and under Collier and Dollar (2001) perspective, in order to maximize the reduction in poverty, aid should be allocated to countries that have large amounts of poverty (because in order to have significant effect on poverty reduction there is the need to have large scale poverty) and good policies (which ensures that aid is efficiently used).
2.3.1 Poverty-‐Efficient Aid Allocation
Assuming that all countries are different (culturally, ideologically, politically, socially, economically and at population density level), the levels of poverty and consequent absorptive capacities are different. This assumption implies that there will be a threshold of policy below which, even the first dollar of aid is not sufficiently productive to reduce poverty.
So, in order to establish this optimal allocation of aid fluxes knowing that recipients demand different allocations of inflows to increase aid efficiency, it’s needed to define three fundamental arguments (Collier and Dollar, 2001):
• Level of poverty – What is the percentage of overall population living on poverty, and how extreme that poverty is.
• The elasticity of poverty with respect to income -‐ (Bourguignon (2000) studies led him to discovered an empirical income elasticity of headcount poverty (1$ per day) of -‐1,9 in a cross section of countries. Poverty is negatively related to per capita income variations and the elasticity is sensitive to initial income inequalities. This measure shows what impact an increase of the mean income of a country has in the incidence of poverty of that same country. If the mean income rises 10% the poverty will have a reduction of around 20% once the correlation is negatively close to 2. It also states that if at the beginning there are any significantly inequalities on income distribution, the rise of the mean income wont have such a stronger impact on reducing overall poverty.
• Quality of its policies -‐ Concluding, an efficient allocation of aid is made by diverting the total available aid, to countries that are able to have a positive productivity for the first dollar received. Those countries sustain different
constrains, and therefore will require different amounts of inflow to get the same marginal productivity.
This productivity (the number of persons taken out of the poverty line, per million of dollars) is as bigger has the best policies, the higher elasticity of poverty and the highest level of poverty.
2.4 Aid Transparency
Accessing aid fully depends on the availability of the data and on its quality (both from donors and recipients).
Easterly and Pfutze (2008) conclude that: “The data on agency spending are inexcusably poor. Aid agencies are typically not transparent about their operating costs and how they spend the aid money. The data situation among aid agencies, such as the murky data available on operating costs of aid agencies and the no reporting of essential items like aid tying and sectorial shares of aid spending, would be unacceptable in most areas of economics in rich country democracies”.
The availability of the development data -‐ information such as number of employees, overall agency expenditure (aid disbursements, administrative costs) -‐ heavily relies on OECD’s11 international development statistics more specifically on Development Assistance Committee (DAC) to whom reporting is entirely voluntary. Although OECD DAC should work as an official enforcer and standardized data collector, it shows poor enforcement and low quality principles. (Easterly and Pfutze, 2008)
Without transparency, the process of monitoring aid, both by independent evaluators and taxpayers from donor countries, becomes virtually meaningless.
2.4.1 The Paris Declaration and the Accra Agenda for Action
Following the rising concern about the role of aid in promoting development, international community went further and defined the 4 principles described above (Ownership, Alignment, Harmonisation: and Results), summed up in the Paris Declaration (2005) and then consolidated at Accra Agenda for Action (2008). This
commitment was thought and structured on the unanimity that developing countries need to have control over both the elaboration and implementation of their own national development plans in fully agreement with their own priorities, in order to make aid more effective.
Resulting from the global commitment in improving the effectiveness of aid, a set of causes arose. It is possible to establish an aid supply chain, and clearly identify specific problems in several levels, that affect productivity severely.
Figure 1 -‐ Aid Intervinients on a “supply chain” scheme
Source: Author
2.5 Aid Best Practices
Easterly and Pfutze (2008), followed up by Easterly and Williamson (2011) have delineate what they consider to be the four main axes that limit aid best practices and therefore define aid’s monitoring and control:
•
Specialization/Fragmentationo Specialization, measures how fragmented or specialized aid is. Define if aid is spread among too many donors, too many countries, or too many
Citizens Companies
Governments Development Agencies Recipient Countries
Too many donors-‐by-‐ country and/or too many different projects for a single donor
Diversion of aid to “no poor” beneficiaries through ineffective channels (Ex: giving money to corrupt autocrats)
Excessively high overhead costs relative to the amount of aid dispersed