Universidade de Trás‐os‐Montes e Alto Douro
Mechanisms of Cadmium Toxicity in Fish
Osmoregulatory Responses
Tese de Doutoramento em Ciências Químicas e Biológicas
Sofia Gabriel Garcia Santos
Orientador:
Jonathan Mark Wilson
Co‐orientadores:
António Fontaínhas Fernandes
Sandra Mariza Veiga Monteiro
Sofia Gabriel Garcia Santos
MECHANISMS OF CADMIUM TOXICITY IN FISH
O
SMORREGULATORY RESPONSESDissertação de candidatura ao grau de Doutor em Ciências Químicas e Biológicas submetida à Universidade de Trás‐os‐ Montes e Alto Douro
Orientador: Professor Doutor Jonathan Mark Wilson
Investigador Auxiliar Centro Interdisciplinar de Investigação Marinha e Ambiental da Universidade do Porto.
Co‐Orientador: Professor Doutor António Fontaínhas Fernandes
Professor Catedrático da Universidade de Trás‐os‐Montes e Alto Douro
Co‐orientador: Professora Doutora Sandra Mariza Veiga Monteiro
Professora Auxiliar da Universidade de Trás‐os‐Montes e Alto Douro
Este trabalho foi expressamente elaborado como dissertação original para a obtenção do grau de Doutor em Ciências Químicas e Biológicas, de acordo com o disposto no Decreto‐Lei n.º 216/92, de 13 de Outubro
DIRETIVAS LEGAIS
No cumprimento no disposto no nº 2 do artigo 8º do Decreto‐Lei nº388/70 (Decreto‐Lei nº 216/92, de 13 de Outubro), declara‐se que a autora desta dissertação participou na conceção e execução do trabalho experimental que esteve na origem dos resultados apresentados, bem como na sua interpretação e na redação dos respetivos manuscritos. Nesta tese incluem‐se 4 artigos científicos publicados em revistas internacionais e 1 submetido a revisão para publicação, decorrentes dos resultados obtidos no trabalho experimental, referenciados como:
Garcia‐Santos, S., Monteiro, S.M., Carrola, J., Fontainhas‐Fernandes, A., 2007. Histological alterations in gills of Nile tilapia Oreochromis niloticus caused by cadmium. Arquivo Brasileiro de Medicina Veterinária e Zootecnia, 59: 376‐381.
Garcia‐Santos, S., Vargas‐Chacoff, L., Ruiz‐Jarabo I., Varela J.L., Mancera, J.M, Fontainhas‐ Fernandes, A., Wilson, J.M., 2011. Metabolic and osmoregulatory changes and cell proliferation in gilthead sea bream (Sparus aurata) exposed to cadmium. Ecotoxicology and Environmental Safety, 74: 270‐278.
Garcia‐Santos, S., Fontaínhas Fernandes, A., Monteiro, S.M., Wilson, J.M., 2013. Effects of exposure to cadmium on some endocrine parameters in tilapia, Oreochromis niloticus. Bulletin of Environmental Contamination and Toxicology, 90: 55‐59. Garcia‐Santos, S., Monteiro, S.M., Malakpour‐Kolbadinezhad S., Fontaínhas‐Fernandes, A., Wilson, J.M., 2015. Effects of Cd injection on osmoregulation and stress indicators in freshwater Nile tilapia. Comparative Biochemistry and Physiology, Part C, 167: 81‐89. Garcia‐Santos, S., Monteiro, S.M., Malakpour‐Kolbadinezhad S., Fontaínhas‐Fernandes, A., Wilson, J.M. Effects of cadmium on salinity challenge in Nile tilapia. (Submetido a Chemosphere – sob revisão).
A ti e por ti, querida filha…
ACKNOWLEDGMENTS
ACKNOWLEDGMENTS
Ao terminar esta dissertação, não posso deixar de exprimir o meu agradecimento pelas muitas e valiosas contribuições, de diversas pessoas, que tornaram possível a sua concretização:
Aos Srs. Professores Doutores Armando Mascarenhas Ferreira e Carlos Alberto Sequeira, Magníficos Reitores da Universidade de Trás‐os‐Montes e Alto Douro durante o período de realização deste trabalho, pelas facilidades concedidas.
To my Ph.D. supervisor Dr. Jonathan Mark Wilson I would like to express my deep and sincere gratitude. Many thanks for all valuable knowledge’s, encouragement and gentleness, and for your constant and promptly support throughout all this years. Most of all, thank you for your patience and faith. Thanks for your perseverance and big humanity.
Ao Sr. Professor Doutor, António Fontaínhas Fernandes, atualmente Magnífico Reitor da Universidade de Trás‐os‐Montes e Alto Douro e co‐orientador desta tese, quero expressar os meus mais sinceros agradecimentos pelo interesse e valiosos conhecimentos transmitidos, pelo empenho pessoal em reunir todos os meios e condições necessárias para a concretização desta tese, bem como pelo encorajamento e amizade que sempre me dedicou.
À Srª Professora Doutora Sandra Mariza Veiga Monteiro, co‐orientadora desta tese, mas acima de tudo Amiga de longa data… A ti, Mariza (e peço desculpa pelo agradecimento menos formal), agradeço‐te do fundinho do meu coração tudo aquilo que nestes anos partilhámos… Ideias, conhecimentos, horas (por vezes tardias) de laboratório e biotério, discussões pertinentes, escrita de artigos… mas acima de tudo por teres sido a minha âncora nesta instituição e também o meu leme… Obrigada pelo teu apoio. Obrigada por todas as vezes que riste e choraste comigo, por todo o carinho, dedicação e paciência… Obrigada pela tua amizade!..
Ao Professor Doutor João Coimbra, responsável pelo laboratório de Ecofisiologia e Presidente da Direção do Centro Interdisciplinar de Investigação Marinha e Ambiental (CIIMAR) durante o período de realização deste trabalho, pelo seu acolhimento naquela instituição, pelas facilidades concedidas e pela sua constante simpatia.
II
ACKNOWLEDGMENTS
A todos os elementos do Laboratório de Ecofisiologia do CIIMAR, o meu reconhecimento pela ajuda prestada na execução deste trabalho, pela convivência e companheirismo. À Inês e Odete, companheiras de “luta”, um agradecimento especial e muito sentido. Ao Professor Doutor Juan Miguel Mancera agradeço por me ter acolhido no seu laboratório, ter acreditado nas minhas capacidades e por todos os valiosos conhecimentos transmitidos na colaboração deste trabalho. A todo o grupo de trabalho da Universidade de Cadiz, com quem tive o prazer de partilhar o laboratório e a amizade, Jose, Nacho, Lucho, Martita, Yoli e Paco, o meu muito obrigada!
Ao Professor Doutor Luís de Carvalho e Sr. Carlos Matos do Laboratório de Química, pela disponibilização de meios técnicos e humanos na análise de alguns parâmetros químicos da água.
Ao Professor Doutor Jorge Ventura, pela solícita ajuda durante o meu curto percurso académico, pelo auxílio sempre disponibilizado nas aulas e, acima de tudo, pela amizade e simpatia.
Quero ainda expressar um agradecimento sentido aos funcionários do DEBA, em particular à Cesaltina Carvalho, pela força e determinação que sempre me transmitiu, pelo apoio incondicional e pela disponibilidade constante; à Ana Fraga e à Donzília Costa, que me viram crescer, pela amizade que me dispensaram e pela ajuda nas colheitas e processamento histológico do material. Ao Pacheco e à Lai, pelo auxílio nos assuntos documentais e de secretariado. Mais do que tudo, agradeço a todos por sempre me terem apoiado e terem tido uma palavra de incentivo nos momentos de maior desalento.
Aos colegas e amigos com quem partilhei o laboratório e muitas e intensas horas de vida. Ao Pedro, demonstro a minha gratidão pelo companheirismo, pelos sorrisos partilhados e por estares sempre presente e disponível. Ao João Carrola agradeço a preocupação que sempre demonstrou, ajuda e colaboração no trabalho de biotério. À Ana Coimbra, pela sua colaboração em algumas fases práticas do trabalho, pelo seu apoio e incentivo e pela amizade demonstrada. À Ana Luzio e Sandra pelo companheirismo, auxílio e carinho. O vosso apoio “mental” foi muito importante para a conclusão desta tese. À Rita, pela lufada de ar fresco que trouxe ao nosso
IV
ACKNOWLEDGMENTS
A todos, tenho que manifestar a minha alegria na partilha do espaço de trabalho e o facto de me proporcionarem, a cada dia, um ambiente fraterno e bem‐disposto. Ao colega que entretanto nos deixou mas que não pode, de forma alguma, ser por mim esquecido. Fernandes, obrigada mais do que tudo, pela bela lição de vida que nos deixaste como legado.
Aos meus amigos, cujos nomes me coíbo de mencionar por saber que os verão aqui refletidos, pelo apoio e pelo carinho que sempre me dedicaram e principalmente, por se terem mantido presentes. A todos, e a cada um em particular, deixo aqui registada a minha insuficiente gratidão. Aos meus “maninhos” e “sobrinhas” do peito, Tó, Sara, Tiz e Rita porque continuam sempre presentes… pela sua amizade verdadeira, por tudo… Aos meus sogros, Dª Suzete e Sr. Adriano, pelo seu constante apoio, carinho e amizade. Ao Nuno, pelo companheirismo e compreensão, pela partilha de uma vida nem sempre feita de momentos felizes. Obrigada pela tua força, por não teres duvidado de que conseguiria, por me obrigares a dar o passo em frente nos momentos de indecisão. Obrigada por me fazeres sorrir e por caminhares de mão dada comigo… Aos meus queridos Pais… Porque a eles devo tudo aquilo que sou… Por terem investido as suas vidas e tantas vezes abdicado delas para que eu pudesse percorrer este caminho, por todo o seu apoio sem limites, por todo o seu amor e carinho incondicional, por tudo aquilo que representam… Obrigada por me terem dado a liberdade suficiente para escolher o meu rumo, não sem antes me terem transmitido os valores necessários para o alcançar.
À Camila…que nasceu a meio deste caminho…O meu raio de luz que faz o sol brilhar nos dias mais cinzentos… Agradeço‐te minha querida filha, por todo o teu amor e carinho que me enchem o coração… Serás sempre a força do meu caminhar…a minha mais perfeita Tese…
VI
RESUMO RESUMO O cádmio é um metal não‐essencial, motivo de preocupação devido à sua toxicidade quer para os organismos aquáticos quer para os humanos. Este metal pode entrar no ambiente através de diversas fontes antropogénicas, tais como os subprodutos de refinaria de zinco, combustão do carvão, resíduos de minas, processos de galvanoplastia, produção de ferro e aço, pigmentos, fertilizantes e pesticidas. Os peixes eurialinos são modelos experimentais úteis, amplamente utilizados para avaliar a saúde dos ecossistemas aquáticos e os mecanismos toxicológicos de diferentes contaminantes. A salinidade vs osmolaridade de habitats aquáticos pode ser bastante variável. Estes animais desenvolveram mecanismos capazes de manter o seu equilíbrio osmótico e iónico, mesmo perante grandes variações na concentração salina da água na qual vivem.
O cádmio pode exercer uma vasta gama de efeitos patológicos em peixes. No entanto, está bem estabelecido que existem diferenças na sensibilidade ao Cd entre espécies e que, fatores ambientais como a temperatura da água, a concentração de oxigénio, pH, dureza, alcalinidade, níveis de carbono orgânico dissolvido e salinidade podem afetar significativamente a acumulação do metal e a sua toxicidade. Assim, existem inúmeras variáveis que devem ser tidas em conta ao fazer uma avaliação toxicológica dos efeitos de metais em peixes.
No presente estudo foram utilizadas, como modelos animais, duas espécies eurialinas de água doce e de água salgada: Oreochromis niloticus e Sparus aurata, respetivamente. Os peixes foram expostos a diferentes concentrações de cádmio, através da água ou através de injeção intraperitoneal e durante períodos distintos. De modo a avaliar o papel da salinidade sobre os mecanismos de toxicidade do cádmio e, por conseguinte, na osmorregulação dos peixes, as experiências foram realizadas em água doce, água salobra e água salgada.
A avaliação de alterações histopatológicas na brânquia é reconhecida como um método rápido e válido para determinar os danos causados nos peixes pela exposição a poluentes.
VIII
RESUMO
na estrutura da brânquia, nomeadamente edema intersticial, vasodilatação no eixo vascular das lamelas, destacamento do epitélio lamelar e proliferação do epitélio filamentar. Além disso, a fusão de lamelas, como resultado da hiperplasia e hipertrofia epitelial, rutura do sistema de células pilar, aneurismas e necrose, também estiveram presentes.
Usando a mesma espécie e a mesma concentração de contaminante, este trabalho mostrou que o Cd também pode ser referido como um composto desregulador endócrino, exercendo a sua ação nos eixos hipotálamo‐pituitária‐interrenal (HPI) e hipotálamo‐ pituitária‐tiroide (HPT). Foram ainda observados aumentos significativos dos níveis plasmáticos de cortisol e de glucose, bem como uma redução significativa e sustentada da concentração da hormona T3.
O aumento dos níveis de glucose, lactato e cortisol no plasma, bem como respostas de stresse oxidativo, nomeadamente o aumento da peroxidação lipídica e carboxilação das proteínas, revelaram uma condição de stresse generalizado em ambas as espécies (O.
niloticus e S. aurata) expostas ao cádmio por injeção intraperitoneal. Em tilápia exposta a
doses subletais (1,25 e 2,5 mg Cd kg‐1 peso) de cádmio, em água doce, foram ainda observadas alterações na atividade da N+/K+‐ATPase e perturbações na regulação iónica. É geralmente aceite que o aumento da salinidade reduz a toxicidade do cádmio pela formação de complexos não disponíveis aos organismos aquáticos. Mecanismos de toxicidade diferentes, em função da salinidade do meio, assim como, diferenças entre espécies, sugerem que a fisiologia, e não só a geoquímica, desempenha um papel fundamental na determinação de quão sensível é um organismo ao cádmio e como a salinidade altera a sua toxicidade.
Para elucidar os efeitos da exposição ao Cd na osmorregulação, perante alterações da salinidade do meio, espécimes de O. niloticus e S. aurata foram expostos a doses subletais de Cd (por injeção intraperitoneal) e submetidos a água salobra e hipersalina, respetivamente. Nestas condições, o cádmio afetou de forma adversa a atividade da N+/K+‐ATPase, embora sem perturbação da homeostasia iónica dos peixes. A proliferação
X
RESUMO stress oxidativo, contribuíram para minimizar os efeitos adversos do Cd na capacidade de resposta de osmorregulação perante os desafios de salinidade. Este estudo fornece algumas indicações acerca dos mecanismos de toxicidade do Cd quer ao nível fisiológico quer bioquímico. Perturbações na osmorregulação e equilíbrio iónico, alterações na atividade da N+/K+‐ATPase e alterações a nível oxidativo, são efeitos da exposição a curto prazo ao Cd, que podem ser integrados num modelo de estudo e avaliação mais abrangente do seu impacto ambiental.
XII
ABSTRACT
ABSTRACT
Cadmium is a non‐essential metal, whose occurrence in environment is cause of concern due to its toxicity to both, aquatic organisms and humans. High levels of cadmium in environment arise from various anthropogenic sources such as, by‐products from zinc refining, coal combustion, mine wastes, electroplating processes, iron and steel production, pigments, fertilizers and pesticides. Euryhaline fish are useful experimental models that have been widely used to evaluate the health of aquatic ecosystems and toxicological mechanisms of different contaminants. Due to the variability of salinity/osmolarity of aquatic habitats, fish have developed mechanisms to maintain fluid and electrolyte homeostasis across a wide range of salinities. In fish, Cd can exert a wide range of pathological effects. However, it is well established that differences in sensitivity to Cd exist among species and, in addition, environmental factors such as water temperature, oxygen concentration, pH, hardness, alkalinity, dissolved organic carbon and salinity may significantly affect metal accumulation and its toxicity in fish. Thus, there are innumerous variables that should be taken into account when making a toxicological evaluation of the metal effects in fish.
In the present study, freshwater and seawater euryhaline species were used as animal models: Oreochromis niloticus and Sparus aurata, respectively. Fish were waterborne and intraperitoneally exposed to cadmium at different concentrations and over different times. In order to evaluate the role of salinity on the mechanisms of cadmium toxicity, and therefore on fish osmoregulation, the experiments were conducted in freshwater, brackishwater and saltwater.
The assessment of gill histopathological changes is recognized as a fast and valid method to determine the damage caused in fish by the exposure to pollutants. Gills of tilapia waterborne exposed to Cd (25 mg L‐1 of CdCl
2) over 96 hours, showed histopathological changes, such as interstitial edema, swelling of the lamellae, lifting of lamellar epithelium and cell proliferation in the filament epithelium. The alterations also included lamellar
XIV
ABSTRACT
fusion, as a result of epithelial hyperplasia and hypertrophy, the breakdown of pillar cell system and aneurisms, with some ruptures and necrosis.
This work has also shown that the same Cd concentration can act as an endocrine disruption substance to Nile tilapia, exerting its action on the hypothalamus‐pituitary‐ interrenal (HPI) and the hypothalamus‐pituitary‐thyroid (HPT) axis. Significant increases in plasma cortisol and glucose levels were found, as well as, a significant and sustained decrease in plasma T3 concentrations.
The rise of plasma glucose, lactate and cortisol levels, along with an oxidative stress indicated by the increase in lipid peroxidation and protein carbonyl content, revealed that Cd cause a generalized stress condition in both species (O. niloticus and S. aurata) intraperitoneally exposed. The disruption of ion homeostasis and alterations in N+/K+‐ ATPase activity, were damages also observed in tilapia injected with sublethal doses of cadmium (1.25 and 2.5 mg kg‐1 wt).
The differences in mechanisms of Cd toxicity across salinities, and between species, suggested that physiology rather Cd geochemistry plays a crucial role in determining how sensitive an organism is to Cd, and how salinity alters Cd toxicity. To elucidate the effects of Cd exposure on salinity challenge, and therefore, in the osmoregulation, O. niloticus and
S. aurata were subjected to sublethal doses of Cd (by intraperitoneal injection) and to
environmental salinity changes (BW and HSW, respectively). Cd treatment adversely affected the N+/K+‐ATPase activity, although, without disturbance of ion homeostasis. Cell proliferation, increase in heat shock proteins (HSP) expression and oxidative stress responses contributed to mitigate the adverse effects of Cd on the ability of fish to adapt its osmoregulatory system for hypoosmoregulation during salinity challenges. This study provides some insights into the mechanisms of Cd toxicity at physiological and biochemical levels. The disruption of ion homeostasis, alterations in Na+/K+‐ATPase activity and oxidative damage are effects of Cd exposure that can be integrated in a comprehensive model for Cd impacts.
XVI
LIST OF FIGURES LIST OF FIGURES CHAPTER 1 1. Image of the Oreochromis niloticus (Source: FAO 2012). 4 2. Main producer countries of Oreochromis niloticus (FAO Fishery Statistics, 2006). 4 3. Global aquaculture production of Oreochromis niloticus (FAO Fishery Statistic). 5 4. Image of the Sparus aurata (Source: FAO 2012). 7 5. Main producer countries of Sparus aurata (FAO Fishery Statistics, 2006). 8 6. Global aquaculture production of Sparus aurata (FAO Fishery Statistic). 9 7. Schematic of water and salt exchange in freshwater (A) and seawater (B) fishes (Adapted from Edwards and Marshall, 2013). 11
8. Current model for the mechanisms of NaCl secretion by the teleost gill mitochondria‐rich cell (MRC). AC, accessory cell; CFTR, cystic fibrosis transmembrane conductance regulator; Kir, inward rectifying K+ channel; NKA, Na+/K+‐ATPase; NKCC, Na+/K+/2Cl‐ cotransporter; PV, pavement cell, SW, seawater. (Adapted from Edwards and Marshall, 2013).
13
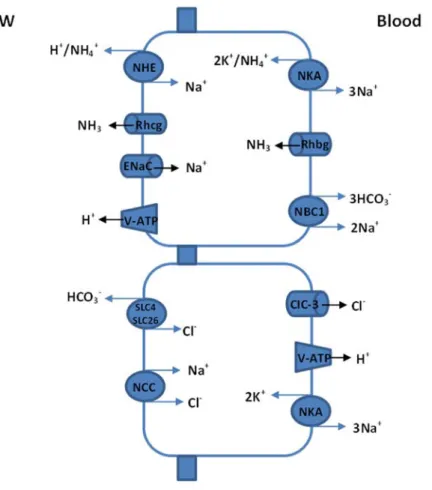
9. Current working model for ionic exchangers, channels and pumps mediating the uptake of Na+ and Cl‐ by the fish gill epithelium in freshwater. Two mitochondrion‐rich cells are diagrammed, but the actual distribution and nomenclature of the specific cells are debated and may be species specific. ClC‐ 3, chloride channel; ENaC, epithelial Na+ channel; NBC1, Na+/HCO3‐ cotransporter; NCC, Na+/Cl‐ cotransporter, NHE, Na+/H+ exchanger; NKA, Na+/K+‐ATPase; Rhbg, Rhcg, rhesus associated glycoproteins; V‐ATP, V‐type H+‐ ATPase; SLC4, SLC26, anion exchangers; FW, freshwater (Adapted from Evans, 2011).
15
10. Schematic illustrations of the structure and function of the nephron in (A) freshwater and (B) seawater teleost fishes. Representative plasma filtration rates and osmotic concentrations, tubular reabsorption and secretion processes, urine flow rates and osmolality are shown. GFR, glomerular filtration rate; Prox, proximal (Adapted from Edwards and Marshall, 2013).
20
XVIII
LIST OF FIGURES
11. Cellular model of both secretory and absorptive process in the (A) early and (B) late proximal tubule of glomerular and aglomerular marine teleosts. Prox., proximal; ECF, extracellular fluid (Adapted from Edwards and Marshall, 2013). 22 CHAPTER 2 1. Representative gill filament of control fish. cc, chloride cells; cvc, central venus sinus; e, erythrocytes, FE, filament epithelium; Lva, lamellar vascular axis; mc, mucous cell; pvc, pavement cell. Light microscopy, H&E (scale bar: 10 µm). 58
2. Lifting of lamellar epithelium (head arrows) and interstitial edema (*). Vasodilation is noted in the basis of the lamellar vascular axis. pv, pavement cells. Light microscopy, H&E (scale bar: 10 µm).
58
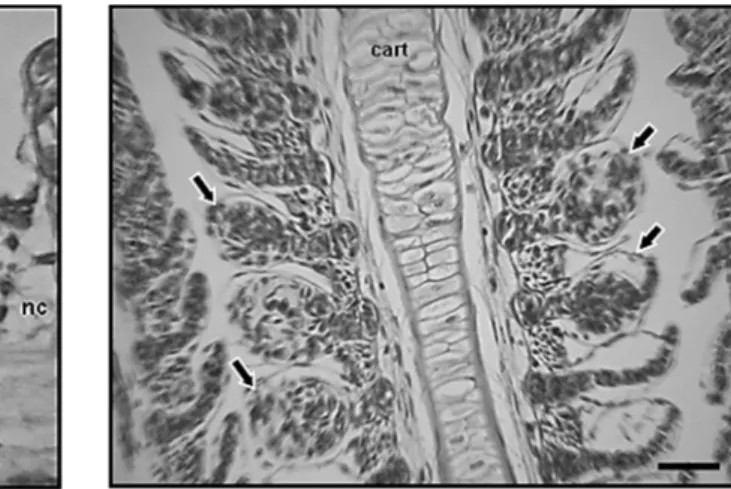
3. General proliferation of the filament epithelium with lamellar fusion (F). Interstitial edema (*).Light microscopy, H&E (scale bar: 10 µm). 58 4. Pyknotic nuclei (white arrows), cell membrane rupture (black arrows) typical of necrosis. Basal cells with bright cytoplasm and without organelles. Necrosis in the base of the filament. Light microscopy, H&E (scale bar: 10 µm). 58
5. Pillar cell rupture (pcR) linked to vascular congestion (+), pronounced justalamelar edema (*), proliferation of the filament epithelium (black arrow) and necrosis (nc). Light microscopy, H&E (scale bar: 10 µm).
59
6. Vasodilation of the lamellar vascular axis with pillar cells losing its capacity of support and aneurysms development (arrows). Light microscopy, H&E (scale bar: 10 µm).
59
CHAPTER 3
1. Time course changes in plasma concentrations of cortisol (a), glucose (b), thyroxine‐T4 (c) and tri‐idothyronine‐T3 (d) in Nile tilapia O. niloticus, after control (c) or cadmium (Cd) exposure (25 mg L‐1 of CdCl2) over 96 h. Bars with an asterisk are significantly (p<0.05) different from the control group at the same time of exposure. The values are expressed as mean ± SD (n = 8).
67
XX
LIST OF FIGURES
CHAPTER 4
1. Effect of Cd treatment and water salinity change on branchial (A) and renal (B) Na+/K+‐ATPase activity in S. aurata. Data are presented as mean ± SEM (n=8). Different letters within the same treatment group indicate significant differences (P<0.05) between seawater acclimated fish (SW) and fish transferred to high salinity water (HSW). The pound sign (#) indicates statistically significant differences (P<0.05) from the control (Ctrl) within the same salinity group.
76
2. Effect of Cd treatment and water salinity change on branchial (A)and renal (B) Na+/K+‐ATPase α subunit expression determined by immunobotting, in S. aurata and representative bands of c. 100kDa. Data are presented as mean ± SEM (n=8), relative to the SW control group. Further details as in legend of Fig.1.
76
3. Effect of Cd treatment and water salinity alteration on kidney (A) and liver (B) PCNA expression determined by immunoblotting, in S. aurata and representative immunoblots showing bands of c. 30kDa. Data are presented as mean ± SEM (n=8), relative to the SW control group. Further details as in legend of Fig.1.
77
4. Effect of Cd treatment and water salinity transfer on kidney (A) and hepatic (B) Caspase3 expression determined by immunobotting, in S. aurata and representative bands of 100 and 32kDa, respectively. Data are presented as mean ± SEM (n=8), relative to the SW control group. Further details as in legend of Fig.1.
77
5. Effect of Cd treatment and water salinity transfer on kidney HSP70 (A) and hepatic HSP90 (B) expression determined by immunobotting, in S. aurata and representative bands of 70 and 90kDa, respectively. Data are presented as mean ± SEM (n=8), relative to the SW control group. Further details as in legend of Fig.1. 78 CHAPTER 5 1. Lipid peroxidation (A) and protein carbonylation (B) values in the gill of tilapia exposed by intraperitoneal injection to different concentrations of cadmium and sacrificed after 1, 4 and 7 days. The values are expressed as mean ± SEM (n=10). Comparisons between treatment groups at the same exposure time with different lower cases are significantly different. Different capital letters within each treatment group indicate significant differences between exposure times. (P < 0.05).
XXII
LIST OF FIGURES
2. Branchial (A) and renal (B) Na+/K+‐ATPase activity of tilapia exposed by intraperitoneal injection to different concentrations of cadmium and sacrificed after 1, 4 and 7 days. The values are expressed as mean ± SEM (n= 10). All other details are identical to those in Fig. 1 legend.
89
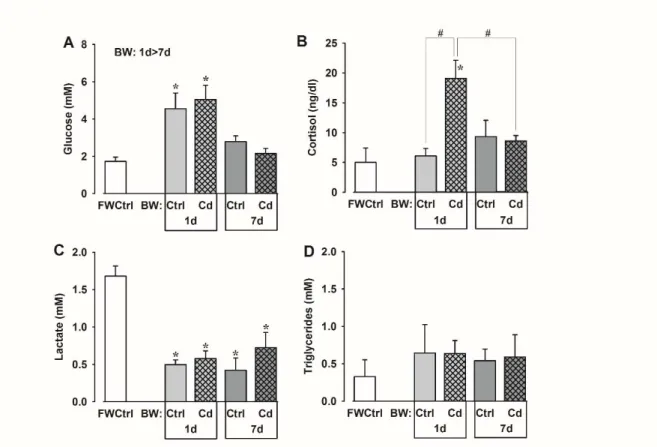
3. Effect of Cd intraperitoneal injection on Na+/K+‐ATPase α‐subunit, PCNA and HSP70 expression determined by immunoblotting, in the gill (A, C, E) and kidney (B, D, F) of O. niloticus, after 1 and 7 days of exposition. The values are expressed as mean ± SEM (n= 10) relative to Cd0‐1d. All other details are identical to those in Fig. 1 legend. 90 CHAPTER 6 1. Effect of salinity alone and salinity + Cd exposures on plasma Na+ (A) and Ca2+ (B) levels of tilapia after 1 and 7 days exposure. The values are expressed as mean ± SEM (n=8). Differences between the FW Ctrl with BW Ctrl and Cd groups are indicated by an asterisk (1‐way ANOVA, post hoc Dunnet’s test) (P<0.05). 110 2. Effect of salinity alone and salinity + Cd exposures on plasma glucose (A) cortisol (B), lactate (C) and triglycerides (D) levels of tilapia sampled after 1 and 7 days. The values are expressed as mean ± SEM (n=8). Comparisons between the FWCtrl group with BW Ctrl and Cd groups with significant differences are indicated by asterisks (1‐way ANOVA, and post hoc Dunnet’s test). Ctrl and Cd groups in BW at 1 and 7 d were analyzed by 2‐way ANOVA and post‐hoc Fisher LSD tests. The pound sign (#) indicates significant differences between groups. (P<0.05). 111 3. Effect of salinity alone and salinity + Cd exposures on the activity and abundance of branchial (A, C) and renal (B, D) Na+/K+‐ATPase in tilapia sacrificed after 1and 7 days. The values are expressed as mean ± SEM (n=8). All other details are identical to those in Figure 2 legend.
112
4. Effect of salinity alone and salinity + Cd on HSP70 and PCNA expression determined by immunoblotting, in gill (A, C) and kidney (B, D) of tilapia, after 1 and 7 days of exposure. The values are expressed as mean ± SEM (n=8). All other details are identical to those in Figure 2 legend.
XXIV
LIST OF TABLES LIST OF TABLES CHAPTER 1 1. Taxonomic hierarchy of Nile tilapia. 3 2. Taxonomic hierarchy of Gilthead seabream. 7 CHAPTER 4 1. Hepatosomatic index (HSI), and plasma osmolality, sodium, calcium, chloride, cortisol, glucose, lactate, triglycerides, protein concentrations in S. aurata control and treated with Cd (1.25 mg Cd/kg body wt), acclimated to SW and transferred to HSW for 4 days. Data are presented as mean ± SEM (n=8). Values with different capital letters within the same salinity group (on the same line) are significantly different. Within either control or Cd exposure groups, values with different lowercase letters (in the same column) are significantly different. (P<0.05, two‐way ANOVA, SNK test).SW=seawater acclimated fish; HSW=fish transferred from SW to HSW.
75
2. HSP 70 and 90, and metallothionein (MT) expression determined by immunoblotting in gill, liver and kidney of S. aurata control and treated with Cd (1.25 mg Cd/kg body wt), acclimated to SW and transferred to HSW for 4 days. Data are presented as mean ± SEM (n=8). SW=seawater acclimated fish; HSW=fish transferred from SW to HSW; HSP=heat shock proteins; MT= Metallothionein. Values are presented relative to the SW Control group. 78 CHAPTER 5 1. Morphometric parameters and muscle water content of O. niloticus injected with different cadmium concentrations. Data are presented as mean ± SEM (n = 10). Values with different lowercase letters within the same time of exposure (in the same line) are significantly different. Within each Cd treatment, values with different capital letters (in the same column) are significantly different. (P<0.05, two‐way ANOVA, SNK test). Cd0 = fish injected with 0.9% NaCl (control); Cd 1.25 and Cd 2.5 = Fish injected with 1.25 and 2.5 mg Cd kg−1, respectively.
XXVI
LIST OF TABLES
2. Concentrations of Cd in μg g−1 drymass in the gills and kidney of tilapia intraperitoneally injected with either saline (Cd 0), 1.25 mg kg−1 of Cd (Cd 1.25), or 2.5 mg kg‐1 of Cd (Cd 2.5). Data are presented as mean ± SEM (n =3). Values with different lowercase letters within the same time of exposure (in the same row) are significantly different. Within each Cd treatment, values with different capital letters (in the same column) are significantly different. (P < 0.05, two‐way ANOVA, SNK test).
88
3. Biochemical parameters measured in plasma of O. niloticus injected with different cadmium concentrations. Data are presented as mean ± SEM (n=10). Values with different lowercase letters within the same time of exposure (in the same line) are significantly different. Within each Cd treatment, values with different capital letters (in the same column) are significantly different. (P < 0.05, two‐way ANOVA, SNK test). Cd0 = fish injected with 0.9% NaCl (control); Cd 1.25 and Cd 2.5 = Fish injected with 1.25 and 2.5 mg Cd kg−1, respectively. 88 CHAPTER 6 1. Condition factor (K), hepatosomatic index (HIS), hematocrit (Hct) and muscle water content (MWC%) in O. niloticus acclimated to FW and transferred to BW alone or combined with Cd (2.5 mg Cd kg1 body mass) for 1 and 7 days. Data are presented as mean ± SEM (n=8). In FW versus BW group comparisons, the asterisk indicates a significant difference from the FWCtrl group (One‐way ANOVA). # In comparisons between BW groups, Ctrl<Cd. (two‐way ANOVA). N=8.
108
2. Na+ and K+ concentration (μmol g‐1 wet mass) and Na+/K+ ratio in muscle of O.
niloticus transferred to BW alone or combined with Cd injection (2.5 mg Cd kg‐ 1 body mass) for 1and 7 days. * Muscle [Na+] significant time and treatment effects: 1d > 7d; BWCtrl > BWCd, no interaction (P < 0.05, two‐way ANOVA). 109
XXVIII
ABBREVIATIONS ABBREVIATIONS aa – amino acids ACs ‐ Accessory cells ACTH ‐ Adrenocorticotropic hormone ADP – Adenosine biphosphate ANOVA ‐ Analysis of variance ATP – Adenosine triphosphate ATPase ‐ Adenosine triphosphatase BCA ‐ Bicinchoninic acid BHT – Butylated hydroxytoluene BLM ‐ Biotic ligand model Br‐ ‐ Bromide ion BSA – Bovine serum albumin BW – Brackishwater CA ‐ Carbonic anhydrase Ca2+ ‐ Calcium ion CaCl2 – Calcium chloride CC, cc – Chloride cells Cd ‐ Cadmium Cd2+ ‐ Cadmium ion CdCl2 – Cadmium chloride CdS ‐ Cadmium sulfide
CFTR ‐ Cystic fibrosis transmembrane conductance regulator
CIIMAR – Centro Interdisciplinar de Investigação Marinha e Ambiental
CITAB – Centro de Investigação e de Tecnologias Agro‐Ambientais e Biológicas Cl‐ ‐ Chloride ion ClC‐3 ‐ Chloride channel CO2 – Carbon dioxide
CPP32 – Polyclonal rabbit anti‐human caspase 3 cvc ‐ Central venus sinus Cys ‐ Cysteine DNPH – 2,4‐Dinitrophenylhydrazine DO – Dissolved oxygen e ‐ Erythrocytes ECaC ‐ Epithelial Ca2+ channel ECL ‐ Electrochemiluminescence EDTA – Ethylenediamine tetraacetic acid ELISA ‐ Enzyme‐linked immunosorbent assay ENaC ‐ Epithelial Na+ channel EPA ‐ Environmental Protection Agency FAO – Food and Agriculture Organization FE ‐ Filament epithelium FW – Freshwater GSH ‐ Glutathione H&E ‐ Hematoxylin and eosin stain H+ ‐ Hydrogen ion H2O2 ‐ Hydrogen peroxide HCl – Hydrochloric acid HCO3‐ ‐ Bicarbonate ion Hct ‐ Hematocrit HO2‐ Hydroperoxyl radical HPI ‐ Hypothalamus‐pituitary‐interrenal axis HPT ‐ Hypothalamus‐pituitary‐thyroid axis HRP – Horseradish peroxidase
XXX
ABBREVIATIONS HSP – Heat shock proteins HSW ‐ Hypersaline water i.p. – intraperitoneal K – Condition factor K+ ‐ potassium ion KDa ‐ kilodalton Kir – inwardly rectifying K+ channel kPa ‐ Kilopascal LC50 – Median lethal concentration LPO ‐ Lipid peroxidation Lva ‐ Lamellar vascular axis M – Molarity (mol/L) mc ‐ Mucous cell MDA – Malondialdehyde Mg2+ ‐ Magnesium ion mM ‐ Millimolar mOsm ‐ Milliosmole MRC ‐ Mitochondrion‐rich cells mRNA – Messenger RNA MTs ‐ Metallothioneins MWC – Muscle water content n.d. – Not detectable Na+ ‐ Sodium ion NaCl – Sodium chloride
NADH ‐ Reduced nicotinamide adenine dinucleotide
NBC1 ‐ Na+/HCO3 cotransporter nc ‐ Necrosis
NCC ‐ Na+/Cl‐ cotransporter
NCX ‐ Na+/Ca2+ exchanger
NH4+ ‐ Ammonium ion + + NKA ‐ Na+/K+‐ATPase NKCC ‐ Na+/K+/2Cl‐ cotransporter, bumetanide‐sensitive cotransporter NO3‐ ‐ Nitrate ion O2‐‐ Superoxide anion radical ‐OH ‐ Hydroxyl radical PCNA ‐ Proliferating cell nuclear antigen PCO ‐ Protein carbonyl pcR ‐ Pillar cell rupture PMCA ‐ Plasma membrane Ca2+‐ATPase PNA ‐ Peanut lectin agglutinin ppm – parts per million ppt – parts per trillion PRL ‐ Prolactin PV, PVCs ‐ Pavement cells PVDF ‐ Polyvinylidene difluoride Rhbg, Rhcg ‐ Rhesus associated glycoproteins ROS ‐ Reactive oxygen species SDS ‐ Sodium dodecyl sulfate
SDS‐PAGE – Sodium dodecyl sulfate polyacrylamide gel electrophoresis SEM ‐ Standard error of the mean SLC4, SLC26 ‐ Anion exchangers SNK – Student Newman Keuls test SO42‐ ‐ Sulphate ion
SPSS ‐ Statistical Package for the Social Sciences
SW – Seawater T3 ‐ Triiodothyronine T4 – Thyroxin
XXXII
ABBREVIATIONS
TBARS ‐ Thiobarbituric acid reactive substances
TCA – Trichloroacetic acid TIFF ‐ Tagged Image File Format
TTBS ‐ Mixture of Tris‐Buffered Saline and Tween 20
UNEP – United Nations Environment Programme
USEPA ‐ United States Environmental Protection Agency UTAD‐ Universidade de Trás‐os‐Montes e Alto Douro V‐ATP ‐ V‐type H+‐ATPase WHO ‐ World Health Organization Wt – Weight °C ‐ Degree Celsius 12D:12L – 12h dark, 12h light
XXXIV
TABLE OF CONTENTS
TABLE OF CONTENTS
AKNOWLEDGMENTS I RESUMO VII ABSTRACT XIII LIST OF FIGURES XVII LIST OF TABLES XXV ABBREVIATIONS XXIX TABLE OF CONTENTS XXXV CHAPTER 1 General Introduction 1 1.1 Test species 3 1.1.1 Nile tilapia (Oreochromis niloticus) 3 1.1.2 Gilthead seabream (Sparus aurata) 6 1.2 Fish osmoregulation 10 1.2.1 General principles 10 1.2.2 Gills and ion transport models 12 1.2.3 Kidney and reabsorption/secretion processes 19 1.3 Cadmium 24 1.3.1 Environmental occurrence 24 1.3.2 Toxicity in aquatic systems 25 1.3.3 Uptake and tissue distribution in fish 27
XXXVI
TABLE OF CONTENTS Ionoregulation effects 30 Histological effects 31 Endocrine disruption 32 Oxidative damage 33 1.4 Research objectives 35 1.5 References 37 CHAPTER 2 Histological alterations in gills of Nile tilapia Oreochromis niloticus caused by cadmium 53 CHAPTER 3 Effects of exposure to cadmium on some endocrine parameters in tilapia, Oreochromis niloticus 65 CHAPTER 4
Metabolic and osmoregulatory changes and cell proliferation in gilthead
sea bream (Sparus aurata) exposed to cadmium 73
CHAPTER 5
Effects of cadmium injection on osmoregulation and stress indicators in
freshwater Nile tilapia 85 CHAPTER 6 Effects of cadmium on salinity challenge in Nile Tilapia 97 CHAPTER 7 Concluding remarks 131
XXXVIII
General Introduction
CHAPTER 1
CHAPTER 1 1.1 TEST SPECIES 1.1.1 Nile tilapia (Oreochromis niloticus) The name tilapia includes many species of the Cichlidae family belonging to the Perciformes order and Actinopterigii class (Table 1). These fish are endemic to Africa and the Midle East, but they have been introduced into most tropical and subtropical countries for aquatic weed control and aquaculture. There are three major taxonomic groups. Species of the genus Tilapia are substrate brooders which deposit their eggs in nests excavated in the sediment. Species of the genus Oreochromis are maternal mouth brooders, e.g., the females incubate the eggs in their mouths. Species of the genus Sarotherdon are maternal and paternal mouth brooders (Boyd, 2004). Table 1: Taxonomic hierarchy of Nile tilapia Superkingdom Eukaryota Kingdom Metazoa Phylum Chordata Subphylum Craniata Superclass Gnathostomata Class Actinopterygii Superorder Acanthopterygii Order Perciformes Suborder Labroidei Family Cichlidae Subfamily Pseudocrenilabrinae Genus Oreochromis Species Oreochromis niloticus (Linnaeus, 1758) Source: NCBI Taxonomy database (USA), Sayers et al. (2009).
CHAPTER 1
4
The Nile tilapia Oreochromis niloticus (Fig. 1) is a deep‐bodied fish with cycloid scales. Silver in color with olive/grey/black body bars, the Nile tilapia often flushes red during the breeding season (Picker and Griffiths, 2011). It grows to a maximum length of 62 cm, weighing 3.65 kg (at an estimated 9 years of age) (FAO, 2012). The average size (total length) of O. niloticus is 20 cm (Bwanika et al., 2004).
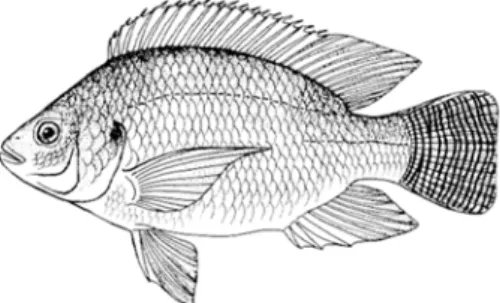
Figure 1: Image of the Oreochromis niloticus (Source: FAO, 2012).
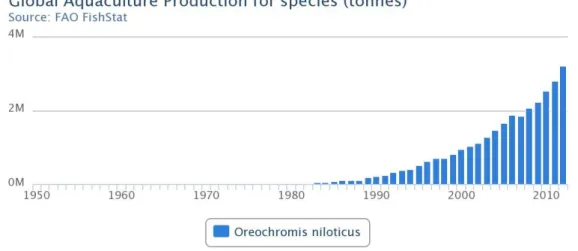
Tilapias have traditionally been important in capture fisheries, but the culture of these species has increased and now exceeds the wild catch. Nile tilapia is the predominant cultured species worldwide (Fig. 2). Figure 2: Main producer countries of Oreochromis niloticus (FAO Fishery Statistics, 2006).
CHAPTER 1 Data from FAO on world production of Nile tilapia in aquaculture by 2012 are provided in Figure 3. Aquaculture production increased from about 1 million tonnes in 2000 to over 3 million tonnes in 2012. Nile tilapia is a tropical species that prefers to live in shallow water. It tolerates a wide range of values for the main physical and chemical parameters of water. The lower and upper lethal temperatures for Nile tilapia are 11‐12 °C and 42 °C respectively, although the best growth rates have been recorded in water temperatures between 28 and 32 °C. The reproduction of O. niloticus does not occur at temperatures below 20 °C and are inactive at 16 °C. In fact, this is the minimum required temperature for growth (Ombredane et al., 1990).
In general, species of the genus Oreochromis are omnivorous and, under natural conditions, tilapia feed on phytoplankton, zooplankton, detritus, benthic organisms, and others (Bowen, 1982). They are popular as a culture species because of their ability to efficiently use both natural organisms and manufactured feed under crowded conditions allowing high levels of production (Boyd, 2004). Their feeding activity is primarily diurnal, although sometimes it can happen during the night. Also, there are no differences in feeding behavior between males and females (Toguyeni, 1996).
CHAPTER 1
6
Tilapia is a euryhaline teleost more tolerant than most commonly farmed freshwater fish to high salinity, high water temperature, low dissolved oxygen and high ammonia concentrations (Popma and Masser, 1999). All tilapia are tolerant to brackish water. The Nile tilapia is the least saline tolerant of the commercially important species, but grows well at salinities up to 15 ppt (Fontaínhas‐Fernandes, 2002). Moreover, survive at dissolved oxygen (DO) concentrations of less than 0.3 mg/L and in pH ranging from 5 to 10 (Popma and Masser, 1999) however, the best growth rates were observed in tilapia in water with a pH ranging between 7 and 8 (Fontaínhas‐Fernandes, 1999). According to this author, tilapia tolerates high levels of ammonia, especially when compared to salmonids. The same applies to the contents of nitrites.
In addition to its interest for aquaculture, tilapias are being increasingly used for other purposes in fish biology research, including toxicology (Wright et al., 2004). In fact, these fishes have proven to be very useful, either as sentinel organisms in environmental studies or in laboratory toxicant assays (Law, 2004). Nile tilapia is considered a good model for toxicological experiments due to its high growth rates, easy adaptation to commercial diets, resistance to diseases and injury from handling practices, unproblematic reproduction in captivity and good tolerance to a wide variety of husbandry conditions (Fontaínhas‐Fernandes, 1998; Campos‐Mendoza et al., 2004).
Regarding their physiological characteristics and due to their low maintenance and bioassay costs, Nile tilapia (Oreochromis niloticus) were chosen as animal model, in the present work.
1.1.2 Gilthead seabream (Sparus aurata)
The gilthead sea bream (Sparus aurata, L.) is a marine teleost that belongs to the family Sparidae (Table 2). It presents a body with an oval shape, very high and laterally compressed. The head profile is convex with small eyes (Fig. 4). The cheeks are covered with scales and the pre‐opercular bone is scaleless. The gilthead seabream colour is silver‐ grey with a big dark spot at the beginning of the lateral line that covers also the upper part of the opercular bone. A gold and a black band is found between the eyes, the golden one
CHAPTER 1 always narrow in the central part. The dorsal fin is blue‐grey with a median black line. The caudal fin is grey‐greenish white with black tips. Table 2: Taxonomic hierarchy of Gilthead seabream. Source: NCBI Taxonomy database (USA), Sayers et al. (2009). Figure 4: Image of the Sparus aurata (Source: FAO 2012). Sparus aurata is commonly distributed in the Mediterranean Sea, present in the Eastern Atlantic and rarely encountered in the Black Sea. This species together with the seabass are the two marine fish species which have characterized the development of marine aquaculture in the Mediterranean basin over the last decades. The substantial increase in production levels has been possible thanks to the progressive improvement of the
Superkingdom Eukaryota Kingdom Metazoa Phylum Chordata Subphylum Craniata Superclass Gnathostomata Class Actinopterygii Superorder Acanthopterygii Order Perciformes Suborder Percoidei Family Sparidae Genus Sparus Species Sparus aurata (Linnaeus, 1758)
CHAPTER 1
8
technologies involved in the production of fry in hatcheries. At present the farmed production of S.aurata derived from hatchery produced fry is far greater than the supply coming from capture fisheries (Moretti, 2005). Data from FAO on main producer countries and global aquaculture production of Sparus aurata are present in Figures 5 and 6. In 2012 the world production in aquaculture reached about 160 000 tonnes.
As an euryhaline species, gilthead sea bream inhabits marine or brackish water environments of seagrass beds, sandy or rocky bottoms, and can reach from 30 to 150 m depth as an adult. It is mainly carnivorous, predating on shellfish, crustaceans and fish, and accessorily herbivorous. It is a protandrous hermaphrodite with a breeding period ranging from October to December depending on social, environmental (photoperiod, water temperature) and genetic factors For the first two years gilthead sea bream is a functional male and at sizes over 30 cm it turns to female (Moretti et al., 2005; Zohar et al., 1978).
CHAPTER 1 Due to the great importance of gilthead seabream for the marine aquaculture an increasing number of scientific papers exploring its physiology, nutrition, immune response, growth performance, reproduction and genetics have been produced (for review, see Pavlidis and Mylonas, 2011). Human activities in coastal areas of the Mediterranean and Southern Europe result in high concentrations of contaminants. The investigation of metal toxicity in marine species and studies about interaction of salinity and Cd toxicity are scarce. For these reasons and due to the great importance of gilthead seabream for the marine aquaculture this species was chosen as animal model in the present work. Figure 6: Global aquaculture production of Sparus aurata (FAO Fishery Statistic).
CHAPTER 1 10 1.2 FISH OSMOREGULATION 1.2.1 General Principles
The salinity/osmolarity of aquatic habitats can be quite variable. Fish have developed mechanisms for maintaining fluid and electrolyte homeostasis across a wide range of salinities. Marine teleosts, freshwater teleosts, and marine elasmobranchs all utilize different physiologic strategies for osmoregulation. Elasmobranchs are slightly hyperosmotic (relative to seawater) by using urea as an osmolyte but maintain a lower NaCl content by active NaCl secretion via the rectal gland. Teleost fishes maintain the osmolality of their extracellular body fluids relatively constant at approximately 300 mosmol kg−1 (which is isosomotic to 9 g kg−1 salinity), independent of environmental salinity (Kültz, 2015).
While most fishes are stenohaline and thus unable to move between freshwater and seawater, remarkably 3‐5% of fishes are euryhaline and thus capable of surviving in a wide range of salinities, being important model species for elucidating the mechanisms of salt and water balance and other physiological processes (Edwards and Marshall, 2013). As it stated in the previous section, in the present work, freshwater (FW) and seawater (SW) euryhaline species were used as animal models: Oreochromis niloticus and Sparus aurata, respectively. The physiology of euryhaline fish changes dramatically depending on whether the fish is located in FW, which is hypoosmotic to the extracellular fluids of the animal, or in SW, which is hyperosmotic to its internal environment (Evans and Claiborne, 2008; Evans et al., 1999). FW fishes face diffusive ion loss and osmotic gain of water across the gill epithelium and other permeable external surfaces. To counter this, the animal produces large volumes of dilute urine and gain ions via active transport of both Na+ and Cl‐ across the gill epithelium from water and via the intestine from ingested food (Fig 7A). SW teleosts face osmotic loss of water across their gills and other permeable external surfaces. They drink
CHAPTER 1 seawater to maintain osmotic balance, absorbing water and salts but excreting the excess salts. The site for absorption of ingested water and salts is the esophagus and intestine. The salt load is transported via the blood to gills and skin, where it is excreted (Fig. 7B). Also, any excess uptake of divalent ions is excreted by the kidney (Edwards and Marshall, 2013).
From the above, it is understood that the gill and kidney are important organs of osmoregulation in fish. Although other sites like alimentary tract, rectal gland (elasmobranchs) and the urinary bladder are equally important sites for maintaining osmotic homeostasis, the gill and the kidney were subject of study in our work and for that reason, in this review, we will focus these organs. Figure 7: Schematic of water and salt exchange in freshwater (A) and seawater (B) fishes (Adapted from Edwards and Marshall, 2013).
A
B
CHAPTER 1 12 1.2.2 Gills and ion transport models The fish gill is the predominant site for osmotic and ionic regulation, acid‐base regulation, and removal of nitrogenous wastes, as well as the major site of gas exchange. The entire cardiac output perfuses the gill vasculature before re‐entering the systemic circulation. The afferent arteriole feeds the posterior side of each filament and supplies the lamellae, which are the site of gas exchange. The oxygenate blood is carried by the efferent arterioles to a central sinus and filament vessels that, in turn, supply the ion‐transporting cells of filament epithelium. The gills of FW teleosts are the major site of ion uptake from the dilute environment, whereas the gills in marine teleosts are the major site of salt secretion (Evans et al., 2005).
Specific ionocytes, the mitochondrion‐rich (MR) cells (formerly called chloride cells), are the major cells in fish gills that actively transport ions. These ionocytes secrete and absorb ions in SW and FW environments respectively, in addition to carrying out acid‐base regulation and ammonia excretion functions (Evans, 2008; Evans et al., 2005; Gilmour and Perry, 2009; Hirose et al., 2003; Hwang, 2009; Hwang and Lee, 2007; Hwang and Perry, 2010; Marshall and Grosell, 2005; Perry and Gilmour, 2006; Perry et al., 2003).
The epithelial ionocytes of SW teleost fish gill was first described by Keys and Willmer (1932). It has distinct basolateral infoldings, significant Na+/K+‐ATPase activity and numerous mitochondria. According to Evans et al. (2005), ionocytes are commonly localized in interlamelar regions of the gill filament epithelium, with a concave apical membrane recessed below the surface of surrounding pavement cells (PVCs) to form an apical crypt. In fact, PVCs are closely joined to one another and to neighboring ionocytes by numerous desmosomes and deep tight junctions at the apical surface. SW ionocytes always exist as a complex with other ionocytes and accessory cells (ACs). These last cells project cytoplasmatic processes into the apical membrane of the ionocyte, forming leaky junctions that are not extensive and provide a paracellular pathway for Na+ extrusion (Edwards and Marshall, 2013). Ionocytes in the SW teleost gill primarily excrete NaCl through passive transport of Na+, coupled to the secondary active transport of Cl‐ (Evans et al., 2005). The current ion‐transporting system depicted in the working model for NaCl secretion (Fig.8) includes the ouabain‐inhibit Na+/K+‐ATPase (NKA) and bumetanide‐
CHAPTER 1
sensitive Na+/K+/2Cl‐ cotransporter (NKCC) located in the basolateral membrane; the anion channel cystic fibrosis transmembrane conductance regulator (CFTR) in the apical membrane; and the tight‐junction proteins, claudins and occludins, located between adjacent epithelial cells (Hwang et al., 2011). The basolateral NKCC mediates the entry of Na+ and Cl‐ into the cellular compartment down the electrochemical gradient provided by NKA, followed by passive exit of Cl‐ and Na+, respectively, through the apical channel CFTR and paracellular tight‐junctions pathway (Evans et al., 2005; Hirose et al., 2003; Hwang and Lee, 2007; Marshall and Grosell, 2005). In addition, basolateral recycling of K+ is achieved by an inwardly rectifying K+ channel, which has an increased expression in gills of SW‐ acclimated cells (Suzuki et al., 1999; Tse et al., 2006). Also, the independent Ca2+ absorptive pathway (that is the essentially the same in seawater and in freshwater) is shown in the Fig. 8. The process involves apical Ca2+ entry via channels and exit via a basolaterally located Na+/Ca2+ exchanger and Ca2+‐ATPase pump.
Figure 8: Current model for the mechanisms of NaCl secretion by the teleost gill mitochondria‐rich cell (MRC). AC, accessory cell; CFTR, cystic fibrosis transmembrane conductance regulator; Kir,
Na+ Na+ PV AC PV NKCC MRC ATP Cl‐ Cl‐ K+ Na+ Na+ K+ K+ Ca2+ Ca2+ Ca2+ Ca2+ Na+ CFTR Kir
SW
Blood
CHAPTER 1 14 Freshwater teleosts face diffuse ion loss, which is countered in part, by active ion uptake across the gills. Two distinct populations of branchial epithelial cells are associated with ion transport in FW fishes: the ionocytes and the PVCs. Pavement cells form an epithelial layer that is continuous along the lamellae and interlamellar junctions, and are connected to each other and adjacent ionocytes by tight junctions. While PVCs lack the metabolic machinery to drive ion transport (Evans et al., 2005), immunohistochemistry has localized several ion transport proteins in PVCs of FW‐adapted fishes (Edwards et al., 1999; Wilson et al., 2000), suggesting a role in ion transport.
Since the late '30s that it is accepted that freshwater fishes extract needed NaCl from the environment via parallel Na+/NH
4+ and Cl‐/HCO3‐ exchangers (Krogh, 1937, 1938). According to this researcher the Cl‐ uptake was independent of the cation (Na+, K+, NH
4+ and Ca2+) and the uptake of Na+ was independent of the anion (Cl‐, Br‐, HCO
3‐ and NO3‐). Since then, these Na+/Cl‐ linked acid/base transport mechanism have been examined, and the results are still being debated among different species and various external water conditions to the present (Marshall, 2002; Hirose et al., 2003; Perry et al., 2003b; Evans et al., 2005). Besides, there is still considerable discussion on the cellular localization and molecular supporting of these transport processes (Hwang and Lee, 2007). A current working model for ionic exchangers, channels and pumps mediating the uptake of Na+ and Cl‐ by the fish gill epithelium in freshwater is presented in Figure 9.
Na+ uptake. At least two models have been proposed for the apical transport of Na+ in FW fish gill cells: (1) an apical V‐type H+‐ATPase electrically linked with Na+ absorption via the epithelial Na+ channel (ENaC) and (2) an electroneutral exchange of Na+ and H+ via an apical Na+/H+ exchanger (NHE) (Hwang and Lee, 2007).
NHE transports Na+ from the water into the cell in exchange for proton (or NH
4+). Other studies have suggested that un‐ionized NH3 combines with proton to produce NH4+, which is trapped after leaving the cell, thus preventing the back flux of H+ (Hwang and Lee, 2007; Perry et al., 2003a,b; Tresguerres et al., 2005). Moreover, this Na+ and proton exchange (either H+ directly or H+ that is chemical combined with NH
3) is electro‐neutral, depending solely on the predominant electrochemical gradients for both Na+ entry and proton excretion. There is a thermodynamic argument that an Na+/H+ exchange could not function


![Table 2: Na + and K + concentration (μmol g ‐1 wet mass) and Na + /K + ratio in muscle of O. niloticus transferred to BW alone or combined with Cd injection (2.5 mg Cd kg ‐1 body mass) for 1and 7 days. 1d 7d BWCtrl BWCd BWCtrl BWCd [Na + ]*](https://thumb-eu.123doks.com/thumbv2/123dok_br/15943331.1096566/157.892.130.791.654.845/table-concentration-niloticus-transferred-combined-injection-bwctrl-bwctrl.webp)