219
TOURISM
Original scientifi c paper Luís PachecoVol. 64/ No. 2/ 2016/ 219 - 230 UDC: 338.488.2:640.41(469)
Luís Pacheco
RevPAR determinants of Portuguese hotels:
The global and the local factors
Abstract
Th e research about the determinants of fi rms' performance has been a crucial question for managers,
researchers and stockholders. Th e main objective of this exploratory paper is to study the economic
drivers of revenue per available room (RevPAR) in the Portuguese hotels. Th is study examines the local
and global factors driving RevPAR in diff erent hotel segments, calculating how much of the overall changes in RevPAR are explained by national factors and how much by broader factors. Using seemingly unrelated regression analysis and considering monthly data from 2011 to 2015, the results indicate that local variables are more important than the global ones, with that diff erence more striking for the 4 star hotels. In aggregate terms, local factors account for 55% of the changes in Portuguese hotels
RevPAR. Th e US consumer sentiment index is never signifi cant and the EU and Portugal consumer
confi dence indexes do not seem to be important drivers of RevPAR for the diff erent categories of
ho-tels. Th e results show that the hotel sector performance is closely related to cyclical factors, especially
to tourism growth. Although in recent years Portugal has enjoyed a strong surge in the number of tourists, in part motivated by external factors, the results demonstrate the high vulnerability of the sector to those volatile and out of our infl uence variables, highlighting the danger of some reversion in the medium term.
Key words: hotels; tourism growth; Seemingly Unrelated Regression (SUR) analysis; RevPAR;
hospi-tality management; Portugal
Luís Pacheco, Portucalense University, Department of Economics, Management and Computer Sciences, Porto, Portugal; E-mail: [email protected]
Introduction
Th e research about the determinants of fi rms' performance has been a crucial question for managers,
researchers and stockholders (Schmalensee, 1985; Rumelt, 1991; Opler & Titman, 1994; Hawawini, Subramanian & Verdin, 2003). Particularly in the tourism and hospitality sectors, research about the fi rms performance tends to focus on a national perspective (Gursoy & Swanger, 2007; Reichel & Haber, 2005) or on a particular hotel group perspective (Ham, Kim & Jeong, 2005; Madan, 2007).
Th is research studies the economic drivers of revenue per available room (RevPAR) in the Portuguese
hotels (namely, those of fi ve, four and less than four stars category). It examines the national and global factors driving RevPAR in diff erent hotel segments, calculating how much of the overall changes in
RevPAR are explained by national factors and how much by broader factors. Th is association between
business, economic conditions and corporate performance of hotel fi rms is a topic less studied, par-ticularly in the case of European countries.
RevPAR is used by the hotel industry as a key determinant of a hotel performance, being measured as the relation between the revenue from accommodation (revenue from overnight stays spent by guests
129-244 Tourism 2016 02EN.indd 219
220
TOURISM
Original scientifi c paper Luís PachecoVol. 64/ No. 2/ 2016/ 219 - 230
in all tourist accommodation establishments, net of discounts, sales tax and meals) and the number of available rooms, in the reference period. It uses RevPAR given this indicator's ability to synthesize, both, price and occupancy, providing insight into how well a hotel is utilizing its room inventory. It should be noticed, however, that the commonly used average measures of average daily hotel rate
(ADR), RevPAR, and occupancy may be insuffi cient to observe the "typical" hotel performance.
Over-all, lodging data mask huge variability that exists by market and segment. In addition, performance patterns vary substantially within markets and segments (Damonte, Romp, Bahl & Domke, 1997; Enz, Canina & Walsh, 2001).
One reason for comparing the eff ects of local factors on RevPAR with the impact of global factors is that the global drivers should have broader consequences on profi tability for hotel operators who man-age an international portfolio of hotels. Also, given the weight of the non-residents stays on the total overnight stays, the fi nancial situation of hotels surely is heavily dependent of the broader economic situation. On the other hand, by assessing local RevPAR factors, international hotels can reduce coun-try risk by expanding their hotel portfolios across countries not subject to the same type of local risk.
Th erefore, the next section presents an introduction to this issue and a literature review. Th e third
section presents the data, the hypothesis to be tested and the methodology to be used. Th e fourth
section presents the empirical results, with the fi nal section presenting a discussion about the results and some concluding remarks.
Literature review
Hospitality sector professionals are concerned about the specifi c eff ects of economic factors – particu-larly income – on hotel room demand and profi tability. For instance, operators need to understand how sensitive theirs hotel profi tability is to economic factors to maximize the eff ectiveness of their revenue-management strategies. As stated by Sainaghi (2011, p. 298), the theme of hotel performance
has had numerous implications in the hotel sector (Okumus, 2002). Th e majority of these studies use
independent variables related to internal functions, processes and activities (Ingram, 1996; Phillips, 1996; Sigala, 2004; Barros, 2004; Hu & Cai, 2004; Kim & Kim, 2005; Øgaard, Marnburg & Larsen,
2008). Th e indicators used are mainly fi nancial ratios, occupancy, prices, RevPAR, sales growth, and
customer satisfaction.
To measure hotels' corporate performance interactions with macro or business conditions, the majority of previous studies used stock returns (Heiman, 1988; Chen, Kim & Kim, 2005; Chen, 2007b, 2010, 2015; Singal, 2012). Nevertheless, there is the danger that the irrational movements of the market make that stock prices do not refl ect true fi nancial performance. Also, the majority of hotels is not quoted or belongs to worldwide hotel chains, whose stock price does not refl ect the idiosyncrasies of each individual hotel.
Concerning RevPAR, there is an ongoing debate about the appropriateness of that measure (Brown & Dev, 1999; Douglas, 2000; Slattery, 2002). RevPAR focuses attention on results and is, to a large
extent, a product-oriented measure in a customer-oriented industry. Th ere is, arguably, an industry
wide obsession with RevPAR despite recognition by practitioners and academics of its well-established weaknesses. Brown and Dev (1999) question whether hotel productivity measures can eff ectively refl ect hotels changing emphasis from a room-only orientation to a full-service orientation. In addition, they ask whether a customer-orientated approach should take over from the current product-orientated one. Slattery (2002) presents three arguments why RevPAR needs reform. He claims that reporting on
129-244 Tourism 2016 02EN.indd 220
221
TOURISM
Original scientifi c paper Luís PachecoVol. 64/ No. 2/ 2016/ 219 - 230
RevPAR is unreliable, room supply and demand measures are fl awed and the variability or lack of links to cash undermines its eff ectiveness. Slattery (2002) argues that measures such as RevPAC (revenue per available customer), TrevPAR (total revenue per available room) and GOPPAR (gross operating profi t per available room) are increasingly being employed (Younes & Kett, 2004; Banker, Potter & Srinivasan, 2005). However, RevPAR remains the key measure adopted in a range of research studies (Ismail, Dalbor & Mills, 2002; Sainaghi, 2011), and it is also adopted in the present study due to the availability of data.
In spite of the interest of the hospitality industry in models that estimate the impact of various factors on the demand for hotel room nights, there are relatively few papers about that topic. Some earlier examples, employing a macro approach to study the cyclical behavior of the US hospitality industry, are Coopers and Lybrand (1995), Wheaton and Rossoff (1998) or Choi, Olsen, Kwansa and Tse (1999). More recently, Chen et al. (2005), Canina and Carvell (2005), Liu, Moulton and Quan (2013) are
some examples, which are described below. Th e interactions between business conditions and fi
nan-cial performance of tourism fi rms may be linked to some macroeconomic factors. For instance, Chen et al. (2005) illustrate that macroeconomic forces such as monetary policy and unemployment rate signifi cantly impact fi nancial performance of Taiwanese hotels. Chen (2007a) fi nds that Chinese hotel stock returns are signifi cantly associated with growth rates of industrial production, growth rates of imports, changes in discount rate, and changes in yield spread. Canina and Carvell (2005) fi nd that consumer confi dence has an impact on the price elasticity for hotel properties. Also, Knowles and Egan (2001) fi nd that consumer confi dence is a key factor aff ecting the international hotel industry. Chen (2007b) while examining interactions between business conditions and fi nancial performance of tourism fi rms in China and Taiwan fi nds a long-run equilibrium relationship between these two
variables. Th e author also fi nds that gross domestic production plays a more critical role than
indus-trial production in forecasting variance of fi nancial performance of tourism fi rms. Also, Chen (2010, 2011) demonstrates that tourism growth positively infl uences the performance of Taiwanese hotels. In one of the few applications to a European context, Sainaghi (2010) identifi es RevPAR determinants of individual fi rms located in Milan, Italy through a sample of 72 individual fi rms, operating in the 3
to 5 star range, with data collected from fi nancial statements and questionnaires. Th e empirical fi
nd-ings identify four main signifi cant determinants linked to the "what" positioning – number of rooms, number of employees, number of years since the last refurbishment, market orientation – and confi rm the relevance of location ("where"), and specially of centrality within the destination.
More recently, Liu et al. (2013), examined the economic drivers of RevPAR for eight major Asian cities, calculating how much of the overall changes in RevPAR are explained by local factors and how much
by broader factors. Th ey used a dataset of monthly ADRs and occupancy rates to compute monthly
RevPAR. Th en, year-over-year changes in RevPAR are related with year-over-year changes in a set of
independent variables of local and global nature: monthly data on the consumer price index, number of international tourists, trade balance, exchange rate, consumer confi dence indexes, interest rates and stock exchange and real estate development indexes. Additionally, dummy variables are also included in order to account for four major events. Performing a seemingly unrelated regression (SUR), the authors fi nd that global variables are more important than local factors in explaining the variation in Asian hotel RevPARs over time and across cities.
Chen (2015) studies the eff ects of changes in consumer confi dence in Taiwan on hotel stock perfor-mance, including hotel sales growth and hotel stock returns to fi nds that consumer confi dence can signifi cantly benefi t hotel stock returns by stimulating hotel sales growth. Singal (2012) also fi nds for the US hospitality industry a signifi cant infl uence of changes in consumer confi dence on sales growth
129-244 Tourism 2016 02EN.indd 221
222
TOURISM
Original scientifi c paper Luís PachecoVol. 64/ No. 2/ 2016/ 219 - 230
and stock returns. However, apart from Asia and the US, applied research to other regions or countries is very sparse.
Th is paper makes the following contribution to the tourism and hospitality literature: it off ers a
com-parative examination on the diff erent impact of internal and external economic and industry factors on hotel performance, measured by RevPAR, where changes in the economy can be viewed as the economic factor (proxied by the economic sentiment indexes), whereas the expansion of the market for foreign tourism (proxied by the number of foreign stays), can be used as the industry specifi c
fac-tor. Th is is the fi rst analysis of this type made for the Portuguese hotel industry. In 2015, according to
WTTC (2015), the contribution of the travel and tourism sector for the Portuguese GDP is around 16%, so that understanding the main drivers of its performance becomes a crucial question.
Data, hypothesis and methodology
Data
Following closely the methodology of Liu et al. (2013), this research used a dataset provided by the
Portuguese national statistics offi ce (Instituto Nacional de Estatística), comprising monthly data on several
hotel indicators, for the period from February 2011 to May 2015. Th is period comprises the "great
recession", namely the period exactly before the implementation of the Portuguese economic adjustment program, ending in May 2015, a period characterized by a much friendlier economic environment. One challenge of analyzing RevPAR over long periods of time is that RevPAR tends to be cyclical and highly seasonal (e.g., August vs. January). To control for the seasonal variation, monthly year-over-year percentage changes was analyzed to focus on the underlying economic drivers of RevPAR for the
dif-ferent hotels. Th us, the analysis of year-over-year changes in RevPAR as well as year-over-year changes
in the independent variables was conducted. Th e variables were: the number of non-residents and
residents overnight stays (time spent by an individual between midday and midday of the following day) and the consumer confi dence indexes in Portugal, the EU and the US.
Th is section explains the motivation for choosing each variable and the expected eff ect on RevPAR,
guided by a combination of economic theory, previous empirical work and the need for proxies that
are available on a monthly basis. Th e number of non-residents and residents overnight stays should
have a positive impact on RevPAR, as it directly aff ect the demand for hotel rooms and are proxies
for, respectively, internal or external industry determinants. Th ese variables refl ect the fact that the
expansion of tourism is expected to promote the corporate performance of hotel fi rms. Economic growth, in general, should also have a positive impact on RevPAR trough the increase in the demand for hotel rooms. Nevertheless, there are no monthly data on output, so the consumer confi dence index in Portugal as a proxy for internal factors aff ecting the demand for hotel rooms was used. For external factors, the EU and the US consumer confi dence indexes, respectively, as proxies for the European and global economic income were used. In stressing the relevance of the consumer confi dence indexes, it is important to note that in August 2015 the total number of hotel overnight stays in Portugal was 7.2 million, of which 64% were foreign travelers. More than 80% of foreign travelers come from the European Union, and the rest from the United States.
Since economists have proposed that changes in wealth may have an impact on consumer spending, the consumer confi dence index as a proxy for current expectations of future income was used. As expectations of future income levels increase and, likewise, consumer confi dence, it is expected that
the room demand will increase with the increase in RevPAR. Th e coeffi cient for consumer confi dence
129-244 Tourism 2016 02EN.indd 222
223
TOURISM
Original scientifi c paper Luís PachecoVol. 64/ No. 2/ 2016/ 219 - 230
is expected to be positive and signifi cant, because rising consumer confi dence would have the eff ect of increasing consumers' willingness to travel and increase hotel demand and it should be noted that this eff ect is quite diff erent from the income eff ect in that this phenomenon is the result of
consum-ers' expectations about future economic conditions rather than of current conditions. Th e consumer
confi dence indexes refl ect the consumers' future expectations for income, so it is expected that greater confi dence will increase the demand for hotel rooms, thus having a positive impact on RevPAR. Canina and Carvell (2005) found that a 1% increase (or decrease) in the level of the consumer confi dence index will increase (or decrease) the number of rooms demanded by 0.03%.
Figure 1
Consumer confi dence/sentiment indexes - year-on-year changes (February 2011 – May 2015)
Source: INE (Instituto Nacional de Estatística) and University of Michigan.
Th e unemployment rate could be used as a proxy for output, with the hypothesis of an inverse
co-movement between those variables. Nevertheless, as very similar results are usually obtained, a decision was made to use the consumer or economic sentiment indexes. Contrary to Liu et al. (2013), dummy variables were not included since there were no signifi cant national events in the considered period that could have an impact on hotel demand. Also, infl ation was not included in the explanatory variables, given the current situation of near zero infl ation.
A tests of signifi cant diff erences between diff erent hotel segments was also done. Arguably, the lower quality hotel segments might be more sensitive to changes in the economy than other price segments. Nevertheless, an income eff ect suggests that a sluggish economy would reduce overall demand and RevPAR; on the other hand, the trading-down (up) eff ect suggests that consumers may choose hotels in progressively lower price segments as the economy deteriorates. So, the pure income eff ect and the trading-down (up) eff ect are expected to be stronger in the low end segments than in high-end seg-ments. Canina and Carvell (2007) found such diff erences, with upscale price segments more sensitive to the consumer confi dence index albeit less sensitive to the income variables.
Figure 2 presents the RevPAR evolution for Portuguese hotels from February 2011 to May 2015 (in-cluding a trend line) showing that, after a strong decline in 2011, global RevPAR begun its recovery in the second semester of 2012.
-150% -100% -50% 0% 50% 100% Fe b.1 1 Ap r. 11 Ju n .1 1 Au g .1 1 Oct .11 De c. 11 Fe b.1 2 Ap r. 12 Ju n .1 2 Au g .1 2 Oct .12 De c. 12 Fe b.1 3 Ap r. 13 Ju n .1 3 Au g .1 3 Oct .13 De c. 13 Fe b.1 4 Ap r. 14 Ju n .1 4 Au g .1 4 Oct .14 De c. 14 Fe b.1 5 Ap r. 15 US PT EU 129-244 Tourism 2016 02EN.indd 223 129-244 Tourism 2016 02EN.indd 223 21/06/2016 16:54:2521/06/2016 16:54:25
224
TOURISM
Original scientifi c paper Luís PachecoVol. 64/ No. 2/ 2016/ 219 - 230 Figure 2
RevPAR for Portuguese hotels (February 2011 – May 2015)
Source: INE (Instituto Nacional de Estatística).
Figure 3 presents the co-movement of RevPAR for diff erent hotel segments that is, diff erentiating
between fi ve star, four star and other hotels. Th e data show clearly a diverging behavior for the low
segment hotels during the crisis years. Apparently, the more resilient fi ve and four star hotels did not experience negative growth rates for such a long period, while the less than four star hotels accomplished a stronger rebound in recent months.
Figure 3
RevPAR for Portuguese hotels (February 2011 – May 2015)
Source: INE (Instituto Nacional de Estatística).
Hypothesis to be tested
Based on the literature review, fi ve hypotheses were tested:
H1: RevPAR is positively related to the Portuguese consumer confi dence index (PT CI). H2: RevPAR is positively related to the EU consumer confi dence index (EU CI).
-10% -5% 0% 5% 10% 15% Fe b.1 1 Ap r. 11 Ju n .1 1 Au g .1 1 Oct .11 De c. 11 Fe b.1 2 Ap r. 12 Ju n .1 2 Au g .1 2 Oct .12 De c. 12 Fe b.1 3 Ap r. 13 Ju n .1 3 Au g .1 3 Oct .13 De c. 13 Fe b.1 4 Ap r. 14 Ju n .1 4 Au g .1 4 Oct .14 De c. 14 Fe b.1 5 Ap r. 15 -30% -20% -10% 0% 10% 20% 30% 40% Fe b.1 1 Ap r. 11 Ju n .1 1 Au g .1 1 Oct .11 De c. 11 Fe b.1 2 Ap r. 12 Ju n .1 2 Au g .1 2 Oct .12 De c. 12 Fe b.1 3 Ap r. 13 Ju n .1 3 Au g .1 3 Oct .13 De c. 13 Fe b.1 4 Ap r. 14 Ju n .1 4 Au g .1 4 Oct .14 De c. 14 Fe b.1 5 Ap r. 15 RevPAR 5* RevPAR 4* RevPAR others 129-244 Tourism 2016 02EN.indd 224 129-244 Tourism 2016 02EN.indd 224 21/06/2016 16:54:2621/06/2016 16:54:26
225
TOURISM
Original scientifi c paper Luís PachecoVol. 64/ No. 2/ 2016/ 219 - 230
H3: RevPAR is positively related to the US consumer sentiment index (US CS). H4: RevPAR is positively related to the number of overnight stays by residents (RES). H5: RevPAR is positively related to the number of overnight stays by non-residents (NRES).
In testing these hypothesis diff erent hotel segments (5 stars, 4 stars and less than 4 stars) were also taken into account, since possibly there are signifi cant diff erences concerning RevPAR sensitivity to the explanatory variables. Before the estimation descriptive statistics are presented.
Table 1
Correlation matrix between variables
US CS EU CI PT CI RES NRES RevPAR 5 RevPAR 4 RevPAR others
US CS 1 0.10 0.30 0.05 -0.02 0.04 0.14 0.18 EU CI 1 0.65 0.63 0.38 0.15 0.48 0.72 PT CI 1 0.52 -0.09 0.04 0.60 0.63 RES 1 0.51 0.43 0.68 0.80 NRES 1 0.48 0.37 0.41 RevPAR 5 1 0.52 0.47 RevPAR 4 1 0.78 RevPAR others 1
Table 1 presents the correlation coeffi cients between variables. Th ere is a rather strong correlation
between the number of stays and RevPAR, in particular, there is a clear association between stays by residents and non-residents with, respectively, downscale and upscale hotels. Also, the number of stays by residents is correlated with the national and European consumer confi dence indexes whereas the number of stays by non-residents is only strongly correlated with the European index.
Methodology
In order to fulfi ll the research objective Seemingly Unrelated Regression (SUR) analysis was used. SUR is a generalized linear regression model that consists of several regression equations. Each regression equation has its own dependent variable and potentially diff erent sets of explanatory variables. Here, each hotel category has its own regression equation with the dependent variable equal to the year-on
year change in RevPAR for that category. Th e explanatory variables for each hotel category are the
year-on-year change in the US consumer sentiment index, the EU and Portugal consumer confi dence indexes and the number of resident and non-resident guests. Since each equation is a valid linear regression on its own, it can be estimated separately equation-by-equation using standard ordinary least squares (OLS). But since the error terms are assumed to be correlated across the equations, it is more appropriate to estimate the models simultaneously as a system of equations. Essentially, the SUR method amounts to feasible generalized least squares with a specifi c form of the variance-covariance matrix. In summary, SUR is a set of equations that may be related not because they interact, but because their error terms are related. Nevertheless, we will compare the results obtained with SUR to the results obtained by using OLS.
Results
Th e results are displayed in Tables 2 and 3. Table 2 presents a simple OLS regression of RevPAR on
the diff erent explanatory variables.
129-244 Tourism 2016 02EN.indd 225
226
TOURISM
Original scientifi c paper Luís PachecoVol. 64/ No. 2/ 2016/ 219 - 230 Table 2
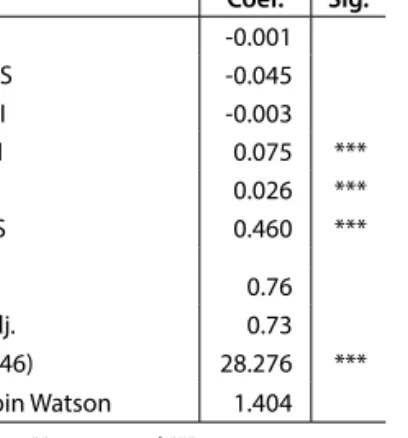
OLS regression - RevPAR
Coef. Sig. C -0.001 US CS -0.045 EU CI -0.003 PT CI 0.075 *** RES 0.026 *** NRES 0.460 *** R2 0.76 R2 adj. 0.73 F (5. 46) 28.276 *** Durbin Watson 1.404 * p<0.10; ** p<0.05 and *** p<0.01
Th e Portuguese consumer confi dence index signifi cantly infl uences RevPAR, having the expected sign,
and overnight stays by residents and non-residents are also signifi cant variables. Consumer confi dence indexes from the US or the EU seem to be non-relevant to explain the changes in RevPAR.
Table 3 presents the detailed results of all regressions including coeffi cient estimates for all explanatory
variables and their p-values from seemingly unrelated regressions (SUR) and ordinary least squares (OLS). Adding lags to the explanatory variables of the regression equation does not change any of our conclusions, but is does risk introducing multicollinearity because the lagged and contemporaneous variables are highly correlated, so they were excluded them from the analysis.
Table 3
Regression models - RevPAR 5*, RevPAR 4* and RevPAR others
RevPAR 5* Coef. Sig. RevPAR 4* Coef. Sig. RevPAR others Coef. Sig.
C 0.001 C -0.014 C -0.028
US CS 0.023 US CS -0.018 US CS 0.072
EU CI -0.033 EU CI -0.037 ** EU CI 0.059 **
PT CI 0.006 PT CI 0.137 *** PT CI 0.067
RES 0.250 ** RES 0.216 ** RES 0.592 ***
NRES 0.438 ** NRES 0.418 *** NRES 0.152
R2 0.31 R2 0.61 R2 0.74
R2 adj. 0.24 R2 adj. 0.57 R2 adj. 0.72
Breusch-Pagan 32.488 ***
* p<0.10; ** p<0.05 and *** p<0.01
Th e bottom of the output provides a Breusch-Pagan test of whether the residuals from the two equations
are independent. In this case, the p-values imply that the null hypothesis of no correlation between residuals is rejected, being the residuals not independent. So, not rejecting the null hypothesis implies that SUR is better than least squares (OLS) estimation.
Th e explanatory power of all the factors combined range from an adjusted R-squared of 24 percent for
5 star hotels to 72 percent for the less than 4 star hotels. Th e US consumer sentiment index is never
signifi cant and the EU and Portugal consumer confi dence indexes do not seem to be rather important drivers of RevPAR for the diff erent categories of Portuguese hotels. Albeit having always the right sign, the Portuguese consumer confi dence index is only signifi cant for the 4 star hotels. In that case,
129-244 Tourism 2016 02EN.indd 226
227
TOURISM
Original scientifi c paper Luís PachecoVol. 64/ No. 2/ 2016/ 219 - 230
the estimate is that a 1% increase in the year-over-year consumer confi dence index results in a 13.7% year-over-year increase in revPAR for 4 star hotels. Also, albeit the changes in overnight stays by resi-dents are always signifi cant, RevPAR of less than 4 star hotels seems to be more sensitive, a result that could be explained by a substitution eff ect, where national tourist chose a downscale segment in times
of economic diffi culties (the "trading-down" eff ect cited by Canina & Carvell, 2005). On the other
hand, non-residents stays explain better the changes on the 5 and 4 star hotels. So, confronting these results with the prior hypotheses, hypotheses 4 and 5 are accepted, since RevPAR across all hotel seg-ments seems to be positively related to the number of overnight stays by residents and non-residents, and reject hypothesis 3, because the US consumer sentiment index is never signifi cant. Regarding hypothesis 1 and 2, according to the results, it is not rejected for the 4 star and for the less than 4 star hotels. It is also interesting to note that downscale price segments are more sensitive to the consumer confi dence indexes.
Th is analysis is completed by determining how much of the explanatory power arises from global factors
(proxied by non-resident stays and foreign confi dence indexes) and how much it is due to local factors (resident stays and Portuguese consumer confi dence index). Figure 4 presents that decomposition. Figure 4
Explanatory power of local and global factors on RevPAR for Portuguese hotels (Percentage of variance explained)
Th e relative weights for global and local variables are computed by comparing the R-square of the
SUR regressions for each hotel segment using local factors only versus the SUR regressions using only global factors. Graph 4 shows that local variables are more important than the global ones, being that diff erence more striking for the 4 star hotels. In aggregate terms, local factors account for 55% of the changes in Portuguese hotels RevPAR.
Discussion and conclusions
As stated by Liu et al. (2013, p. 14), hotels RevPAR arises from a combination of idiosyncratic factors,
domestic (country-specifi c) factors, and global factors. Th e idea explored in this paper, and the fi
nd-ings on which factors matter most and how they aff ect RevPAR, have several practical implications for hotel investors, operators and executives, having to choose how to allocate resources in diff erent hotel categories. 0% 10% 20% 30% 40% 50% 60% 70% 5* 4* Others All Local Global 129-244 Tourism 2016 02EN.indd 227 129-244 Tourism 2016 02EN.indd 227 21/06/2016 16:54:2621/06/2016 16:54:26
228
TOURISM
Original scientifi c paper Luís PachecoVol. 64/ No. 2/ 2016/ 219 - 230
Th e results of this exploratory paper allow us to conclude that local factors are an important driver of
hotels' RevPAR, in particular for the downscale segment. On one hand, the analysis did not found a close association between external levels of consumer confi dence/sentiment and RevPAR, a result that contrasts with Liu et al. (2013) and Chen (2015). One reason for that result could be the fact that those indicators proxy expectations of the future economic situation do not impact on current RevPAR but only in future values since tourists schedule their vacations with some advance. Another reason for the diff erent results obtained could be the intrinsic diff erences between travelers to a mega Asian city such as Hong-Kong and guests to Portuguese hotels. On the other hand, tourism growth promotes hotel performance measured by RevPAR, a result that corroborates previous fi ndings by Chen (2010, 2011) and Liu et al. (2013).
Th e results highlight also the sensitivity of hotel industry to cyclical factors. Since hotel fi rms tend to
have higher fi xed costs, they are very sensitive to business conditions because in times of economic downturns hotel fi rms cannot reduce costs as output falls. Hence, hotel profi ts will be very volatile, a situation that requires maintaining high levels of revenue to survive in times of lower sales. Neverthe-less, a large proportion of the hotel performance, measured by RevPAR, is still unexplained by the model, being aff ected by other factors, such as external factors (e.g., competition by other markets, international marketing campaigns, exchange rates, etc.) or internal factors (public policies, cost con-trols and productivity, etc.). Whether those or other factors can explain the Portuguese hotels RevPAR deserves further attention.
In terms of limitations, this study is limited by data availability on a monthly basis. Also, possibly, there are biases in the collection of RevPAR data, since that information is provided to the national
statistics offi ce by a sample of hotels. Maybe other indicators of hotel performance could yield diff erent
results, what could be a direction for future research. Finally, a caution should be exercised when using industry averages for forecasting and making decisions. In the Portuguese case, national averages are surely biased on some key markets or regions, for instance the Algarve and Lisbon regions, distorting lodging-demand averages. As stated by Enz et al. (2001), reliance on the average can lead managers to overstate RevPAR and understate occupancy objectives.
In summary, the results show that the hotel sector performance is closely related to the state of the economy and especially to tourism growth. Albeit in recent years Portugal has enjoyed a strong surge in the number of tourists, in part motivated by external factors (e.g., instability in northern Africa or the economic growth experienced by some emergent economies), the results demonstrate the high vulnerability of the sector to those volatile variables outside the infl uence of tourism industry, high-lighting the danger of some reversion in the medium term.
References
Banker, R. Potter, G. & Srinivasan, D. (2005). Association of non-fi nancial performance measures with the fi nancial performance of a lodging chain. Cornell Hotel and Restaurant Administration Quarterly, 46(4), 394-412 Barros, C. P. (2004). A stochastic cost frontier in the Portuguese hotel industry. Tourism Economics, 10(2), 177-92. Brown, J. & Dev, C. (1999). Looking beyond RevPAR. Cornell Hotel and Restaurant Administration Quarterly, 40(2), 23-33. Canina, L. & Carvell, S. (2005). Lodging demand for urban hotels in major metropolitan markets. Journal of Hospitality
and Tourism Research, 29(3), 291-311.
Chen, M. H. (2007a). Macro and non-macro explanatory factors of Chinese hotel stock returns. International Journal
of Hospitality Management, 26(4), 991-1004.
129-244 Tourism 2016 02EN.indd 228
229
TOURISM
Original scientifi c paper Luís PachecoVol. 64/ No. 2/ 2016/ 219 - 230
Chen, M. H. (2007b). Interactions between business conditions and financial performance of tourism firms: Evidence from China and Taiwan. Tourism Management, 28(1), 188-203.
Chen, M. H. (2010). The economy, tourism growth and corporate performance in the Taiwanese hotel industry.
Tour-ism Management, 31(5), 665-675.
Chen, M. H. (2011). The response of hotel performance to international tourism development and crisis events.
International Journal of Hospitality Management, 30(1), 200-212.
Chen, M. H. (2015). Understanding the impact of changes in consumer confi dence on hotel stock performance in Taiwan. International Journal of Hospitality Management, 50, 55-65.
Chen, M. H., Kim, W. G. & Kim, H. J. (2005). The impacts of macroeconomic and non-economic forces on hotel stock returns. International Journal of Hospitality Management, 24, 243-258.
Choi, J. G., Olsen, M. D., Kwansa, F. A. & Tse, E. C. Y. (1999). Forecasting industry turning points: The US hotel industry cycle model. International Journal of Hospitality Management, 18(2), 159-70.
Coopers & Lybrand (1995). Econometric forecasting: Understanding the U.S. lodging industry. Report presented for the 17th Annual Hospitality Industry Investment Conference, New York, NY.
Damonte, L. T, Romp, P. D., Bahl, R. & Domke, D. (1997). Brand affi liation and property size eff ects on measures of performance in lodging properties. Hospitality Research Journal, 20(3), 1-16.
Douglas, P. C. (2000). Measuring productivity and performance in the hospitality industry. The National Public
Ac-countant, 45(5), 15.
Enz, C., Canina, L. & Walsh, K. (2001). Hotel-industry Averages: an inaccurate tool for measuring performance. Cornell
Hotel and Restaurant Administration Quarterly, 42(6), 22-32.
Gursoy, D. & Swanger, J. (2007). Performance-enhancing internal strategic factors and competencies: impacts on financial success. International Journal of Hospitality Management, 26(1), 213-227.
Hawawini, G., Subramanian, V. & Verdin, P. (2003). Is Performance Driven by Industry or Firm-Specifi c Factors? A New Look at the Evidence. Strategic Management Journal, 24(1), 1-16.
Ham, S., Kim, W. G. & Jeong, S. (2005). Eff ect of information technology on performance in upscale hotels. International
Journal of Hospitality Management, 24(2), 281-294.
Heiman, R. (1988). Eff ects of key issues on the fi nancial performance of hospitality fi rms. Hospitality Education and
Research Journal, 12(2), 83-90.
Hu, B. A. & Cai, A. C. (2004). Hotel labor productivity assessment: a data envelopment analysis. Journal of Travel and
Tourism Marketing, 16(2-3), 27-38.
Ingram, P. (1996). Organizational form as a solution to the problem of credible commitment: the evolution of naming strategies among US hotel chains, 1896-1980. Strategic Management Journal, 17(1), 85-98.
Ismail, J.; Dalbor, M. & Mills, J. (2002). Using RevPAR to analyze lodging segment variability. Cornell Hotel and Restaurant
Administration Quarterly, 43(6), 73-80.
Kim, H. B. & Kim, W. G. (2005). The relationship between brand equity and firms' performance in luxury hotels and chain restaurants. Tourism Management, 26(4), 549-560.
Knowles, T. & Egan, D. (2001). Recession and its implications for the international hotel industry. Travel & Tourism
Analyst, 6, 59-76.
Liu, C., Moulton, P. & Quan, D. (2013). Common global and local drivers of RevPAR in Asian cities. Cornell Hospitality
Report, May.
Madan, K. (2007). An analysis of the debt-equity structure of leading hotel chains in India. International Journal of
Hospitality Management, 19(5), 397-414.
Øgaard, T., Marnburg, E. & Larsen, S. (2008). Perceptions of organizational structure in the hospitality industry: con-sequences for commitment, job satisfaction and perceived performance. Tourism Management, 29(4), 661-671. Okumus, F. (2002). Can hospitality researchers contribute to the strategic management literature? International
Journal of Hospitality Management, 21(2), 105-110.
129-244 Tourism 2016 02EN.indd 229
230
TOURISM
Original scientifi c paper Luís PachecoVol. 64/ No. 2/ 2016/ 219 - 230
Opler, T. C. & Titman, S. (1994). Financial Distress and Corporate Performance. Journal of Finance, 49(3), 1015-1040. Phillips, P. A. (1996). Strategic planning and business performance in the quoted UK hotel sector: results of an
ex-ploratory study. International Journal of Hospitality Management, 15(4), 347-362.
Reichel, A. & Haber, S. (2005). A three-sector comparison of the business performance of small tourism enterprises: an exploratory study. Tourism Management, 26(5), 681-690.
Rumelt, R. P. (1991). How much does industry matter? Strategic Management Journal, 12(3), 167-185.
Sainaghi, R. (2011). RevPAR determinants of individual hotels: Evidences from Milan. International Journal of
Contem-porary Hospitality Management, 23(3), 297-311.
Schmalensee, R. (1985). Do markets diff er much? American Economic Review, 75(3), 341-351.
Sigala, M. (2004). Using data envelopment analysis for measuring and benchmarking productivity in the hotel sector.
Journal of Travel and Tourism Marketing, 16(2-3), 39-60.
Singal, M. (2012). Eff ect of consumer sentiment on hospitality expenditures and stock returns. International Journal
of Hospitality Management, 31(2), 511-521.
Slattery, P. (2002). Reported RevPAR: unreliable measure, fl aws, interpretations and the remedy. International Journal
of Contemporary Hospitality Management, 21(4), 135-149.
Wheaton, W. C. & Rossoff , L. (1998). The cyclic behavior of the US lodging industry. Real Estate Economics, 26(1), 67-82. WTTC (2015). Travel & Tourism Economic Impact 2015 – Portugal. World Travel and Tourism Council, London. Younes, E. & Kett, R. (2004). Investment driven breakeven analysis for hotels. The Hospitality Review, 6(1), 10-16. Submitted: 30/10/2015
Accepted: 13/05/2016
129-244 Tourism 2016 02EN.indd 230