659
GIS BASED ANALYSIS OF POTENTIAL FOREST RESIDUES FOR ENERGY IN
ALENTEJO, PORTUGAL
Paulo Mesquita1, Ricardo Nepomuceno Pereira1, Isabel Malico1,2, Ana Cristina Gonçalves3, Adélia O. M. Sousa3 Universidade de Évora, Escola de Ciências e Tecnologia1
R. Romão Ramalho, 59, 7000–671 Évora, Portugal
Instituto Superior Técnico, Universidade de Lisboa, LAETA, IDMEC2 Av. Rovisco Pais, 1, 1049–001 Lisboa, Portugal
Universidade de Évora, Instituto de Ciências Agrárias e Ambientais Mediterrânicas (ICAAM)3 Apartado 94, 7002–554 Évora.
Phone: (+351) 266 760 823 E-Mail: [email protected]
SUMMARY
The present work evaluates the quantity and spatial distribution of potential forest residues in Alentejo, the largest geographic region in Portugal. Forest residues from the five main species in Portugal, tasmanian blue gum, cork oak, maritime pine, holm oak and stone pine, were assessed. The characterization of the biomass residues was performed in a Geographical Information System environment using the Portuguese land cover map and residues production rates from the available literature sources. The calculations were executed for every cell of a 250 m cell size grid. The total potential residues obtained was around 330,000 dry ton/year, with 172,000 dry ton/year being from cork oak. The residues spatial distribution occurs mainly in the western and north-western parts of Alentejo. This area was also the only one to achieve values of residual biomass above 80,000 dry ton/year for a 35 km radius collection area.
Keywords: GIS, solid biomass, forest residues, energy.
INTRODUCTION Solid biomass energy
Global energy dependency has been satisfied through the use of fossil energy sources such as coal, oil and natural gas. The choice for the use of a particular energy source is still mainly driven by its price, although the climate framework is becoming a critical factor. Among the priority actions to carry out the energy transition driven by the increasing need for decarbonization, energy leaders reported that the use of renewable energy sources is the measure with the highest impact on decision-making (World Energy Council, 2017). Since the beginning of the millennium, policies have been established to support renewable energy sources, but they have been mainly directed towards power generation (REN21, 2017). Integration of renewables into the remaining sectors needs to be done under a broader concept of renewable-based energy system, which brings together the relevant aspects when planning energy systems and infrastructures, financing schemes and policy development (REN21, 2017). World renewable energy share on global final energy consumption was estimated in 2015 to be 19.3%. 73.1% of this contribution came from biomass (66.3% was consumed in the heating sector, 2.1% in the power sector and 4.7% in the transport sector (REN21, 2017). The global primary energy supply of biomass was almost entirely from solid biomass resources such as fuelwood, charcoal, forest, agriculture and industry residues, municipal solid wastes and pellets, which together contributed with 92% of the total biomass supply; the remaining came from biogas (2%), biodiesel (2%) and bioethanol (4%) (World Energy Council, 2017). In EU28, renewable energy share on total gross inland consumption (TGIC) of energy was 13% in 2016, of which 65% came from biomass (Eurostat, 2018).
660 According to AEBIOM (2017), in Europe in 2015, 74% of biomass was consumed for heating, 14% for power generation and 12% for transport. The contribution of solid biomass (including charcoal and renewable municipal wastes) to TGIC of biomass energy was 77% (Eurostat, 2018).
In Portugal, renewables play a very important role since they represented, in 2016, 97% of the total primary energy production (TPEP), 5823 ktoe, and the remaining came from non-renewable wastes (Eurostat, 2018). Portugal does not have primary production of fossil fuels and nuclear energy is not exploited. The biomass role in Portugal is significantly relevant, with a 51% share on TPEP from renewables. Solid biomass primary production was 2.7 Mtoe in 2016, representing 87% of the biomass production. The solid biomass fuels mostly produced in the country were fuelwood, wood residues, agriculture and forestry residues, briquettes and pellets (53% of the TPEP). Black liquor was also relevant (39% of the TPEP) and renewable municipal solid wastes accounted for 4% of the TPEP from solid biomass (Eurostat, 2018; DGEG, 2018).
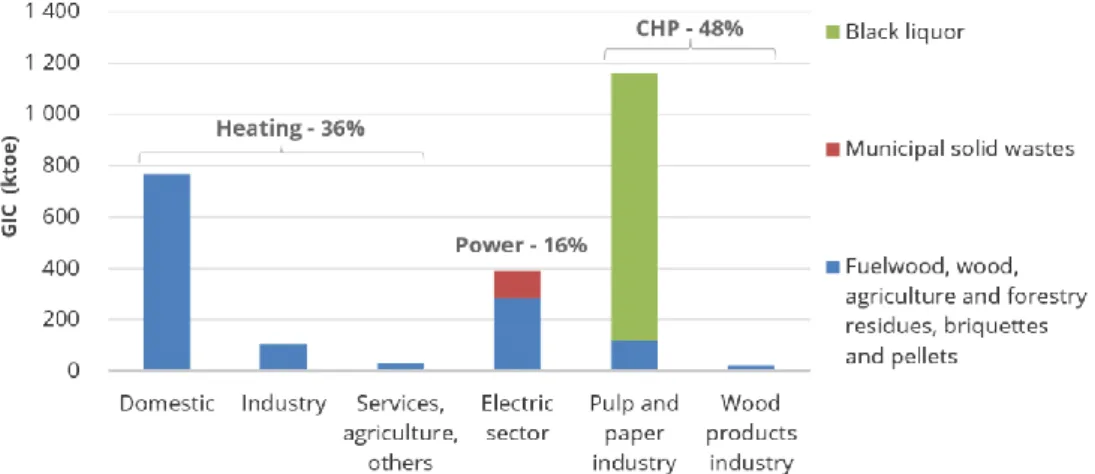
The TGIC of solid biomass in Portugal was 2.5 Mtoe in 2016, representing about 15% of the Portuguese TGIC of energy (transport sector not included) (DGEG, 2018). Figure 1 presents the TGIC of solid biomass in Portugal per type of end-use, sector and source. It can be seen that almost half of the consumption occurs in combined heat and power (CHP) generation systems used in the pulp and paper and wood products industries. It should be noted that the black liquor share on solid biomass consumption was 42% and as a waste from pulp and paper manufacture it is produced and consumed inside the own industry. In stand-alone systems, solid biomass is mainly consumed in the domestic sector for heating purposes and in the electric sector.
Figure 1: Portuguese gross inland consumption of solid biomass per sector/end-user in 2016. (DGEG, 2018).
Portuguese forest
According to the preliminary results of the 6th Portuguese National Forest Inventory (ICNF, 2013), 35% of the land use in Portugal in 2010 was forest, with 3,154,800 ha. The same report presents a net loss of forest area of 5% since 1995. Despite the reduction of forest area and due to the several disturbances, it is highlighted that this value represents a strong resilience of the Portuguese forest. Forest fires that consumed around 2,500,000 ha (between 1990 and 2012), and pine wilt disease that impacted severely maritime pine forest. This assessment allows to define the Portuguese forest as a relatively stable resource in the last two decades.
Tasmanian blue gum (Eucalyptus globulus) is the main forest species in area with 811,943 ha, followed by cork oak (Quercus suber) with 736,775 ha, maritime pine (Pinus pinaster) with 714,445 ha, holm oak (Quercus rotundifolia) with 331,179 ha, and stone pine (Pinus pinea) with 175,742 ha (ICNF, 2013). These five species constitute around 90% of the total Portuguese forest area.
661 Some studies have been conducted worldwide with the objective of quantifying, for a given geographic unit, the potential of biomass residues and their possible allocation to energy production. For example, Vasco and Costa (2009) used thematic cartography and forest growth data to quantify the forest biomass residues in a province of Mozambique (Maputo); López-Rodríguez et al. (2009) quantified and mapped the bioenergy potential of the most representative species in a region of Spain (Cáceres); Gómez et al. (2010) assessed the energy potential of agricultural and forest residues in Spain.
In Portugal, Viana et al. (2010) quantified at a national scale, with discriminated data for smaller geographic units, the forest residues of maritime pine and tasmanian blue gum; Fernandes and Costa (2010) and Lourinho and Brito (2014) quantified the agricultural and forest residues for smaller administrative regions.
Although these studies have different degrees of complexity and follow different approaches regarding the biomass residues that are considered, and the scale and detail of the geographical region of interest, all of them use Geographical Information Systems (GIS) based methodologies to quantify biomass residues potential to energy. Voivontas et al. (2001) state that GIS provide the means to identify and quantify the parameters related with the available and technological biomass potential. Lourinho and Brito (2014) point that the possibility of data manipulation and analysis with a spatial component allowed in GIS environments can be considered one of the principal characteristics of such systems.
Current study
This study focused on the primary residues, residues derived from forest management activities, of the five most common forest species in Portugal.
The study area, the Alentejo region, is the largest province in Portugal and although there are assessments of biomass residues of particular forest species for the entire region (Viana et al., 2010), or for smaller regions (Fernandes and Costa, 2010; Lourinho and Brito, 2014), no studies exist with high spatial detail regarding forest biomass residues for energy of all main forest species for the entire region.
The methodology to determine the potential production of forest residues was based on the studies of Lourinho and Brito (2014) and Fernandes and Costa (2010), where land cover information was used in conjunction with residues production rates for different forest species to evaluate the annual residues production for a part of Alto Alentejo region in Portugal.
The available biomass as a resource for energy is usually calculated for a collection area, around the geographical location of the biomass consumption facility. The collection area is related with biomass-associated costs (Viana et al., 2010). This author determined in the same study a radius of 35 km for a 9 MW power plant that would use maritime pine and tasmanian blue gum. In this study the same radius was used to assess the potential biomass available across the study area.
The objectives of this study are 1) to assess, for a square grid with 250 m cell size, the potential of the forest residues for the five main forest species (holm oak, cork oak, tasmanian blue gum, maritime pine, stone pine) in Alentejo; and 2) to map the availability of these residues at a radius of 35 km for each one of the grid cells.
STUDY AREA
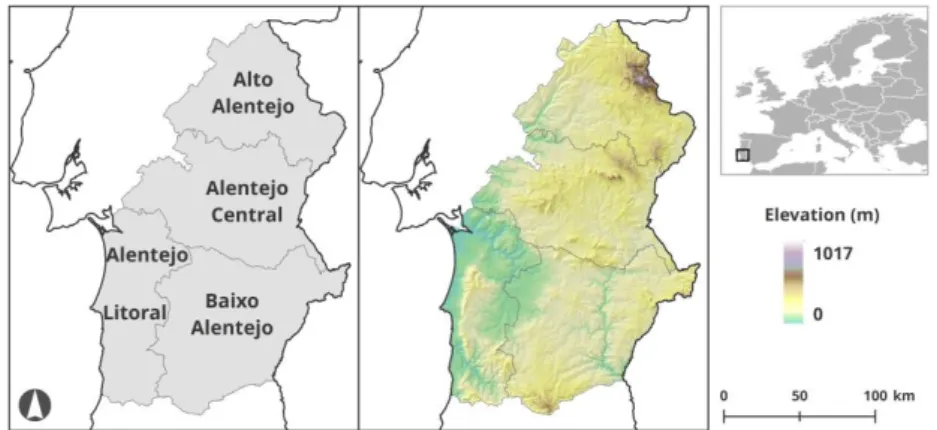
Alentejo is the largest province in Portugal with 27,000 km2, which represent around 30% of the country continental area, and has a forest area superior to 11,000 km2 (DNGF, 2010). It is divided in four NUTSIII regions: Alto Alentejo, Alentejo Central, Alentejo Litoral, and Baixo Alentejo. Figure 2 presents the location of Alentejo, its sub-regions and terrain. The maximum elevation in the region is around 1000 m, in the north-eastern part of Alto Alentejo, this region and Alentejo central have the
662 highest elevations and the most irregular terrain. Alentejo Litoral and Baixo Alentejo have the lowest elevations and more regular and plain terrain. The climate is Mediterranean, with hot and dry summers in the majority of the region.
Figure 2: Study area location, sub-regions and terrain.
METHODS
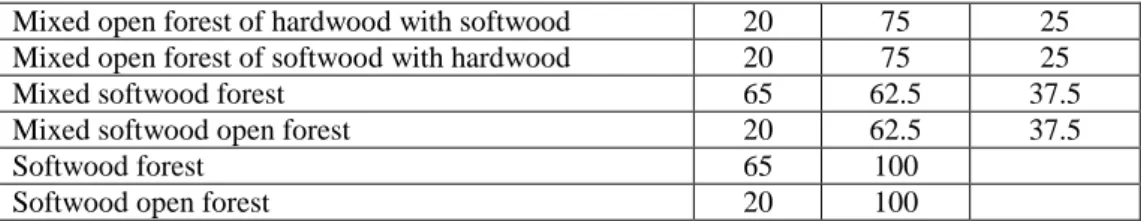
The biomass residues potential was estimated in a GIS environment using spatial analysis techniques. The land cover map of Portugal from 2010 (COS2010V1.0), (Direção-Geral do Território, 2016) was used as the source of the geographic information about the forest species in evaluation. This information has an hierarchical nomenclature with five levels with 255 classes in the last level, the minimal cartographic unit is 1 ha, the thematic accuracy is better than 85% and the geometric accuracy is better than 5.5 m (Sarmento et al., 2016). As identified by Lourinho and Brito (2014), the polygon areas obtained from the land cover map do not translate directly to the effective area occupied by each forest species. This occurs because land cover classes can contain multiple species with variant degrees of vegetation cover within and between classes. The effective cover area for each species was determined as a function of the forest types and species vegetation cover. With this purpose, 56 land cover classes related with the forest species of interest were identified and reclassified into 17 forest types that aggregate information about the species type (hardwood for both the oak species and tasmanian blue gum, and softwood for both pine species), composition (e.g., pure, mixed), and structure (e.g., open forest). Table 1 presents the considered forest types and the respective values used in the calculations. The horizontal projection of the vegetation (HPV) represents the percentage of vegetation cover in a polygon of a given forest type, the percentage of the first species represents the percentage of the vegetation cover attributed to the first species, and the percentage of the second species represents the vegetation cover attributed to the second species (Lourinho and Brito, 2014).
Table 1: Forest types and respective parameters. (Lourinho and Brito, 2014).
Forest type HPV % First
Species
% Second Species Agroforest system with pastures 55 25 25 Agroforest system with permanent crops 55 25 25 Agroforest system with temporary irrigated crops 55 25 25 Agroforest system with temporary non-irrigated crops 55 25 25 Clear cuts and new plantations 5 100
Hardwood forest 65 100
Hardwood open forest 20 100
Mixed forest of hardwood and softwood 65 75 25 Mixed forest of softwood and hardwood 65 75 25
Mixed hardwood forest 65 62.5 37.5
663 Mixed open forest of hardwood with softwood 20 75 25
Mixed open forest of softwood with hardwood 20 75 25
Mixed softwood forest 65 62.5 37.5
Mixed softwood open forest 20 62.5 37.5
Softwood forest 65 100
Softwood open forest 20 100
These values are multiplied by the area of each forest type for each cell to obtain the effective cover area. A conservative approach was used, using minimal values for the percentages of vegetation cover of agroforestry systems that can be very heterogenous regarding composition and vegetation cover. The potential quantity of residues was determined with the residues productivity rates presented in Table 2. These values were multiplied by the effective vegetation cover areas for each species present in a given cell. The land cover map contains information about the main forest species present in a given class, but sometimes the secondary species is not discriminated. A conservative approach was also used when calculating the biomass residues production of secondary species, unknown secondary species were not considered.
The biomass availability was calculated for a collection area of 35 km. For each cell the sum of all residues at that radius was determined.
Table 2: Management conditions and residues productivity for each forest specie. (Lourinho and Brito, 2014).
Forest species Residue productivity
Holm oak Pruning of a tree every 20 years and thinning of 0.20 trees/ha every year with a biomass yield of 5 dry t/ha and 0.22 dry t/ha/year; total biomass yield of 0.48 dry t/ha/year
Cork oak
Moderate pruning of 70 trees/ha every 9 years and thinning of a tree/ha every year with a respective biomass yield of 2.50 dry t/ha and 0.75 dry t/ha/year; total biomass yield of 1.0 dry t/ha/year
Tasmanian blue gum
Selection of logs after the first revolution with biomass yield of 14 dry t/ha; total biomass yield of 0.88 dry t/ha/year
Maritime pine
Pruning and thinning at 10 and 15 years of age with biomass yield of 12 dry t/ha and 5.2 dry t/ha; trimming at next term with biomass yield of 20 dry t/ha; total biomass yield of 1.0 dry t/ha/year
Stone pine Biomass yield of 0.85 dry t/ha/year
RESULTS AND DISCUSSION
Figure 3 presents the potential biomass residues spatial distribution. Cork oak had the largest amount of potential residues with around 172,000 dry ton/year distributed mainly in Alentejo Litoral and in the north-western limits of Alentejo Central and Alto Alentejo. Holm oak and tasmanian blue gum had similar total values of potential residues, around 54,000 dry ton/year each, however the residual biomass potential distribution between the two species is very different. Holm oak biomass is extensively distributed in the region (except in Alentejo Litoral) and tasmanian blue gum is concentrated in fewer locations but with higher residues potential. Stone pine and maritime pine had the lowest residues values, respectively around 28,000 dry ton/year and 21,000 dry ton/year. Both these species potential biomass is mainly located in the northern part of Alentejo Litoral, with maritime pine being in the western part near the ocean and stone pine in the interior.
The combined amount of forest residues obtained in Alentejo was 330,000 dry ton/year, with only around 6,000 dry ton/year from holm oak as secondary species. This very low value can be attributed to the very conservative approach used in the calculations of secondary species residues. The totals per sub-region are: Alentejo Litoral 123,000 dry ton/year; Alto Alentejo 78,000 dry ton/year; Alentejo Central 75,000 dry ton/year; Baixo Alentejo 53,000 dry ton/year. The map with the potential biomass for all species shows that the distribution of the residues occurs mainly in the west and northwest areas of Alentejo.
664 The obtained results are concordant with the results of other studies for smaller areas within Alentejo or for fewer species. Viana et al. (2010) estimated, with a different methodology, the residues for maritime pine and tasmanian blue gum in Alentejo between a minimum of 25,795 dry ton/year, a maximum of 85,551 dry ton/year, and mean value of 55,658 dry ton /year. Our results for both those species was around 75,000 dry ton/year, therefore within the expected interval. The values for each of the four geographic divisions were also very similar to the results obtained by Viana et al. (2010). Lourinho and Brito (2014) estimated around 33,500 dry ton/year of residues for the five species in analysis, in their study for some municipalities of Alto Alentejo. Our results in the same municipalities were 33,000 dry ton/year. Fernandes and Costa (2010) for Marvão municipality, obtained around 2,200 dry ton/year of forest residues, our study obtained for the same region 2,030 dry ton/year.
Figure 3: Potential forest biomass residues distribution.
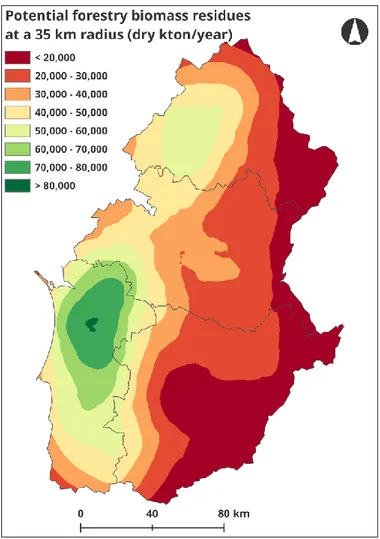
Figure 4 shows the result of the cumulative biomass residues assuming a collection area of 35 km around each cell. The region with more biomass available is located in northern Alentejo Litoral. This is the only zone that reaches cumulative values of biomass above 80,000 dry ton/year for a collection area of 35 km. This value is near the amount of forest biomass needed to feed a 8 MW dedicated biomass power plant (lower heating value of 15 GJ/ton (Fernandes and Costa, 2010), electrical
665 conversion efficiency of 18% (IEA, 2012) and 7200 h/year of operation). The higher residues potential in Alto Alentejo is related to the presence of multiple species: cork oak, maritime pine and stone pine. These species have a big presence in the region with high values of potential residues production, and although the pine species had the lowest residues potential for the entire study area when compared with the other species the large majority of those residues potential is concentrated in zones of the northern part of Alto Alentejo. On the other extreme is the eastern part of Alentejo, mainly Baixo Alentejo and Alentejo Central, with cumulative values below 40,000 dry ton/year. This is expected because these are areas of intensive agriculture production.
The use of 35 km supply radius can create false cut off effects in the final map, imposed by the limit of the study area. Whereas the western border of the study area represents a true physical limitation due to the presence of the ocean, and the eastern border represents an international border. The northern and southern borders of the region may impose false limitations on the biomass availability, which is probably the case in the western part of Alto Alentejo. In this region the biomass is concentrated on a stripe of around 20 km from the region border. This means that many cells will have a reduced supply when using a 35 km radius. It’s very likely that this area would have more cumulative residues potential, for the same radius, if the study area were extended at that location.
Figure 4: Potential forest residues available for a 35 km radius collection area.
666 REFERENCES
AEBIOM, 2017, Statistical report 2017 Key Findings.
DGEG, 2018, http://www.dgeg.gov.pt/, Last accessed in 28 June of 2018.
Direção-Geral do Território, 2016, Especificações técnicas da Carta de uso e ocupação do solo de Portugal Continental para 1995, 2007 e 2010.
DNGF, 2010, Aplicação para consulta dos resultados do 5º Inventário Florestal Nacional. Eurostat, 2018, http://ec.europa.eu/eurostat, last accessed in 28 June of 2018.
Fernandes, U., Costa, M., 2010, Potential of biomass residues for energy production and utilization in a region of Portugal. Biomass and Bioenergy 34, 661–666.
Gómez, A., Rodrigues, M., Montañés, C., Dopazo, C., Fueyo, N., 2010, The potential for electricity generation from crop and forestry residues in Spain. Biomass and Bioenergy 34, 703–719.
ICNF, 2013, Inventário Florestal Nacional 6 – Áreas dos usos do solo e das espécies florestais de Portugal continental em 1995, 2005 e 2010. Lisboa.
IEA, 2012, Technology Roadmap. Bioenergy for Heat and Power. Paris: IEA Publications, p. 62. López-Rodríguez, F., Atanet, C.P., Blázquez, F.C., Celma, A.R., 2009, Spatial assessment of the bioenergy potential of forest residues in the western province of Spain, Caceres. Biomass and Bioenergy 33, 1358–1366.
Lourinho, G., Brito, P., 2014, Assessment of biomass energy potential in a region of Portugal (Alto Alentejo). Energy 81, 189–201.
REN21, 2017, Renewables 2017 Global status report. REN21 Secretariat, Paris.
Sarmento, P., Monteiro, G., Marcelino, F., Igreja, C., Caetano, M., 2016, Avaliação da exatidão temática das cartas de uso e ocupação do solo para Portugal Continental COS1995v1.0, COS2007v2.0 e COS2010v1.0.
Vasco, H., Costa, M., 2009, Quantification and use of forest biomass residues in Maputo province, Mozambique. Biomass and Bioenergy 33, 1221–1228.
Viana, H., Cohen, W.B., Lopes, D., Aranha, J., 2010, Assessment of forest biomass for use as energy. GIS-based analysis of geographical availability and locations of wood-fired power plants in Portugal. Appl. Energy 87, 2551–2560.
Voivontas, D., Assimacopoulos, D., Koukios, E.G., 2001, Aessessment of biomass potential for power production: a GIS based method. Biomass and Bioenergy 20, 101–112.
World Energy Council, 2017, World energy issues monitor 2017.
CONCLUSION
The main conclusion of this study is that most of the theoretical potential of forest residues are located in Alentejo Litoral and in the western part of Alto Alentejo. Alentejo Litoral represents around 37% of the total residues obtained. The central part of northern Alto Alentejo has the largest cumulative values for a 35 km radius collection area, around 80,000 dry ton/year. The species with the largest sum of residues potential is cork oak with 172,000 dry ton/year, representing more than 50% of the total potential residues in the region.
The used GIS based method can be a relevant mechanism to assess the spatial distribution of potential forest residues with high spatial detail for large geographic areas. It allowed to draw preliminary conclusions on potential residues spatial distribution. This information can be helpful to develop more comprehensive and efficient analysis by identifying regions and species of interest that could be targeted with more detailed models. Sensitivity analysis can also be made varying residues rates and vegetation cover (globally, regionally or locally) allowing to better understand the resilience of these types of models to different possibilities of realities.