Abstract—This paper presents the development of a computational intelligence method based on Regularized Logistic Regression to classify 17 distinct upper-limb movements through surface electromyography (sEMG) signal processing. The choose of the tuning parameters of the regularization and the generation of the different classification methods are presented. For the different models were used variations involving 12 sEMG channels and the Root Mean Square (RMS), Variance and Medium Frequency features with which we proposed to achieve a most proper combination of parameters to perform the movements classification. The tests involved 50 subjects, including 10 amputees, using the NinaPro database and also a database currently on development by the authors. The global mean accuracy rate considering all the subjects and the channel and features variations was 70,2% prior the definition of the best case scenario. Once defined the most proper features combination, the accuracy rate reached 87,1%, raising the rates of all movements accuracies performed for all databases.
Index Terms— sEMG, upper-limb, logistic regression, feature selection, channel variation, accuracy rate
I. INTRODUCTION
HE electromyography (EMG) consists on capture the electrical activity present in human muscle during a body movement. Although the EMG signal acquisition can be performed through invasive or non-invasive electrodes and despite the signal to noise ratio of non-invasive electrodes be considerably higher [1], its use its way more frequent than invasive electrodes, once non-invasive electrodes do not cause pain to patients and do not required a specific training for their
placement. For the invasive EMG, electrode needles are frequently used for direct recording of electrical signals from nerves and muscle fibers [2].
The technique of acquire EMG signals through surface electrodes is called surface electromyography (sEMG). The early days of use of the myoelectric signals as control mechanism date from the 40’s [2], ever since, there are researches focused on establish an assistive technology capable to help people with disabilities [3 - 8]. A constant focus has been to enhance the pattern recognition methods necessary to properly identify the user movements [2, 9]. The developments in the area are very often focused on Machine Learning (ML) techniques, which perform the classification of intended movement based on sEMG signal acquired.
Among the most popular ML techniques used to perform the signal classification are methods such as Linear Discriminant Analysis (LDA) [10, 11], Artificial Neural Networks (ANN) [12, 13], Fuzzy Logic, Neuro Fuzzy [14, 15], Genetic Algorithms, Support Vector Machines (SVM) [10, 17] and Logistic Regression [18]. More recently, methods as Independent Component Analysis (ICA) are been used to identify different muscle contribution to the formation of sEMG signal [19]. Also, Principal Component Analysis (PCA) has been used in conjunction with other ML techniques as k-Nearest Neighbors (k-NN) and ANN [20] and SVM and LDA [21]. These approaches intend to reduce the data dimensionality and provide more efficient computation to enhance the technique and make the embedded use more feasible.
Computationally, the efficiency of the technique (more accuracy with less data), can be improved using two main strategies: I) Tuning the ML method as good as possible giving special attention to regularization parameters to prevent overfitting and underfitting of the model; II) To reduce the input data used on the classifier, choosing among the inputs that best describe the system, as presented in [22].
This paper presents a practical calibration of a Regularized Logistic Regression (RLR) algorithm that classifies 17 distinct upper-limb movements using three different features extracted
Optimization of Features to Classify
Upper-Limb Movements Through sEMG Signal
Processing
Vinícius Horn Cene, and Alexandre Balbinot
________________________________________________________________________________
T
______________________________________________________________ Research supported by CAPES (Coordenação de Aperfeiçoamento de Pessoal de Nível Superior) and CNPq (Conselho Nacional de Desenvolvimento Científico e Tecnológico).
Cene. V. H. is with the Federal University of Rio Grande do Sul (UFRGS) at Electrical-Electronic Instrumentation Laboratory (IEE), Porto Alegre, RS Brazil (+55) 51-3308-4440; e-mail: vinicius.cene@gmail.com).
Balbinot. A. is Titular Professor of the Federal University of Rio Grande do Sul (UFRGS), coordinator of Electrical-Electronic Instrumentation Laboratory (IEE), Porto Alegre, RS Brazil (+55) 51-3308-4440; e-mail: abalbinot@gmail.com)
from 12 sEMG channels (Figure 1) and a walkthrough the choice of best input parameters of the tuned RLR method. Once the method is tuned, an evaluation of the impact of certain channel variations combined with the selected features is performed. In this paper, we intend to present practical solutions for the RLR model tuning and to explore the impact of some variations of channels and features on the accuracy of the ML method. After identify the most proper configuration for the signal classification, we perform a comparison of improvement, highlighting the method possibilities.
Fig. 1. Placement of the 12 sEMG channels used to acquire the EMG signal (adapted from [24]).
II. MATERIALS AND METHODS
A. Subjects
In this work three different databases were utilized. The first one (DB1) is composed by the first 30 healthy subjects (subject 1 to 30) of NinaPro database, presented in [10]. The second one (DB2) is composed by 10 amputee subjects (subject 2 to 11), also from NinaPro database. The third database (DB3) is in current development in Laboratory of Electro-Electronic Instrumentation (IEE), of Graduate program of Electrical Engineering. The IEE database portion used in this work contain 10 non-amputee subjects. All procedures performed in these studies involving human participants were in accordance with the ethical standards of the institutional research committee and with the 1964 Helsinki declaration and its later amendments or comparable ethical standards. This study was approved by the Institutional Review Board of Federal University of Rio Grande do Sul under the Certificate of Presentation for Ethical Appreciation (CAAE) number: 11253312.8.0000.5347.
B. IEE Database (DB3) Acquisition
The sEMG signals were acquired through a commercial EMG device (EMG 830 C, from EMG System do Brasil) with a combined gain of 2000 times and a 4th order passband filter tuned in 20 Hz – 500 Hz frequency, which contemplates the range of EMG signals for upper-limb movements, as presented in [23]. Both the EMG equipment and the notebook used on the acquisition were battery-powered, in order to avoid 60 Hz noise interference. The digitalization of the signal was performed with a 2 kHz of sampling frequency and 18 bits of quantization through a NI USB-6289 platform from National
Instruments. All the signals were acquired while a sequence of
movements were shown to the subjects sited in front of a LCD display. The subjects were required to reproduce 102 movements, containing six repetitions of 17 distinct movements as naturally as possible, with no constraints in relation to time or force, as occur in NinaPro database, detailed in [10]. The movements performed were the same proposed on Exercise B of [10].
C. Signal Pre-Processing and Feature Extraction
The pre-processing of data comprehends the processes of segmentation, rectification and normalization of the signal. For the segmentation process, the timestamps from the assays were used as time-reference. After the segmentation, a full-wave rectification and the normalization of each channel was performed in order to provide more discrepancy to the signals acquired.
Once the signal is segmented and conditioned, the features (RMS value, Variance and Median Frequency) were extracted to be used as input parameters of the RLR method used as ML technique for this work. No dimensionality reduction was performed since the objective is to evaluate the variation of the chosen inputs in the accuracy rate.
D. Input Parameters Variation
For the variation of the RLR input values we used two factors: the sEMG channels and the combination of features extracted. In each main instance of test a different combination of channels was used to perform the classification. Within each channel set, all the possible combinations of the features were performed.
The positioning of channels 1 to 8 is random, thus, they were considered as a group and an individual evaluation of every channel was not performed. For every instance of channel set, all the possible variation of features were performed, since 1-1 (channel group – feature group) to 11-7, as presented on Table I. Based on those input sets, different models were trained and tested. Thus, considering the 11 channel variations and the 7 features combinations, the system builds 77 different models for each one of the 50 subjects.
In order to extract the maximum of information from the database a k-fold (k=6) was performed. In each k instance, 66,66% of each individual movement repetitions were used for training and 33,33% used for test.
TABLE I. CHANNELS AND FEATURES VARIATIONS Channels Variation (C.V.) Channels Used Feature(s) Variation (F.V.) Feature(s) Used 01 1 to 8 1 RMS 02 1 to 8 + 9 2 VAR 03 1 to 8 + 10 3 Med. Freq. 04 1 to 8 + 11 4 RMS + VAR 05 1 to 8 + 12 5 RMS + Med. Freq. 06 1 to 9 + 10 6 VAR + Med. Freq. 07 1 to 9 + 11 7 All 08 1 to 9 + 12 09 1 to 10 + 11 10 1 to 10 + 12 11 1 to 12
E. Regularized Logistic Regression Model Fitting
This work makes use of the RLR method proposed in [17]. Some improvements were made in the algorithm (which now is capable to identify 17 movements), and in the model fitting (tests of coefficients to generate the most proper model). Moreover, now the tests are performed in 50 subjects, including 10 upper-limb amputees.
The Logistic Regression (LR) model, often called maximum entropy classifier, consists on a probabilistic supervised classification method. LR makes use of Equation (1), also known as Logistic Equation to predict the - a
posteriori - probability (P), of an input (x), parametrized by
(β) on a certain instance (i), to belong (Y=1) to a certain labeled class. Thus, the a posteriori probability of an input instance to belong to a class is calculated.
𝑃(𝑌 = 1|𝑥;𝛽) = 1
1 + 𝑒−(β0,𝑘 +β1,𝑘 𝑥1,𝑖 +β2,𝑘 𝑥2 +β𝐶 ,𝑘 𝑥𝐶 ,𝑖) (1)
To reach the most proper values for the β vector of coefficients, generally an optimization method is performed. The optimization is often performed on a cost function which describes the difference between hypothesis (ℎ𝛽) and the actual output values, aiming to minimize its value. The cost function 𝐽(𝛽) of the model is defined in Equation (2).
(2) In this paper we used an optimization model based on descent gradient, which may be considered the most classical optimization approach. The gradient descent method is utilized as showed in Equation (3).
𝛽𝑘+1 =𝛽𝑘− 𝛼[1 𝑚∑(ℎ𝛽(𝑥 (𝑖))− 𝑌(𝑖)) 𝑥 𝑘 (𝑖) 𝑚 𝑖=1 ] (3) Where βk are the values of weights 𝛽 in kth instance and 𝛼 is
the module (step size) for the gradient descent. The regularized version of the algorithm (used to prevent issues involving overfiting and/or underfiting of the model) was utilized.
The regularization term (λ), prevents 𝛽𝑘 coefficients to reach high values and doing so, assures the strictly convergence of the cost function 𝐽(𝛽). With the 𝐽(𝛽) as a strictly convex function, we prevent the optimization from stuck in local minimum values. As detailed in [17], the regularized model of LR is presented on Equation (4).
𝛽𝑘+1=𝛽𝑘− 𝛼[1 𝑚∑(ℎ𝛽(𝑥 (𝑖))− 𝑌(𝑖)) 𝑥 𝑘 (𝑖) + 𝜆 𝑚 𝑚 𝑖=1 𝛽𝑘] (4) A more elegant formulation of Equation (4), expressed in terms of 𝐽(𝛽) is presented on Equation (5).
𝛽𝑘+1(𝑖) = 𝛽𝑘(𝑖)− 𝛼 [1 𝑚∑ ∇𝐽𝛽𝑘 (𝑖) . 𝑥𝑘(𝑖)+ 𝜆 𝑚 𝑚 𝑖=1 𝛽𝑘] (5)
Where βk+1 is the future value of the LR coefficient model
on the kth iteration of the optimization algorithm (gradient
descent), ∇𝐽𝛽𝑘(𝑖) is the gradient of the cost function to each i movement and input sample 𝑥𝑘(𝑖), α is the step size of gradient and the λ is the regularization parameter for the model.
The values of α and λ are frequently chosen empirically. Instead of choose a random unique value, we tested a combination of 100 values of each parameter and based on accuracy rate we choose the most proper value to each subject. The range used was 0,005 – 0,5 for alpha and 0,00005 – 0,005 for lambda. The most usual value was 0,1 to alpha (25 times) and 0,005 for lambda (30 times).
III. RESULTS AND DISCUSSION
Several results derived from the variation of parameters proposed. In the Table II, it is possible to observe the different accuracies for each movement and the difference among the databases achieved through the total variation of channels and features used as input parameters, as proposed in the Table I.
TABLE II. CHANNEL AND FEATURES VARIATIONS MEAN RESULTS
ACCURACY RATE (%)
Movement NON AMP. Amp. IEE Mean
1 76,7 64,9 73,5 71,7 2 68,7 61,9 69,6 66,7 3 76,9 64,4 78,8 73,4 4 65,3 66,4 68,6 66,8 5 65,2 60,8 83,6 69,9 6 88,15 77,6 70,5 78,8 7 74,7 58,9 61,4 65,0 8 65,9 56,7 67,5 63,4 9 64,0 42,9 70,4 59,1 10 71,1 57,3 58,7 62,4 11 55,8 47,5 57,9 53,7 12 63,5 52,8 68,5 61,6 13 89,3 63,8 94,6 82,6 14 88,0 69,9 89,2 82,4 15 78,8 74,4 87,1 80,1 16 80,2 62,7 87,7 76,9 17 91,6 69,1 74,2 78,3 Global Mean 74,3 61,9 74,2 70,2
This table is particularly useful considering the possibility of choose less movements for a prosthetic use. It is perfectly possible to use a subset from the proposed group of 17 movements that present a major accuracy rate or are considered movements of easier modeling/classification. Also, frequently solutions are presented for hand and finger movements only, ignoring movements with greater degree of freedom.
In relation to databases, the amputee subjects present less accurate movement recognition. It is also possible to identify the movements that had better accuracy rate, they are: movement 6 (flexion of all fingers); movement 13 (wrist flexion); 14 movement (wrist extension); movement 15 (wrist radial deviation); movement 16 (wrist ulnar deviation) and movement 17 (wrist extension with closed hand). Our assumption is that those movements benefit of the position adopted for the electrodes because they directly dependent of muscles covered by channels 1 to 8 positioned around the radio-humeral joint. Moreover, the channels 9 and 10 are positioned next to the wrist, on an area that usually does not have a thick layer of fat tissue, improving the sEMG signal, which appears to describe the wrist movements properly. The movements 8 to 12 have a worse performance (movement 8 is slightly better). Movements 9, 11 and 10, 12 are quite similar to each other and appear to confuse not only the classification algorithm but the subject itself, inserting human error in the system, what is beyond the scope of this study. Movements 1 to 5 are movements of more fine motor, their accuracy rates revolve around the global average of recognition of movements.
A. Features Variation (F. V.)
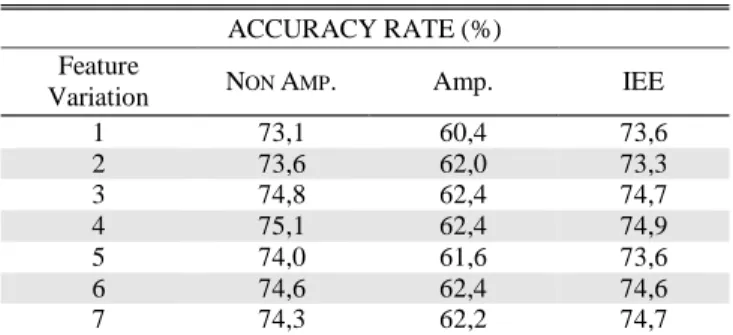
The results in Table II are average results considering all the factors and their variations. A more specific effect of the factors variations is presented further on this chapter, where all the results from the variations of channels and features are exposed. The Table III presents the effect of the variation of the features as input parameters, in average results, disregarding the variation of channels and movements.
TABLE III. ACCURACY RATE ACCORDING FEATURES VARIATION FOR
THE THREE DATABASES
ACCURACY RATE (%) Feature
Variation NON AMP. Amp. IEE
1 73,1 60,4 73,6 2 73,6 62,0 73,3 3 74,8 62,4 74,7 4 75,1 62,4 74,9 5 74,0 61,6 73,6 6 74,6 62,4 74,6 7 74,3 62,2 74,7
The features variation does not appear to provoke a substantial accuracy variation. In fact the values are very close to each other, differing only according the database. Although, the features do present a pattern of tendency in the results. For
instance, the Median Frequency (F.V. 3) presents a slight better accuracy – 74,8%, 62,2% and 74,4%, respectively – compared with the others. Likewise, RMS combined with Variance (F.V. 4) presented a better accuracy – 75,1%, 62,4% and 74,9%, respectively – than the other combinations (including the total combination of all features). It should be emphasized that the values of features are directly dependent on the quality/integrity of the signal, and consequently of the user of the system and acquisition protocol. It is possible; for instance, that a sEMG signal of an amputee subject to be discrepant to the point of not provide good results even in a classifier previously used for a non-amputee subject that presented good results. At the same time it is important to highlight that this paper only made use of three characteristics and their combination which represents a small percentage of the possible approaches for the sEMG signal processing. An analysis covering more features would be interesting to confirm this observed behavior and tests in order to reduce the number of characteristics are desired since the use of fewer features reduce the processing time, making the algorithm more computationally efficient, which is very interesting (mainly in practical/embedded applications).
B. Channels Variation (C. V.)
The next parameter to be variated is the group of different channels to be used in signal acquisition, their variations and their impact on the accuracy rate is presented on Table 4.
TABLE IV. ACCURACY RATE ACCORDING CHANNELS VARIATION
FOR THE THREE DATABASES
ACCURACY RATE (%) Channels
Variation NON AMP. Amp. IEE
1 68,6 55,3 66,2 2 66,4 54,8 67,5 3 61,2 51,4 64,0 4 64,9 55,0 63,9 5 70,9 58,5 69,4 6 73,7 60,0 73,7 7 80,7 66,8 80,0 8 84,2 71,3 84,2 9 79,9 68,3 81,1 10 82,4 69,1 82,3 11 83,7 70,3 84,4
The number of channels used, in theory, should be more drastic than the number of features. This statement is based on the fact that the classifier inputs come from (Channels x Features) + 1. Thus, to remove a channel is the same as to remove three possible inputs (derived from three features) to describe the system.
However, from the results obtained, apparently this rule that “the more, the better” is not absolute given the best overall accuracy rates achieved. The full combination of channels (C. V. 11) proved to be the better option only for IEE database and yet, its standard deviation margin includes the (C. V. 8 – combination of channels 1 to 9 + 12), which scores best in the
other two databases. Moreover, the combinations C. V. 6 (channels 1 to 9 + 10) and C. V. 7 (channels 1 to 9 + 11) scores around 10% and 4% worse, respectively. These two last combination make use of 10 channels each, but still do not perform as well as C. V. 8, proving the importance of electrode positioning in the process.
Likewise, the worst accuracy was not achieved in the C.V. 1 situation, where only the channels 1 to 8 were used (68,6%, 53,3% and 66,2%, respectively), instead, the worse accuracy on classification - for database IEE C. V. 3 and C. V. 4 are considered equal - occur on C.V. 3 with accuracies of 61,2%, 51,4% and 64,0%, respectively. These results make it clear, for the data used, which channels influence most the overall accuracy of movements performed.
Apparently, although there is a tendency the accuracy increase the extent to which the channels are increased, there is no guarantee that the use of more channels provide a greater accuracy rate. One reason for this scenario is the positioning of the electrodes and movements performed. It is appropriate that the electrodes are always positioned to capture the largest contribution possible of the muscle responsible for a movement in order to describe it. This highlights the difficulty of working with a random placement of electrodes and the difficulty of adapting systems for amputees, who do not always have a proper muscle condition.
C. Channels and Features Variations Combined
After an isolated analysis of channel and feature variations, we decide to test the simultaneous influence of factors in order to compare the results.
An interesting observation is the fact that DB 2 and DB3 have greater standard deviation compared to DB1 in all the tests performed, as shown on Table III and Table IV that represents the mean results. The same occurs when the both
factors are varied simultaneously. We attribute this to the different sizes of databases (DB1 has 30 subjects while DB2 and DB3 have 10 subjects each) and the noise presence on the sEMG channels.
Moreover, on DB2 we have the problem of the lack of muscular tenacity that can also preclude the proper classification. Through the tests performed it was possible to observe that despite the feature variations do not affect drastically the overall accuracy rate, when their variation occur within a channel variation scenario they not only have a significant impact but also have a well-defined and similar behavior for the three databases.
Within our tests, we observe that although the C.V. 08 still presents itself as the better option considering accuracy, the features variations are now more significant and now for two databases (DB2 and DB3), the F. V. 6 (RMS + Median Frequency) and not F. V. 4 (RMS + Variance) reflects on better results. Thus, we decided to compare those two combinations in order to define the best configuration for those databases. The result of the test is presented on Figure 2. Given the standard deviation for both techniques, one can conclude that equivalent in relation to the accuracy rate. Therefore, the combination C. V. 8 and F. V. 6 presents a mean value slightly superior on 33 of 51 cases (64,7%). The considerable standard deviation present on amputees database evidences how difficult is to develop a method highly efficient that can deal with their limitations related to musculature and coordination to use a prosthesis capable of reproduce a wide range of movements. Finally, we reach the improvement rate of Table V comparing the results of Figure 2.B with the previous results from Table II.
Through the analysis of Table V the enhancement caused for the new configuration becomes evident for all the movements proposed. The new configuration shows itself capable to increase considerably even the accuracy of the
movements with lowest rates such as the movements 9 to 12. The average tax of improvement offered by the new input configuration was 16,9% but average values such as 25,7% were obtained for movement 9, considering all databases.
TABLE V. IMPROVEMENT OF ACCURACY RATE ACCORDING THE
SELECTED INPUTS ACCURACY RATE (%) Movement DB 1 (MEAN) DB 2 (Mean) DB 3 (Mean) Overall Mean 1 13,3 19,2 19,9 17,5 2 10,2 8,9 14,5 11,2 3 10,6 11,6 14,5 12,2 4 14,4 13,6 18,9 15,6 5 13,8 15,1 10,7 13,2 6 8,25 8,3 12,9 9,8 7 14,8 17 22 17,9 8 18,6 15 18,4 17,3 9 18,8 18 16,3 17,7 10 20 16,8 9,6 15,5 11 17,9 15,9 12,1 15,3 12 12,6 12,1 14,8 13,2 13 6,3 6,2 3 5,2 14 8,2 8,5 9,1 8,6 15 12,5 10,6 10,4 11,2 16 4,7 10,7 8,2 7,9 17 5,1 8,5 9,9 7,8 Global Mean 12,4 12,7 13,3 12,8 IV. CONCLUSION
A Regularized Logistic Regression algorithm was used to classify 17 distinct upper-limb movements through sEMG signal processing. Different inputs for the RLR method were proposed based on 12 channels utilized in 11 combinations and 3 features used in 7 combinations to identify the configuration capable of reach the great accuracy rate among them all. The experiments were conducted on an extensive dataset with 50 subjects (10 amputees), very rarely seen in this study field.
Through the results achieved it was possible to define the best configuration of channels for the three databases tested (C. V. 8). Moreover, it was possible to define the best configuration for the features (F. V. 4 & F. V. 6) among those used and also to analyze the influence of different configurations combined with the variations of the channels.
After all the tests and considerations, we reach a unique configuration that we compared with the global mean and demonstrate its capacity of enhancement. The overall percentage on improvement is around 13%, considering all movements. Additionally, the movements with higher accuracy rate were identified (1, 3, 6, 7, 10, 13-17), which may give an expected good result of the method applied on a prosthetic limb.
The most proper configuration is capable of not only increase the classification accuracy but to do that using less information, once it does not use the all channels and features scenario. Thus, we conclude that this technique could be placed on a calibration stage of an embedded system in order
to establish the most proper inputs considering some pre-set channels and features for the system. It would be also interesting to compare the developed approach with the technique described in [22] and also to perform feature reduction methods as well (e.g. PCA). That would help to compare the efficiency and limits of each technique.
REFERENCES
[1] M. Ison, P. Artemiadis, “The Role of Muscle Synergies in Myoelectric Control: Trends and Challenges for Simultaneous Multifunction Control,” J. Neural Eng. 11 (2014) 051001. doi:10.1088/1741-2560/11/5/051001.
[2] Bronzino, J.; Enderle, J. Introduction to Biomedical Engineering. 3rd. ed. Burlington: Elsevier, 2012, pp. 619.
[3] L. Vodovnik, C. Long, A. Lippay, D. Starbuck, “Myo-Electric Control of Paralyzed Muscles,” IEEE Transactions on Biomedical Engineering (12):3, pp. 169–172, (1965).
[4] D. Graupe and W.K. Cline, “Functional Separation of BMG Signals via ARMA Identification Methods for Prosthesis Control Purposes,” IEEE Transactions on Biomedical Engineering (5):2, pp. 252–259, (1975).
[5] E. Medica, E. Field, G. Schoffa, K. Hoffmann, Graybill, Comments on “Upper Extremity Limb Function Discrimination Using EMG Signal Analysis and the Relationship Between Parallel-Filtering and Hypothesis-Testing Limb Function Classifiers,” IEEE Transactions on Biomedical Engineering (32):3, pp. 239–241, (1985).
[6] M. Zardoshti-kermani, B.C. Wheeler, K. Badie, R.M. Hashemi, “EMG Feature Evaluation for Movement Control of Upper Extremity Prostheses,” IEEE Transactions on Biomedical Engineering (3):4, pp. 324–333, (1995).
[7] M.C. Carrozza, G. Cappiello, G. Stellin, F. Zaccone, F. Vecchi, S. Micera, et al., “On the Development of a Novel Adaptive Prosthetic Hand with Compliant Joints : Experimental Platform and EMG Control,” (n.a.).
[8] L.H. Smith, S. Member, T.A. Kuiken, S. Member, L.J. Hargrove, “Evaluation of Linear Regression Simultaneous Myoelectric Control Using Intramuscular EMG,” IEEE Transactions on Biomedical Engineering (62):4, pp. 737–746, (2016).
[9] A.J. Young, S. Member, L.H. Smith, E.J. Rouse, L.J. Hargrove, “Classification of Simultaneous Movements Using Surface EMG Pattern Recognition,” IEEE Transactions on Biomedical Engineering (60):5, pp. 1250–1258, (2013).
[10] ATZORI, M.; et al. “Electromyography data for non-invasive naturally-controlled robotic hand prostheses,” Nature Scientific Data, (1):1 pp. 1–13, (2014). Available in: <http://www.nature.com/articles/sdata201453>. Acessed on: Feb, 13th, 2015. DOI: 10.1038/sdata.2014.53.
[11] JIANG, N. et al. “Is accurate mapping of EMG signals on kinematics needed for precise online myoelectric control,” IEEE Transactions on Neural Systems and Rehabilitation Engineering, (22):3, pp. 549–558, (2014).
[12] AHSAN, M. R.; IBRAHIMY, M. I.; KHALIFA, O. O. “Neural network classifier for hand motion detection from EMG signal,” Proceedings On International Conference On Biomedical Engineering,” Kuala Lumpur. Springer, (2011), pp. 536-541. [13] KWON, S.; KIM, J. “Real-time upper limb motion estimation from surface electromyography and joint angular velocities using an artificial neural network for human-machine cooperation,” IEEE Transactions Information Technology in Biomedicine. (15):4, (2011), pp. 522–520.
[14] GUVENC, S.A.; DEMIR, M.; ULUTAS, M. “Detection of forearm movements using wavelets and Adaptive Neuro-Fuzzy Inference System (ANFIS),” Proceedings on IEEE International
Symposium On Innovations In Intelligent Systems And Applications (INISTA), (2014), pp. 192-196.
[15] A. Balbinot, G. FAVIEIRO, “A Neuro-Fuzzy System for Characterization of Arm Movements,” Sensors. Basel, (3):2, (2013), pp. 2613–2630.
[16] X. Zheng, W. Chen, B. Cui, “Multi-gradient Surface Electromyography (sEMG) Movement Feature Recognition Based on Wavelet Packet Analysis and Support Vector Machine (SVM),” 5th
International Conference on Bioinformatics and Biomedical
Engineering, (iCBBE), (2011) pp. 1–4. doi:
10.1109/icbbe.2011.5780242.
[17] V.H. Cene, A. Balbinot, “Upper-Limb Movement Classification Through Logistic Regression sEMG Signal Processing,” 2015 Latin America Congress on Computational Intelligence (LA-CCI), (2015). doi: 10.1109/LA-CCI.2015.7435940.
[18] G.R. Naik, K. Dinesh, “Identification of hand and finger movements using multi-run ICA of surface electromyogram,” Journal of Medical Systems. (36):2, (2012), pp. 841-851.
[19] P. Geethanjali, “Comparative study of PCA in classification of multichannel EMG signals,” Australas. Phys. Eng. Sci. Med. 38 (2015), pp. 331–343. doi:10.1007/s13246-015-0343-8.
[20] F. Riillo, L.R. Quitadamo, F. Cavrini, et al., “Optimization of EMG-based hand gesture recognition: Supervised vs. unsupervised data preprocessing on healthy subjects and transradial amputees,” Biomed. Signal Process. Control. 14, (2014), pp. 117–125. doi:10.1016/j.bspc.2014.07.007.
[21] B. Lock, K.B. Englehart, B. Hudgins, “Real-time myoelectric control in a virtual environment to relate usability vs. accuracy,” Proc. 2005 MyoElectric Control. Prosthetics Symp. (2005), pp. 17– 20. http://dukespace.lib.duke.edu/dspace/handle/10161/2721. [22] V. H. Cene, G. Favieiro, A. Balbinot, Upper-limb Movement “Classification Based on sEMG Signal Validation with Continuous Channel Selection,” 37th IEEE Annual International Conference of
the IEEE Engineering in Medicine and Biology Society, (2015), pp. 486-489, doi:10.1109/EMBC.2015.7318405.
[23] C. De Luca, “The use of surface electromyography in biomechanics,” Journal of Applied Biomechanics. 13(2), (1997), pp. 135-163, doi: citeulike-article-id: 2515246.
[24] K. Moura, G. Favieiro, A. Balbinot, “Support vectors machine classification of surface electromyography for non-invasive naturally controlled hand prostheses,” 38th IEEE Annual International
Conference of the IEEE Engineering in Medicine and Biology Society, (2016), pp. 788-791, 10.1109/EMBC.2016.7590819.
© 2016 by the authors. Submitted for possible open access publication under the terms and conditions of the Creative
Commons Attribution (CC-BY) license
![Fig. 1. Placement of the 12 sEMG channels used to acquire the EMG signal (adapted from [24]).](https://thumb-eu.123doks.com/thumbv2/123dok_br/15577190.1048707/2.918.79.442.258.639/fig-placement-semg-channels-used-acquire-signal-adapted.webp)