UNIVERSIDADE DE LISBOA
INSTITUTO DE GEOGRAFIA E ORDENAMENTO DO TERRITÓRIO
THE USE OF GIS TO ANALYZE THE ENVIRONMENTAL AND
SOCIAL INFLUENCE TO MEDICATED ASTHMA
IN NEW ZEALAND
Janina Saskia Katharina Bäumler
MESTRADO EM SISTEMAS DE INFORMAÇÃO GEOGRÁFICA E MODELAÇÃO TERRITORIAL APLICADOS AO ORDENAMENTO
Dissertação orientada pelo Prof. Doutor Eusébio Joaquim Marques dos Reis Co-orientação: Prof. Doutor Nuno Manuel Sessarego Marques da Costa
i
O uso de SIG para a análise da influência ambiental e social asma medicada
na Nova Zelândia
Janina Saskia Katharina Bäumler
Resumo
Esta dissertação incide na análise da relação entre a asma e as diversas variáveis espaciais independentes, ambientais e sociais, que se suspeita terem alguma influência na ocorrência desta doença, tendo como referência o território da Nova Zelândia. Os dados baseiam-se na utilização da “asma medicada”, ou seja, que inclui não apenas as consultas em hospitais e centros de saúde, mas também os casos em que ocorreu tratamento preventivo e medicação da asma. Para este efeito, o trabalho assenta na utilização de Sistemas de Informação Geográfica (SIG) e utiliza os algoritmos de Análise de Correlação Multivariada (Multivariate LISA), presentes no programa “Open GeoDa“ e a Análise de Regressão (Ordinary Least Squares e
Geographically Weighted Regression) presente no software ArcGIS (versão 10), com base na
ferramenta “Exploratory Regression”. A variável “asma medicada” é representada por Census
Area Unit (CAU). O objectivo principal é descobrir quais variáveis que determinam a
distribuição espacial da “asma medicada” na Nova Zelândia, e, através da sua combinação, construir um modelo adequado. A Nova Zelândia é um dos países do Mundo com a maior preponderância de asma; a análise é feita para todo o país, mas também para a região de Auckland. A razão pela qual a região de Auckland é seleccionada para a análise é porque é mais influenciada pela poluição do ar que o resto de Nova Zelândia. Além disso a cidade de Auckland é a cidade mais povoada da Nova Zelândia. Para a análise regional foram utilizadas somente as variáveis sociais; para a análise nacional as variáveis ambientais e sociais foram consideradas. As variáveis ambientais utilizadas para a análise nacional foram: temperatura (média e mínima), balanço hidrológico, humidade, precipitação, velocidade do vento, altitude, grau de urbanização, ocupação do solo, poluição do ar (PM10, PM2,5) e densidade de estradas.
No caso da região de Auckland, as variáveis ambientais não foram analisadas através da Análise de Correlação/ Análise de Regressão. Contudo, a localização de autoestradas e dos aterros sanitários foram tidas em conta. As variáveis sociais utilizadas foram: idade, etnia, número de crianças, número de quartos, educação, renda pessoal, renda familiar, situação de emprego, New Zealand Deprivation Index, meios de deslocação para o trabalho, tipo de
ii
aquecimento, emissões domésticas de aquecimento (PM10) e densidade populacional (esta só
para a análise nacional).
Após o mapeamento da distribuição da “asma medicada” para a Nova Zelândia e para a região de Auckland, foi aplicada a análise de cluster, a qual mostra que existe um clustering das
Census Area Units com alta / baixa prevalência de asma. De seguida, aplicou-se a Análise de
Regressão e a Análise de Correlação, para examinar a relação de cada variável dependente com a variável independente (“asma medicada”).
Os resultados mostram que a análise é mais precisa para o âmbito regional, pois apresenta um “R² ajustado” (Análise de Regressão) e um Moran´s I (Análise de Correlação) mais altos para a maioria das variáveis individuais e tem também um R² ajustado mais alto para o modelo. Na análise regional, diversas variáveis mostram uma relação forte. A percentagem da população da etnia ”Pacific Islanders“ (R² ajustado: 0,41; relação negativa) e a percentagem das famílias com 2 crianças (R² ajustado: 0,50; relação positiva) têm um R² ajustado e Moran´s I alto. No caso da situação económica, verifica-se que as CAU com uma elevada proporção de classe social mais elevada têm também uma taxa aumentada de “asma medicada”. As variáveis renda pessoal (R² ajustada: 0,43) e renda familiar (0,46), a percentagem da população desempregada (R² ajustada: 0,29) ou empregada a tempo parcial (R² ajustada: 0,28) têm, todas, uma relação positiva com a prevalência de “asma medicada”. Em contrapartida, a proporção de pessoas sem educação escolar (R² ajustada: 0,22) tem uma relação negativa. À primeira vista é um resultado inesperado; no entanto, esta situação pode ser explicada pelo facto do indicador usado para representar a prevalência da asma ser a "asma medicada". Isto pode significar que pessoas com melhor situação financeira disponham com maior facilidade de medicação preventiva ou visitas ao médico de família do que as pessoas com baixa renda. Para a análise nacional o tipo de relação foi a mesma que para as variáveis sociais; no entanto, o grau de relação foi muito mais baixa do que para a análise regional. A observação de que as classes sociais mais elevadas parecem ter uma maior prevalência de asma é confirmado na análise nacional.
A Análise de Regressão e de Correlação para as variáveis ambientais (executado à escala nacional) mostram que o “R² ajustado” e o “Morans´I” são, em geral, pequenos. A variável que melhor descreve a distribuição da prevalência de “asma medicada” é o grau de urbanização (R² ajustado: 0,21; Moran´s I -0,4204). A relação negativa significa, neste caso, que a população em áreas urbanas é mais afetada do que a população em áreas rurais. Além da variável grau de urbanização, o " R² ajustado" para as outras variáveis é apenas 0,10 no
iii
máximo (poluição do ar PM2,5). 9% do padrão da “asma medicada” pode ser explicado usando
o balanço hidrológico (relação negativa) ou precipitação (relação positiva).
As variáveis “superfícies artificiais” (relação positiva), a “área da floresta” (relação negativa), a “poluição do ar a partir de fontes naturais” (relação negativa), a “densidade de todas as estradas” (relação positiva) têm, todas, um R² ajustado de 0,08, o que significa que podem explicar 8% da distribuição da prevalência de “asma medicada”.
Para o modelo, as 5 variáveis mais adequadas podem explicar 73% do padrão de asma tratado para a região de Auckland (utilizando Geographically Weighted Regression). Este valor é bom, no entanto o modelo não passa o teste de "Moran´s I p-value", que verifica a autocorrelação espacial. Para a análise nacional obtém-se apenas 26% (OLS)/ 33% (GWR), quando se utilizam 5 variáveis ambientais e 33% (OLS) / 48% (GWR) quando se utilizam 5 variáveis sociais. Adicionalmente, construi-se um modelo através d combinação de variáveis sociais e de variáveis ambientais. A ferramenta “Exploratory Regression” do ArcGIS selecciona as variáveis com essa finalidade: percentagem da famílias com 6 e mais crianças, percentagem de população com renda pessoal acima de 50.000 NZD, percentagem que viaja para o trabalho de carro, grau de urbanização e precipitação; o R² ajustado utilizando OLS é 0,36 e com GWR é 0,45.
Os resultados da Análise de Regressão mostram que, mesmo com uma grande variedade de variáveis, pode-se considerar que ainda faltam variáveis principais para que seja possível formar um modelo que possa satisfazer as exigências de forma satisfatória. A cartografia da doença mostra que existe uma relação forte entre poluentes como H2S e SO2 e as áreas com
asma. No entanto, não foi possível incluir estas variáveis na Análise de Regressão e Correlação porque não há dados nacionais.
Limitações da análise e dos resultados resultam dos dados individuais não estarem acessíveis, mas apenas a taxa por CAU. Isso significa que, especialmente para as variáveis sociais, há uma maior incerteza. Além disso, a residência da população foi considerada, mas pode ser que uma pessoa trabalhe ou vá à escola em outro CAU e esteja exposta também, e de forma regular, às variáveis ambientais deste CAU.
Palavras-chave: SIG, asma medicada, método dos Mínimos Quadrados, Regressão Ponderada Geograficamente, Nova Zelândia
iv
The use of GIS to analyze the environmental and social influence to
medicated asthma in New Zealand
Janina Saskia Katharina Bäumler
Abstract
This GIS study uses correlation analysis (Multivariate LISA) through Open GeoDa and regression analysis (Ordinary Least Squares and Geographically Weighted Regression) through ArcGIS 10 to analyze and examine the relation of medicated asthma and independent environmental and social variables that are suspected to influence the disease of asthma. The main target was to find out which variables determine the spatial distribution of medicated asthma throughout New Zealand to later combine these variables to build a suitable model. A regional scale analysis is carried out for the Auckland region, combined with a national scale analysis for New Zealand (main islands). For the Auckland regional only social variables are tested, while the nationwide analysis included environmental and social variables.
The findings show that the analysis is more accurate for the regional scale, which reaches a much higher adjusted R² (regression analysis) and Moran´s I (correlation analysis) for the majority of the individual variables, but also for the entire model. The social variables all in all were more suitable to explain the pattern. 73% of the spatial distribution of medicated asthma of Auckland could be explained through a selection of the 5 most appropriate variables (using Geographically Weighted Regression). For the national model only 26% (OLS) / 33% (GWR) using 5 environmental variables and 33% (OLS) / 48% (GWR) using 5 social variables could be explained. Selecting 5 variables of either social or environmental characteristics explains 36% (OLS) / 45% (GWR) of the medicated asthma prevalence. The output results of the regression analysis made it clear that despite the variety of variables tested, key explanatory variables are still missing. The disease mapping part leads to the assumption that air pollutants for which no national wide measurements exist (H2S, SO2) play
an important role with the distribution of asthma.
Keywords: GIS, medicated asthma, Ordinary Least Squares, Geographically Weighted Regression, New Zealand
v
Index
RESUMO ... I ABSTRACT ... IV INDEX ... V INDEX OF FIGURES ... VII INDEX OF TABLES ... X ACKNOWLEDGMENTS ... XI
1. INTRODUCTION ... 1
1.1 MOTIVATION FOR THIS STUDY ... 3
2. BACKGROUND ... 4
2.1 ASTHMA ... 4
2.1.1 Principles of asthma ... 4
2.1.2 Global burden of asthma ... 4
2.1.3 Common causes for asthma ... 5
2.2 THE AREA UNDER INVESTIGATION:NEW ZEALAND ... 10
2.2.1 Study Area ... 10
2.2.2 Location and administrative divisions ... 11
2.2.3 Population ... 12 2.2.4 Economy ... 14 2.2.5 Physical Environment ... 14 2.2.5.1 Relief ... 15 2.2.5.2 Climate ... 16 2.2.5.3 Vegetation ... 20 2.2.5.4 Air Quality ... 21
2.3 ASTHMA IN NEW ZEALAND –LITERATURE REVIEW ... 24
3. DATA AND METHODS ... 28
3.1 DATA ... 28
3.1.1 Asthma prevalence – the dependent variable ... 28
3.1.2 Independent Variables ... 29
3.1.2.1 Environmental variables ... 30
3.1.2.2 Social Characteristics ... 35
3.1.2.3 Summary of all Variables ... 38
3.2 METHODS ... 39
3.2.1 Literature Review ... 39
3.2.2 Data preparation ... 39
3.2.3 Disease Mapping ... 40
3.2.4 Analysis Process ... 40
3.2.4.1 Spatial Pattern Analysis ... 40
3.2.4.2 Correlation Analysis ... 42
3.2.4.3 Regression Analysis ... 43
3.2.4.3.1 Exploratory Regression ... 44
3.2.4.3.2 Ordinary Least Squares Regression ... 45
vi
4. RESULTS ... 47
4.1 GENERAL CHARACTERISTICS OF ASTHMA DISTRIBUTION ... 47
4.1.1. New Zealand ... 47
4.1.2. Auckland... 48
4.2 CLUSTER ANALYSIS ... 50
4.2.1 New Zealand ... 50
4.2.2 Auckland ... 52
4.3 RELATION OF ASTHMA WITH INDEPENDENT VARIABLES... 54
4.3.1 Regional scale - Auckland ... 54
4.3.1.1 Social Characteristics ... 54
4.3.1.1.1 Exploratory Regression/ Correlation Analysis ... 54
4.3.1.1.2 Ordinary Least Squares ... 63
4.3.1.1.3 Geographically Weighted Regression... 65
4.3.1.2 Mapping of spatial characteristics ... 66
4.3.1.2.1 Road traffic ... 66
4.3.1.2.2 Landfills ... 68
4.3.2 National scale - New Zealand ... 69
4.3.2.1 Social Characteristics ... 69
4.3.2.1.1 Exploratory Regression/Correlation Analysis... 69
4.3.2.1.2 Ordinary Least Squares ... 78
4.3.2.1.3 Geographically Weighted Regression... 80
4.3.2.1.4 Conclusion – Social Characteristics New Zealand ... 81
4.3.2.2 Environmental Variables ... 82
4.3.2.2.1 Exploratory Regression/Correlation Analysis... 82
4.3.2.2.2 Ordinary Least Squares ... 87
4.3.2.2.3 Geographically Weighted Regression... 90
4.3.2.3 National Analysis Model ... 91
4.3.2.3.1 Exploratory Regression ... 91
4.3.2.3.2 Ordinary Least Squares ... 92
4.3.2.3.3 Geographically Weighted Regression... 94
4.3.3 Additional Region ... 95
4.3.3.1 Geothermal Bores Taupo Volcanic Zone ... 95
5. CONCLUSION ... 96 BIBLIOGRAPHY ... CI
vii
Index of Figures
Figure 1 - World map of prevalence of clinical asthma ...5
Figure 2 - The Study Area: location of Auckland sub region in New Zealand ... 11
Figure 3 - District Health Boards in New Zealand ... 12
Figure 4 – Ethnic composition in percent per District Health Board in New Zealand ... 13
Figure 5 – Population density of New Zealand (persons/km²) in 2006 ... 14
Figure 6 – Elevation of New Zealand ... 15
Figure 7 - New Zealand Mean Annual Temperature (°C), 1950-1980 ... 17
Figure 8 - New Zealand Mean Minimum Temperature of the coldest month (°C), 1950-1980 ... 17
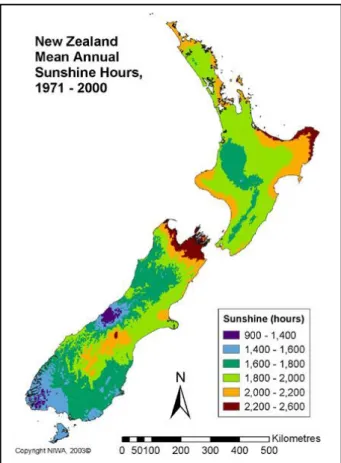
Figure 9 - New Zealand Mean Annual Sunshine Hours, 1971 - 2000 ... 18
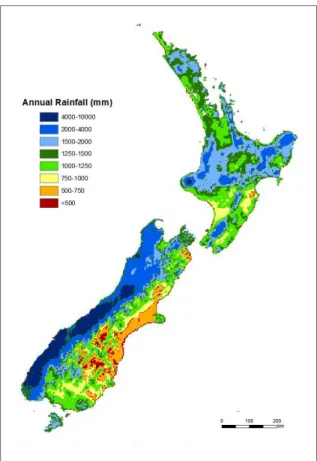
Figure 10 - New Zealand Mean Annual Rainfall (mm), 1971 - 2000 ... 19
Figure 11 - Land cover classes of New Zealand ... 21
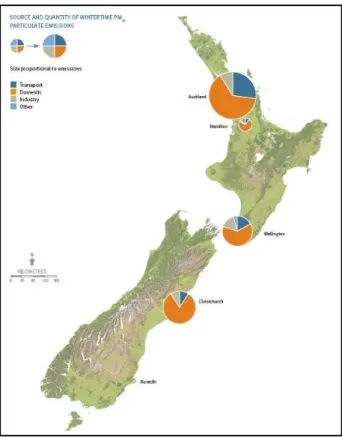
Figure 12 - PM10 emissions at New Zealand´s main population centers ... 22
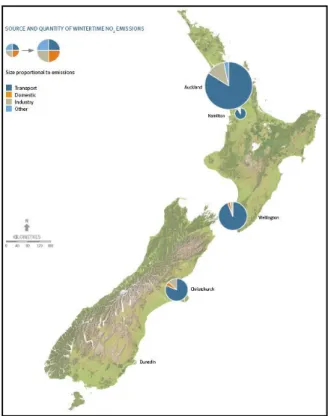
Figure 13 - NO2 emissions in New Zealand´s main population centers ... 23
Figure 14 – New Zealand Water Balance Ratio ... 30
Figure 15 – New Zealand Mean October Vapor Pressure Deficit (kPa) ... 31
Figure 16 - Equation for Regression Analysis ... 43
Figure 17 - Asthma prevalence (medicated Asthma) in New Zealand (2009/2010) ... 48
Figure 18 - Mean Asthma prevalence (medicated Asthma) in the Auckland region (2009/2010) ... 49
Figure 19 - Spatial Autocorrelation report – New Zealand ... 50
Figure 20 - Local Clusters – Asthma prevalence across New Zealand ... 51
Figure 21 - Spatial Autocorrelation report – Auckland region ... 52
Figure 22 - Local Clusters – Asthma prevalence across the Auckland region ... 53
Figure 23 - Correlation between medicated Asthma and age group “45 to 49” ... 55
Figure 24 – Correlation between medicated Asthma and age group “65 and over” ... 55
Figure 25 – Correlation between medicated Asthma and proportion Pacific Islanders ... 55
Figure 26 – Correlation between medicated Asthma and proportion Europeans ... 55
Figure 27 – Correlation between medicated Asthma and proportion Maoris... 55
Figure 28 – Correlation between medicated Asthma and proportion of households with 2 children .... 56
Figure 29 – Correlation between medicated Asthma and proportion of households with 6 or more children ... 56
Figure 30 – Correlation between medicated Asthma and proportion of people with income of more than 20,000 NZD ... 57
Figure 31 – Correlation between medicated Asthma and households with family income with more than 30,000 NZD ... 57
Figure 32 – Correlation between medicated asthma and percentage of population being part-time employed ... 58
Figure 33 - Correlation between medicated Asthma and percentage of unemployed population ... 58
Figure 34 – Correlation between medicated Asthma and percentage of population going to work by car ... 59
Figure 35 – Correlation between medicated Asthma and percentage of population going to work by bicycle/foot ... 59
viii
Figure 37 – Correlation between medicated Asthma and percentage of population without school
qualification ... 60
Figure 38 – Correlation between medicated Asthma and NZ Deprivation Index ... 60
Figure 39 – Correlation between medicated Asthma and percentage of households with 4 bedrooms . 61 Figure 40 – Correlation between medicated Asthma and domestic heating emissions (PM/g) ... 61
Figure 41 – Correlation between medicated Asthma and percentage of households using negative heating types ... 61
Figure 42 – Summary of OLS Results – Social Model - Auckland region ... 64
Figure 43 – Ordinary Least Squares Model – Social Characteristics – Auckland region ... 65
Figure 44 – Local Clusters of Standard Residuals (OLS) – Social Characteristics – Auckland region . 65 Figure 45 – Geographically Weighted Regression – Social Characteristics – Auckland region ... 66
Figure 46 - Buffer zones for Highways within the Auckland area in the context of asthma prevalence ... 67
Figure 47 - Low asthma prevalence within/close to buffer zones of Highways ... 68
Figure 48 - Coherence of medicated asthma prevalence and location of landfills ... 69
Figure 49 – Correlation between medicated Asthma and proportion of Asians ... 70
Figure 50 – Correlation between medicated Asthma and proportion of households with 2 children .... 71
Figure 51 – Correlation between medicated Asthma and proportion of households with at least 6 children ... 71
Figure 53 – Correlation between medicated Asthma and percentage of population with Personal Income at least 50,000 NZD ... 72
Figure 52 – Correlation between medicated Asthma and percentage of population with Personal Income at least 30,000 NZD ... 72
Figure 54 – Correlation between medicated Asthma and proportion of households with at least 70,000 NZD ... 72
Figure 55 - Correlation between medicated Asthma and proportion of households with at least 50,000 NZD ... 72
Figure 56 – Correlation between medicated Asthma and percentage of population going to work by car ... 73
Figure 57 - Correlation between medicated Asthma and percentage of population going to work by bus ... 73
Figure 58 - Correlation between medicated Asthma and percentage of population with postsecondary Degree ... 74
Figure 59 - Correlation between medicated Asthma and percentage of population with postsecondary Degree ... 74
Figure 60 - Correlation between medicated Asthma and NZ Deprivation Index ... 75
Figure 61 - Correlation between medicated Asthma and domestic heating emissions (PM/g) ... 75
Figure 62 - Correlation between medicated Asthma and population density ... 76
Figure 63 – Summary of OLS Results – Social Model – New Zealand ... 78
Figure 64 – Ordinary Least Squares Model – Social Characteristics – New Zealand ... 79
Figure 65 – Local Clusters of Standard Residuals (OLS) – Social Characteristics – New Zealand ... 80
Figure 66 – Geographically Weighted Regression – Social Characteristics – New Zealand ... 81
Figure 67 – Correlation between medicated Asthma and water balance radiation ... 82
Figure 68 - Correlation between medicated Asthma and average elevation ... 82
Figure 69 – Correlation between medicated Asthma and average slope... 82
ix
Figure 71 - Correlation between medicated Asthma and average urbanization ... 83
Figure 72 - Correlation between medicated Asthma and percentage artificial surface ... 84
Figure 73 - Correlation between medicated Asthma and percentage forest area ... 84
Figure 74 - Correlation between medicated Asthma and PM2.5 rate ... 85
Figure 75 - Correlation between medicated Asthma and percentage natural emission sources ... 85
Figure 76 - Correlation between medicated Asthma and PM10 rate ... 85
Figure 77 - Correlation between medicated Asthma and road density ... 85
Figure 78 - Summary of OLS Results – Environmental Model - New Zealand ... 87
Figure 79 – Ordinary Least Squares Model – Environmental Characteristics – New Zealand ... 88
Figure 80 – Local Clusters of Standard Residuals (OLS) – Environmental Characteristics – New Zealand ... 89
Figure 81 – Geographically Weighted Regression – Environmental Characteristics – New Zealand ... 90
Figure 82 – Ordinary Least Squares – National Model – New Zealand ... 92
Figure 83 – Local Clusters of Standard Residuals (OLS) – National Model – New Zealand ... 93
Figure 84 – Geographically Weighted Regression – National Model – New Zealand ... 94
x
Index of Tables
Table 1 – Extract from Excel table of Asthma rate per CAU ... 29 Table 2 - Summary of variables used and their area where applied to ... 38 Table 3 - Summary of Regression and Correlation analysis for social variables – Auckland region .... 62 Table 4 - Domestic heating (PM/g) statistics for New Zealand and Auckland ... 76 Table 5 - Summary of Regression and Correlation analysis for social variables – New Zealand ... 77 Table 6 - Summary of Regression/ Correlation Analysis – Environmental Variables – New Zealand . 86 Table 7 - Adjusted R² Results Summary ... 97 Table 8 – Correlation between Urbanization/PM2,5 levels and social variables ... 98
xi
Acknowledgments
This Master thesis is based on an internship at the Ministry of Health, New Zealand. I highly appreciate the support and help I have received from each member of the HDI Team at the Ministry of Health, in particular of Yvonne Galloway, the head of the HDI Team and Edward Griffin (GIS advisor). Everyone welcomed me with heart and made me part of the team instantly. Yvonne Galloway organized 1-one-1 meetings for me, to get to know the entire team personally, on which I had the opportunity to get an insight of the work of each employee and also received tips from everyone, with various backgrounds (Statistics, Public Health, Medicine and more) on how to pursue my study. Apart from this benefit, it is also important to mention that without the data I have received from the Ministry of Health, this study would have not been possible. Thank you once again for that.
A major thanks goes to my University – “Universidade de Lisboa” - in Portugal and in particular the Instituto de Geografia e Ordenamento do Território (IGOT), which prepared me to pursue the Master thesis by coursework and always supported me (in particular in terms of transfer and language difficulties).
Especially I would like to thank my supervisor Prof. Doutor Eusébio Joaquim Marques dos Reis who supported the internship and helped me whenever I had questions about the thesis and especially in the final stage of the writing process he helped me intensively, for what I am very grateful. The same applies to my co-supervisor Prof. Doutor Nuno Manuel Sessarego Marques da Costa, who helped me to improve my thesis. Their experience helped a lot and even though the communication went through e-Mail contact, due to my stay abroad, I was able to profit from their support and assistance. I also would like to thank Prof. Paulo Morgado Sousa, who I presented my study plans within the lecture “Projecto em SIG em Planeamento Territorial” and who gave me tips on how to pursue my thesis and brought up some valuable ideas.
Furthermore I want to express my gratitude towards my entire family, especially my parents who not only supported me financially, but also emotionally throughout the entire time. I am very blessed to have had the opportunity to base my Master thesis on the internship in New Zealand, which gave me great work as well as travel experience. Finally I would like to thank everyone who has supported me with data, which includes the Ministry of Health, the regional council of Auckland, the Ministry for the Environment, Simon Hales and the Asthma Research Group of Wellington. The great supply of data online is amazing and has helped me
xii
tremendously. In particular the Landcare Research and the National Institute of Water and Atmospheric Research (NIWA) offer vast material of reliable data, that is for the most part available free of charge by download from their websites. I am very lucky to have had access to such a huge quantity and quality of data, which enabled me to nearly include all variables that I wished to examine.
As a final remark I would like to note, that even though, going through highs and lows while analyzing and writing the thesis – it was a great and valuable experience which I am grateful to have had and would like to thank everyone who has made this possible.
1
1.Introduction
When the English Doctor John Snow discovered the connection of drinking water pumps and cholera cases in the 19th century, he basically set the roots for medical geography and realized that there is a link between health or disease and with geography/space. By plotting cholera deaths in London, he was able to locate clusters around water pumps which were infected and as a result concluded that cholera is water-borne (Brody et al., 2000). His discovery was a profound and fundamental step for disease mapping. Many illnesses are influenced or even based on geographical factors, such as climate, the availability and quality of water, altitude and more. Apart from that, human living conditions and style such as nutrition, hygiene, type of dwelling, economy or income also vary highly throughout the planet and have an impact on health and disease (Meade & Emch, 2010). Medical Geography tries to understand the health conditions and problems that are influenced and caused by geographical variables (Meade & Emch, 2010). Nowadays many researchers and institutions, like for example the World Health Organization or Centers of Disease Control and Prevention, use geographical methods to enlarge the understanding of diseases and thus being able to take precautions and effectively intervene (Meade & Emch, 2010).
Widely used in Medical Geography are Geographical Information Systems (GIS). Especially since the 1980s GIS has evolved as essential technology for optimal use and benefit of spatial data (Taylor & Jankowski, 2007). A Geographical Information System, commonly referred to as an information system, of which the database consists of observation of spatial objects, activities or events, which are defined through points, lines or polygons (Bartelme, 2005) enables the user to collect, store, implement and distribute a huge amount of data that can be used to analyze and model spatial relationships. GIS allows the linkage between geometric, graphical and attribute data (Bartelme, 2005). Therefore it enriches all subfields of geography, where spatial data is relevant. As a consequence also Medical Geography highly profits of GIS since relevant data can be assessed and by using spatial analysis methods, the correlation between health problems and spatial factors can be observed. Furthermore GIS can be used for planning, so that access to health care is optimized. The use of GIS in Public Health is a method, which can help in maintaining and improving peoples´ highest good – their health. With asthma being a widely spread disease in both developed and underdeveloped countries, it has become a common illness all around the World. The reasons for the development and severity of the disease asthma are not fully understood yet and are considered to be very
2
complex. Using GIS to approach the variables that can provoke asthma is a suitable method to benefit of obtainable data and investigate the influence of the factors by using spatial analysis methods. Since it would be quite time-consuming or superficial to do an analysis for the entire world population, it is helpful to narrow down the area and its habitants. To restrict the area under investigation for this work the country New Zealand was chosen, where asthma is one of the most common chronic diseases (Holt & Beasley, 2001). Depending on the variable and data, different scales are used on both regional and national scale.
This dissertation is based on an internship at the Ministry of Health of New Zealand located in Wellington. The Department of Health and Disability Intelligence, which is responsible for Statistics and Health Survey within the Ministry, includes asthma in their research and also makes use of GIS to plan health care provision and grasp the health situation of New Zealanders. The internship placement of the Ministry of Health made it possible to access reliable data and was also a great opportunity to gain experience in the working environment where Health GIS is applied. The internship took place from October to December in 2011. To understand the principles of the disease asthma and in particular in New Zealand this paper introduces the components – the disease asthma and the study area - of the topic under the chapter “Background” (chapter 2) which covers general information about asthma (chapter 2.1), followed by general characteristics of the country New Zealand (2.2). Subsequently the chapter about Background information finishes of with more detailed information about the situation of asthma in New Zealand based on literature review (2.3). In the subsequent chapter 3, the data (3.1) and methods (3.2) are described. The data is built up from spatial and administrative data of New Zealand, the dependent variable prevalence of “medicated asthma” as well as explanatory variables used to approach the justification of spatial distribution of asthma. Medicated asthma (used for the years 2009/10) is an indicator, established by Craig Wright from the Ministry of Health (HDI Department) that includes ICD codes for both J45 and J46 in any national health collection (NMDS, MHNC, PMHD, Pharmbase, Socrates) and/or 3 or more dispensing for specific anti-asthmatic drugs (inhalers) per year in Pharmbase, over a 10 year look back period, who are still alive in 2009/10. Methods include the literature review and necessary data collection/preparation, simple disease mapping and finally the actual spatial analysis approach through Regression and correlation analysis. The results are presented under chapter 4, followed by the conclusion and discussion(chapter 5) about the outputs and findings as well as profits and limitation of this analysis.
3
1.1 Motivation for this study
The motivation for choosing this topic for the Master Thesis comes from a personal interest in health topics. Asthma in particular seems to be a disease that has multiple possible influencing factors of both physical and human geography alike. Even though many researchers and institutions are trying to fully understand the reasons for asthma distribution, there are still gaps, which might be revealed with the use of GIS. With the use of spatial analysis methods, it is possible to combine the spatial data and variables with asthma rates per area in order to make conclusions on which factors actually are responsible for the high asthma rate in New Zealand. Furthermore the mapping of asthma rates and possible risk factors as location of highways for example allows conclusions. The high prevalence of asthma is not only a burden for individuals that are affected by asthma, but also for the health care system, since the economic costs of asthma add up to more than 800 million New Zealand Dollar per year (Holt & Beasley, 2001). Considering the burden for asthmatics and the economy of New Zealand there is a high need in finding solutions to lower the rate of asthma, which primarily can be done by identifying specific causes for asthma in New Zealand. Using GIS to examine the distribution of asthma within New Zealand and linking the rate with factors that can provoke asthma is a potential method to bring the prime reasons of increased asthma prevalence to light. This work aims to find significant correlation of selected variables with high or low asthma appearance.
4
2.Background
2.1 Asthma2.1.1 Principles of asthma
The term asthma stands for an inflammation which occurs in the respiratory tract. This inflammation leads to a swelling and causes the mucous membrane to secrete phlegm. Meanwhile the muscles are contracted which is accompanied by a narrowing of the respiratory system. As a consequence the affected person will have difficulties breathing. As the inflammation, and not the narrowing of the bronchus, is the primary problem, anti-inflammatory medicine is given to asthmatics, when suffering an attack (Simon, 1998). There are two main forms of asthma: the allergic and non-allergic asthma. Allergic asthma, which is also known as atopic or extrinsic asthma, is caused by the exposure to allergens. The sensitization to atopic asthma often takes place during childhood and early adolescence. Meanwhile non-allergic (non-atopic or intrinsic) asthma is more common within patients older than 40 years. Intrinsic asthma is often provoked after a respiratory infection (Kroegel, 2002).
2.1.2 Global burden of asthma
Asthma is a very common chronic disease in both western industrialized countries and underdeveloped countries. The prevalence has increased all over the world during the last 40 years with an increase of about 50% per decade (Braman, 2006). Hospital admissions and the rate of severe asthma are especially high in young children. It is estimated that approximately 300 million people currently have asthma. About 180,000 persons die each year as a consequence of asthma. While asthma used to be a disease that was mostly common in developed countries only, there has been a sharp increase in underdeveloped countries as well, supposedly due to their increasing industrialization.
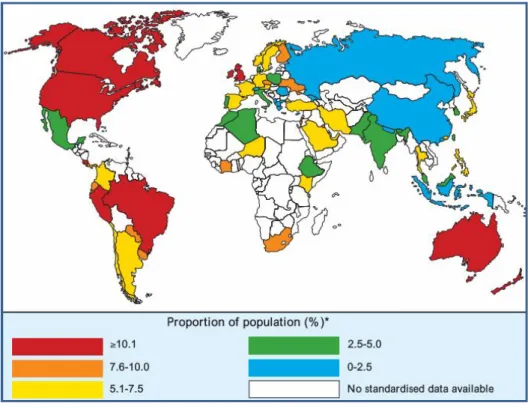
The high prevalence of asthma results in major financial costs for the health-care systems. In Europe alone, the economic burden of asthma is approximately 17,7 billion Euros per annum. Figure 1 illustrates the global distribution of asthma by showing the proportion of the population suffering from clinical asthma (Masoli et al., 2004). As Asthma is difficult to determine, as there is no standard test, Masoli explains that in this report he uses “an arbitrary figure of 50% of the prevalence of "current wheezing" in children (self- reported wheezing in
5
the previous 12-month period in 13- to 14-year- old children)” to determine the “prevalence of clinical asthma” (Masoli et al., 2004). The map shows that the highest percentage (over 10%) is in Canada and the U.S. (North America), Brazil, Peru and Costa Rica (Latin America), in the U.K. (Europe) and both Australia and New Zealand. It has to be noted that no standardized data is available for most countries of Africa. Some gaps also appear in Latin America and Asia.
Figure 1 - World map of prevalence of clinical asthma Source: Global Burden Report of Asthma, Masoli, et al. (2004).
2.1.3 Common causes for asthma
Asthma affects people throughout the world of industrialized as well as non-industrialized countries, upper and lower classes and both population living in cities and on the countryside. Nevertheless there still is some geographical variation (see chapter 2.1.2) as well as temporal differences which give indication of possible causes for asthma. According to Magzamen (2007) physical space is a main factor that influences the disease of asthma. Past studies have shown that there is a diverse range of triggers, whereas a lot of them are only assumptions at this point since it is difficult to give full evidence. The environment, where the individuals spend much time especially in the early years of their life is of high influence for atopic
6
asthma (Epton, 2007). The most acknowledged causes are presented on the following pages in more detail.
Air pollution
Air pollution is well known to affect the respiratory tract and thus it is also one of the main suspects to provoke asthma. There are several different air pollutants that may play a role. Nitrogen Dioxide (NO2) is a problem in terms of asthma and respiratory diseases because it
“increases the cell membrane permeability, decreases ciliary beat frequency and increases the response of asthmatics to inhaled allergens” (Ferguson, 2004). In the outdoor environment a high NO2 concentration is often caused by traffic. Ferguson (2004) states that almost 50% of
NO2 come from car and diesel exhaust fumes. Other sources of NO2 are power stations and
industries (Burr, 1995). Indoors NO2 is emitted from unflued gas heaters and cookers.
Therefore, households that use gas stoves and heaters have usually higher NO2 indoor levels
than homes using electric sources (Gillespie-Bennett et al., 2011). According to the Ministry of Health Report (New Zealand) on asthma, from 1996, NO2 is a pollutant that irritates the
respiratory system in general but effects asthmatics and non-asthmatics equally. Several studies could however relate high NO2 concentration with asthma (Ferguson, 2004; Shima &
Adachi, 2000).
Furthermore Sulphur Dioxide (SO2) is another air pollutant that has been brought into relation
with a high asthma rate. SO2 arises when fossils like coal and oil are burned, but for example
also from power stations (Burr, 1995). SO2 levels are also increased at areas with geothermal
activities (Ministry of Health, 1996). Besides at geothermal bores also the gas Hydrogen Sulfide (H2S) is emitted. Especially during foggy days, H2S remains in the area and within a
lower altitude where it can harm the human health, among others the respiratory tract (http://www.osh.dol.govt.nz/order/catalogue/hydrogensulphide.shtml). Durand & Wilson (2006) examine the effects of geothermal energy to respiratory health in New Zealand (in the Rotorua and Taupo area) and find a higher risk for noninfectious respiratory disease within humans living within the geothermal area. In general H2S is considered as acutely toxic and
may even be fatal when the concentration is over 200 parts per million (Durand & Wilson, 2006). The Agency for Toxic Substances and Disease Registry also counts landfills to the sources of Hydrogen Sulfide (www.atsdr.cdc.gov). Other pollutants that have an impact on asthma are O3 (Ho, 2007), NOx (Ferguson, 2004), CO and CO2, which are highly produced by
7 Allergens
Dust mites are a prime allergen for asthmatics. Their survival requires a humid (over 50%) and cool environment. As a consequence house dust mites are more likely to be present in humid and coastal areas but at the same time there is an increase of house dust mites during the winter as well. Since higher air temperatures are dehydrating, mites favour a temperature of around 25 ºC as an optimum (lifecycle requires one month). If the temperature is 15 ºC, the lifecycle will take much longer than at 25 ºC, but more mites will be able to complete their lifecycle and survive compared to when the temperatures are at 25 ºC. For the indoor environment, home heating is not only of importance regarding the emissions as mentioned previously, but also a determinant due to its effect on the survival of house dust mites. Poor heating and bad ventilation are in favour of house dust mites and enable them to reproduce and survive (Ministry of Health, 1996). The type and quality of home heating also determines mould growth which is another major allergen for asthma (Webb, 2010). Multiple studies have been able to prove the association of both sensitisation and severity of asthma (Wilson, 2007) through mould. Wickens et al. (1997) observed, in a study about dust mites in Wellington (New Zealand), that the number of children per household and the number of persons sharing a bedroom significantly influenced the presence of dust mites levels. Apart from dust mites also grass pollen are an important suspect when it comes to sensitization of asthma and provoking an actual attack (Sears et al., 1989). On the other hand, Mutius et al. (1994), according to of Ministry of Health (1996), found a negative relationship between higher prevalence of asthma and number of children. It is speculated that this may be due to the more frequent viral exposure during early childhood with more siblings which lowers the Immunoglobulin E production. As the Asthma and Allergy Foundation of America informs IgE plays an important role with allergic diseases, as the antibody connects with the allergen and causes a release of substances from the mast cells. As a result the inflammation and allergic reaction can be triggered (http://www.aafa.org/display.cfm?id=8&sub=16&cont=54). A reduced IgE production (in this case as a result of increased viral exposure during early childhood) therefore can affect the prevalence of asthma for people that grew up with more siblings compared to an only child.
Climate
Climatic factors can affect asthma symptoms not only directly but also indirectly; Hales & Lewis et al. (1998) studied the correlation of climate with prevalence of asthma for 1993 and found that warmer average temperatures were linked with higher prevalence of asthma,
8
possibly due to higher level of allergen exposure. They also found that higher variability of relative humidity goes along with lower asthma prevalence (linear trend). At the same time a relationship between low asthma rates in areas with low mean temperature, high rainfall and a high variability of these factors was observed (Hales & Lewis et al., 1998). Rainfall on the other hand may also increase probability of asthma due to higher occurrence of mould (http://www.idph.state.il.us/public/hb/hbasthma.htm), and must be seen critical when trivialized. Considering elevation, Hales & Lewis et al. (1998) observed lower asthma rates in higher altitudes. Furthermore, according to the Illinois Department of Health, wind can aggravate asthma as well, since it increases the distribution of pollen and other allergens (http://www.idph.state.il.us/public/hb/hbasthma.htm).
Housing
Next to type of heating/cooking, which is mentioned under the point “Air pollution” and “Allergens”, the number of bedrooms has also been observed as having an impact on asthma (as already noted under the point “Allergens”). A national telephone survey for New Zealand, carried out through Howden-Chapman et al. (2005) (according to Wilson et al., 2007) found out that a higher number of bedrooms (more than 3) is accompanied by an increased risk of asthma. This observation is justified by an increased probability for mould - one of the major allergens for asthmatics. Also Wickens et al. (1997) found that having 3 or more children per household is associated with higher dust mite level (in this case tested for D. pteronyssinus – the most common mite in Wellington, New Zealand). The same appears for households with 5 or more people and with 1 or more people sharing a bedroom (Wickes et al., 1997). In this study Wickens et al. (1997) also found, that the type of mattress had a major influence on the concentration of D. pteronyssinus.
Lifestyle
Last but not least lifestyle has an impact on asthma as well. Often discussed is the use of tobacco, which contains Formaldehyde. It is proven that tobacco irritates the airway systems, but it is not clear yet, whether the use of tobacco actually sensitizes persons for being asthmatic (Ministry of Health, 1996). However it is a fact, that tobacco increases the IgE serum concentration, so it can lead to a higher sensibility to allergens in general and thus also for allergens that provoke asthma (Shaw et al., 1990).
Additionally the diet plays a role. The consumption of unpasteurized milk during childhood increases the overall sensibility to allergens (Wickens, 2002). When trying to explain the rise
9
of asthma during the last decades an assumption is that the reduced intake of fruit and vegetables causes a lack of Vitamin C, beta-carotene and other antioxidants which leads to an “oxygen radical airway inflammation” (Ministry of Health, 1996). Simultaneously there is an increased exposure to radicals (like tobacco or air pollution) nowadays.
The wide range of possible trigger for asthma, and yet a partially unresolved scientific prove for some of them make it difficult to fully understand the causes for geographical variation of asthma throughout the planet. Certainly it is a complex combination of circumstances, of which some are difficult to measure and grasp.
Masoli (2004) points out that the currently known causes for asthma do not fully explain the international spatial distribution of asthma. The Global Initiative for Asthma therefore counts research into causation of asthma as one of the prime research priorities in asthma research.
10
2.2 The area under investigation: New Zealand
This chapter introduces the study area New Zealand as a whole with a focus on the Auckland region in particular as well.
2.2.1 Study Area
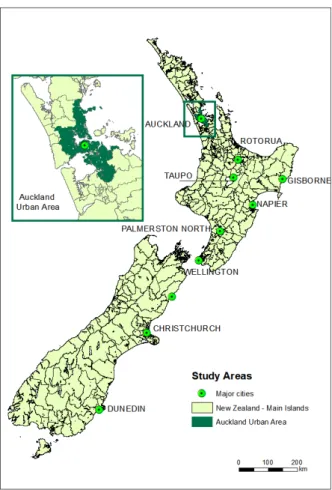
The purpose of this study is to identify risk factors for asthma in New Zealand. However a more detailed scale analysis is applied as well to be able to grasp triggers more easily (Figure 2). This allows taking a closer look on observations and characteristics of the area. The urban area of Auckland was chosen for the regional analysis, since it is the most populated city and region of New Zealand. Also Auckland is known for higher pollution than other parts of New Zealand. Only for the mapping of geothermal bores the area of the Taupo Volcanic Zone is subject of detailed investigations as well.
As a suitable unit for the analysis Census Area Units are selected. This is because even on a higher scale analysis Meshblocks tend to be too small (due to their irregular population size). The varying number of people per Meshblock can cause bias, for example when a Meshblock has only two inhabitants and, possible by coincidence, both persons of them are asthmatics, a rate of 100% occurs. However this rate may not be representative and appropriate. Apart from that, even on the scale of a city, the maps lose their overview and some unit cannot be seen clearly.
11
Figure 2 - The Study Area: location of Auckland sub region in New Zealand
2.2.2 Location and administrative divisions
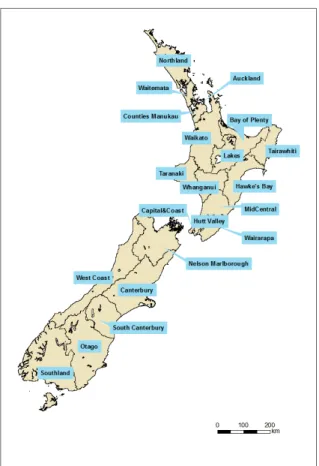
New Zealand covers an area of 263,830 km² with a total extension of 1500 km from North to South. The latitudinal range goes from 34°09´to 47°17´ (Wardle 1991). The country is divided into 14 regional councils. However, in terms of Health Care, the Ministry of Health also distinguishes amongst 20 District Health Boards (DHB) as major administrative boundaries. All the funding and providing of health services is done and organized by the DHBs for their district. Only a few disability support and health services are administrated nationally (by the Ministry of Health) (http://www.health.govt.nz/new-zealand-health-system/key-health-sector-organisations-and-people/district-health-boards). For the main part, it is the DHBs that are responsible for providing or funding the provision of health services in their district. Figure 3 shows the map of the DHBs of the main islands of New Zealand.
12
Figure 3 - District Health Boards in New Zealand
Official geographic areas (without the context of health) are Regional Councils, Territorial Authorities, Census Area Units and Meshblocks. The smallest geographical unit, for which official statistical data is collected, is Meshblocks. There are 39,300 Meshblocks with an average population of 110 inhabitants. Census Area Units are an aggregation of Meshblocks of which there are 1,927 (1,777 on the 2 Main Islands) in New Zealand with a median population of 2000 (in the year of 2009). However, within the urban areas the population ranges between 3000 and 5000 habitants (with exceptions to units with for example industrial areas or port areas) (www.stats.govt.nz).
2.2.3 Population
In 2011 there are approximately 4,36 million people living in New Zealand of which 76,8% are of European descendants, 14,9% Maori, 9,7% Asians, 7,2% other Polynesian Pacific Islanders and 0,9% are Middle Eastern, Latin Americans and Africans (MELAA). Some people identified themselves as part of more than one ethnic group (www.state.gov). The ethnic composition per District Health Board can be seen in Figure 4. Most DHBs have a
13
majority of Europeans inhabitants. A majority of Maori can only be found in the North East of the North Island. Besides the Maori proportion is also fairly high in Northland, Taranaki, the Lakes and Hawke´s Bay. The highest proportion of Asians is in Counties Mankuau, Auckland and Waitemata on the North Island. On the South Island Europeans are consistently dominating in all DHBs. The map is based on the Census data from 2006.
Figure 4 – Ethnic composition in percent per District Health Board in New Zealand
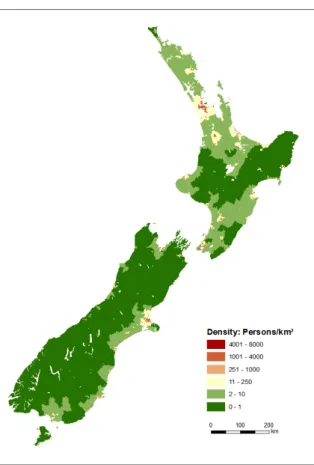
Most New Zealanders (nearly 76%) live on the North Island and about 85% of the population lives in urban areas (www.state.gov). The most populated city is Auckland (1,354,000 habitants) followed by the capital Wellington (389,700) and Christchurch (390,300) in June 2010 (OECD, 2011). Figure 5 shows the density of New Zealand´s population. What can be seen is that most parts have a low density and in particular in the South Island the majority has less than 1 inhabitant per km². Only the urban areas have a more dense population and in Auckland it rises up to nearly 8000 inhabitants per km². The data from the map comes from the New Zealand Census from the year 2006.
14
Figure 5 – Population density of New Zealand (persons/km²) in 2006
2.2.4 Economy
The primary and secondary sectors make up about 30% of the Gross Domestic Product (GDP), whereas the majority of the GDP and employment is provided within the tertiary sector. Dairy, sheep and beef farming as well as forestry and fishing are the major income sources within the primary sector, closely related to the secondary industry, which mainly consists of processing these primary products, in addition to machinery/equipment manufacturing and aluminum/steel enterprises. Within the tertiary sector the dominant fields are finance, insurance, property services, transport, education/building and retail (http://www.teara.govt.nz/en/industrial-sectors/1).
2.2.5 Physical Environment
The two main islands (North and South Island) are separated by the Cook Strait and surrounded by the Pacific Ocean (Tasman Sea on the west).
15
2.2.5.1 Relief
The landscape is characterized by mountainous regions on both islands (Wardle 1991). As Figure 6 reveals, especially on the South Island the mountains are quite dominant and are up to 3700 meters high. The coastal areas are relatively flat. The North Island is in general less elevated, with exception to the central part around Lake Taupo and the region from Taupo to the North East. The data for this map comes from the website www.koordinates.com (DEM 80m) and has been published by Ollivier & Co (License: Creative Commons Attribution 3.0).
Figure 6 – Elevation of New Zealand
The location at the boundary of the Pacific and Indo-Australian tectonic plates is responsible for this mountainous terrain and also leads to earthquakes as well as volcanic and geothermal
activity
(http://www.mfe.govt.nz/publications/ser/enz07-dec07/html/chapter2-environment/page2.html). The geothermal areas are situated in the centre of the North Island. The city Rotorua is built on an active geothermal field. Several geothermal bores are located in the vicinity, which cause the emission of the gas Hydrogen Sulfide H2S, which can lead to
16
near fumaroles” (Durand & Wilson, 2006). These geothermal areas also have an increased SO2 concentration (Ministry of Health, 1996).
2.2.5.2 Climate
Due to its location, New Zealand is heavily influenced by the ocean which also results in sudden weather changes in particular throughout the spring (September to November). This appears especially where the land is quite narrow and bordering to both oceans, such as Wellington. In general New Zealand has a temperate (in the South) to a subtropical climate (in the North) (www.state.gov).
Temperature
According to the Food and Agriculture Organization of the United Nations (www.fao.org/ag/AGP/AGPC/doc/Counprof/newzealand/newzealand1.htm) the mean air temperatures varies throughout the year, whereas the influence from the ocean moderates the temperature. Overall, the temperature increases from the South to the North. The far north of the North Island has a mean annual temperature of up to 16°C, but most areas of the North Island have an annual mean of 10 to 14°C (see Figure 7). On the South Island the mean annual temperature overall is 8-10°C, but the mountain areas are much colder and partially have only 2,5°C as annual mean. Temperature decreases not only from North to South by latitude but also with altitude in the mountainous regions. As the subchapter Relief (2.2.5.1) has shown, the South Island is characterized by areas of high altitude. This of course is apart from the latitude, one of the main influencing factors to the temperature and explains the difference between mean annual temperatures in the North and South Island. At the coast of the North Island there is no frost, but towards the inland frost occurs during the winter months, especially on the central plateau. Snow rarely falls below 600 m on the North Island. The South Island being in general colder than the North Island has snow reaching down to 300 m above sea level. As GIS data only mean temperature data for the years 1950 to 1980 was available through the LENZ dataset (which is further described under chapter 3.1.2.1). Figure 7 represents the mean annual temperature in °C, while Figure 8 illustrates the mean minimum temperature for the coldest month.
17
The sunshine hours are lowest on the south and west coast of the South Island (90-1400 hours per year) and are highest in the northwest of the North Island and the most northern parts of the South Island. The map (Figure 9) is taken from the website of the National Institute of Water and Atmospheric Research (NIWA) (www.niwa.co.nz).
Figure 7 - New Zealand Mean Annual Temperature (°C), 1950-1980
Figure 8 - New Zealand Mean Minimum
18
Figure 9 - New Zealand Mean Annual Sunshine Hours, 1971 - 2000 Source: http://www.niwa.co.nz/education-and-training/schools/resources/climate/overview
Rainfall
The mountains, especially on the South Island establish a characteristic pattern of the rainfall, which is high on the west coast due to westerly winds and decreases towards the east coast of the South Island (see Figure 10). Thus the minimum annual rainfall varies from only 300 mm per year in the east in Central Otago to over 8000 mm in the Southern Alps (http://www.metservice.com/learning/nz-climate). Apart from those extremes the rainfall ranges between 600 to 1500 mm in most parts of the country.
Furthermore the amount of rain varies throughout the year. Partially (in the north) the rainfall is twice as high during the winter than during the summer. Only in the southern half of the South Island there is a dominance of summer rainfall, whereas the rest of New Zealand`s
mainland has a dominance of winter rainfall
(www.fao.org/ag/AGP/AGPC/doc/Counprof/newzealand/newzealand1.htm). Most parts of the North Island have rainfall of at least 1,0 mm at a minimum of 130 days out of the year. The driest areas of the North Island are situated on the east with less than 113 days of rainfall. In comparison the driest parts of South Island have an average of 80 rain days per year. However the very southeast (Fjordland) reaches over 200 days of rain per year
19
(http://www.metservice.com/learning/nz-climate). Figure 10 is a map of the annual rainfall representing the means for the years 1971-2000. The data for the map is from the National Institute of Water and Atmospheric Research (NIWA).
Figure 10 - New Zealand Mean Annual Rainfall (mm), 1971 - 2000
Humidity
In most parts the mean relative humidity lies between 65 to 85%. In the lee of the Southern Alps the relative humidity ranges only from 5 to 30%.
Wind
The wind is mostly coming from the west and causes the previously mentioned higher rainfall on the west coast (www.metservice.com). North of Taranaki the wind is predominantly south westerly. While in the North Island lowest wind speeds occur during summer/early autumn, the South Island has its lowest wind speeds during winter (July/August). In Wellington in particular wind speeds are typically quite high with an average of 173 days of gust (> 60 km/h) per year. Rotorua, in the center of the North Island for example only has 30 days of gust and Nelson, which is on the northern tip of the South Island, has an average of 35 days
20
per year (www.metservice.com). The majority of the coast has predominant sea breezes during the summer.
2.2.5.3 Vegetation
The predominant vegetation in New Zealand is exotic grassland. In the past, the North Island was covered primarily by indigenous forests – the South Island by forest and tussock. However today these can be mainly found on the west coast (South Island) and the central hilly and mountainous parts of the North Island (http://www.teara.govt.nz/en/soils-and-regional-land-use/1). Because of the heavy rainfall on the west coast of the South Island, rainforest can be found on the western side of the mountains (www.metservice.com). Figure 11 is a map that was created with data from a dataset (Land Cover Database) from the
Ministry for the Environment which is available online free of charge
(www.koordinates.com). The map shows the 8 main land cover classes. More detailed information about this dataset can be found in chapter 3.1.2.1 “Environmental Variables”, as the land cover also serves as independent variable for the analysis. The map show that especially on the North Island grassland is the most dominant land cover class, with a higher dominance of forests east/north east of Lake Taupo in the center. On the west coast of the South Island forest is the predominant land cover. The mountainous central area of the South Island is barely or lightly vegetated in the high altitudes and further east grass land is mostly prevalent.
21
Figure 11 - Land cover classes of New Zealand
2.2.5.4 Air Quality
Overall New Zealand is considered to have low air pollution in most parts of the country. The Ministry for the Environment of New Zealand also confirms that at most locations the air quality is good in New Zealand. Nevertheless Auckland (mainly through traffic and heating) and Christchurch (mainly through industrial emissions) are both an exception of the general picture (Scoggins et al., 2001). Besides, emissions became higher over the last 20 years. The emissions of CO2 for instance have increased by 44,9% (OECD, 2011). Because of the use of
coal and wood for home heating and also the emissions from transportation some parts are affected by air pollution. About 30 locations are found within New Zealand where the air quality is affected by high emissions, in which roughly 53% of the population lives (http://www.mfe.govt.nz/publications/ser/enz07-dec07/html/chapter7-air/). In general the air pollution is worse during the winter months, partially because of heating with coal and wood (PM10 particulates are emitted). Auckland is in particular affected by high PM10 emissions
22
Figure 12 - PM10 emissions at New Zealand´s main population centers
Source: http://www.mfe.govt.nz/publications/ser/enz07-dec07/html/chapter7-air/figure-7-6.html
The levels of SO2 are low in most countries and have been decreasing since the 1980s. The
Ministry for the Environment points out, that the areas around the Marsden Point Oil Refinery, situated in Whanagrei (Northland) are an exception to the general picture
(http://www.mfe.govt.nz/publications/ser/enz07-dec07/html/chapter7-air/index.html). As
previously mentioned also the areas in the vicinity of geothermal bores (found in the center of the North Island) are affected by an increased SO2 concentration. As New Zealand has
geothermal activity, a focus has to be put on the occurrence of H2S as well. As mentioned
earlier, in particular the centre of the North Island around Taupo (Volcanic Zone Taupo) and Rotorua are areas where high geothermal activity occurs and where geothermal energy is used. Studies have focused in particular on the health effects due to H2S levels in this area
(Durand & Wilson, 2006 and Hinz, 2011).
Especially the Auckland region (home to 1/3rd of New Zealand´s population) registers high levels of PM10 due to high traffic and in winter time due to heating with coal and wood.
Because of the intense traffic, Auckland also builds an exception to the overall countrywide
acceptable levels of NO2
23
Figure 13 - NO2 emissions in New Zealand´s main population centers
Source: http://www.mfe.govt.nz/publications/ser/enz07-dec07/html/chapter7-air/figure-7-8.html
Sulphur dioxide levels declined since the 1970s and 80s, since coal and heavy fuel oils were used less and less in Auckland. Only in the 1990s a minor increase took place because of
imported diesel vehicles
24
2.3 Asthma in New Zealand – Literature Review
In the 19th century New Zealand went through two drug-induced mortality epidemics. The first epidemic was in the 1960s, in which the death rates increased drastically. The reason for this increased asthma mortality is most likely the use of the beta-agonist aerosol “isoprenaline forte” (Holt & Beasley, 2001). A second mortality in the 1970s was brought into context with the use of another drug “fenoterol”, which had heavy side effects. The death rate was around 4,0 per 100,000 during the late 1970s (Crane et al., 1992). Once feonterol was restricted the death rates decreased markedly (Ministry of Maori Affairs 1991).
After the last mortality epidemic of asthma in the second half of the 19th century the death rates of asthma in New Zealand have remained low at around 0,5 per 100,000 (Holt & Beasley, 2001). Nevertheless, asthma prevalence in general is rising constantly and brings up the question what reasons cause the increase of the asthmatic population. Even though generally speaking New Zealand has a high rate of asthma, there are some major differences between geographical regions and also between social statuses.
Age and gender
The rate of asthma in New Zealand varies between age groups and gender. During childhood, asthma is more common for boys compared to girls (Wickens et al., 2001). During adulthood however more women than men tend to have asthmatic symptoms (Ministry of Health, 1996). The report of the Ministry of Health New Zealand about the National Health Survey of 1996/7 (Ministry of Health, 1999) states that within the age group of 15-44 the total rate of probable asthma is 15,5%. The rate for men is 12,9% while women have a rate of 18,0%. Kimbell-Dunn et al. (2000) also states that hospitalization rates decrease for males with age, whereas females show increased asthma prevalence between 15-44. Also death rates were higher for the period of this study (1976-1995) for women aged 15 and older.
This observation is quite typical for other countries as well. It is common that during childhood boys tend to have more asthma while during adulthood the pattern is reverse. At the same time there is an often observed decrease of asthma as of puberty. The reason for both disparities of asthma rate for female/male during childhood/adulthood and the abate of asthma during puberty are not clear yet (Nicolai et al., 2001).
25 Ethnicity
Various studies and also statistics from the past have shown an inequality of asthma among ethnicity in New Zealand (Wickens et al., 1998; Mitchell, 1991; according to Ministry of Health, 1999). According to Holt & Beasley (2001), Maori and Pacific Islanders are more affected than Europeans and Asians. In 1996/7 18,6% of Maoris compared to 15,6% of Europeans are asthmatics. The highest rate in 1996/7 was observed for Maori women from age 15 to 44 (20%) (Ministry of Health, 1999). Ponmare et al. (1992; according to Ministry of Health, 1999) also reported that Maori children seem to have more severe asthma compared to non-Maori children, possibly due to lifestyle such as exposure to tobacco smoke and allergens and at the same time “poorer access to health services and preventive medications” (Ponmare
et al., 1992, according to Ministry of Health, 1999).
Social Status
Furthermore a significant relationship between family income and rate of probable asthma is apparent. The National Health Survey of 1996/7 shows that the highest rate of probable asthma occurs for persons who live in families with less than 20,000 NZD (21,8%). For both 20,000 to 30,000 and 30,000 to 50,000 the rate is at 15,8%, whereas family members with an income of 50,000 NZD have the lowest rate of 13,5% (Ministry of Health, 1999). This might be plausible due to worse living conditions, less consumption of fruit and vegetables and an insufficient access to health care. The New Zealand Deprivation Index, ranging from 1 to 10 with 10 being the most deprived area and 1 being least deprived, has also shown that high asthma prevalence is more likely in the most deprived areas of New Zealand (Salmond, 1998). The Index is composed of several variables that indicate the state of wealth and deprivation. The attributes included are income, owned home, support for elderly people, employment, qualification, living space, communication (access to telephone) and transport (possession and access to a car) (Salmond et al., 2007). An indirect relation to why lower socio-economic families suffer more often of asthma can be through higher dust mite levels in households (Sears et al., 1989). At the same time, the education level seems to influence the prevalence of asthma in New Zealand. The rate among people with no qualification is 17,2% whereas the rate of asthma in people having post-school education is only 14,4% (Ministry of Health, 1999). An indirect influence of the level of qualification on prevalence of asthma could be that people with higher education often have a better economic situation. The more favourable economic situation enables better living conditions.