AN ANALYSIS PATTERN FOR MOBILE GEOGRAPHIC
INFORMATION SYSTEMS TOWARD MUNICIPAL URBAN
ADMINISTRATION
Bruno Rabello Monteiro, Jugurta Lisboa Filho, José Luís Braga, Waister Silva Martins
Departamento de Informática, Universidade Federal de Viçosa (UFV), Viçosa – MG, Brazil[email protected], [email protected], [email protected], [email protected]
Keywords: Analysis Pattern, Mobile Geographic Information Systems, Urban Administration.
Abstract: This paper introduces an analysis pattern for Mobile Geographic Information Systems (Mobile GIS) focused on urban administration applications. This pattern provides a class and associations diagram and can be used in the development of an urban Mobile GIS application. The paper also describes a process that guided us in obtaining this analysis pattern, presenting an example of its use in the conceptual modeling of an actual application.
1 INTRODUCTION
In Brazil, many municipal public administrations have been using Geographic Information Systems (GIS) technologies both as supporting tools for decision-making and for operational activities.
With the recent rise of mobile computation, a new type of GIS has appeared, enabling the access to spatial data from any place and at any time: the Mobile Geographic Information Systems, or simply Mobile GIS. The Mobile GIS applications allow broad use and sharing GIS technologies with the public (Xiaoqing & Qingquan, 2005).
According to (Tsou, 2004), Mobile GIS is an integrated hardware-software framework to access services and geo-spatial data using mobile devices via cable or wireless networks. In addition, a Mobile GIS application is not equivalent to a conventional GIS application modified to operate in a smaller device: they are systems based on a new paradigm (Maguire, 2001). This new paradigm implies, among other things, considering non-functional requirements like the limited bandwidth of the wireless communication network, the low processing and storage power of the mobile devices when compared to the usual desktop computers and
the differences in the screen size and properties to display maps and results.
However, as it also happens in developing GIS applications, the success of Mobile GIS applications depends heavily on the extraction, analysis and representation of requirements from the domain. Lisboa Filho et al. (2002) pointed out that the disciplines to be followed in requirement analysis and database conceptual design are complex activities that demand long working hours.
Patterns in general are one way of avoiding effort repetition, and database conceptual design can be greatly favored by using analysis patterns.
Analysis patterns are used to describe solutions adopted during the steps of requirement analysis and data conceptual modeling. Fowler (1997) argued that an analysis pattern is an idea that has been proven useful in a practical context and it will probably be useful in other similar situations. In addition, (Lisboa Filho et al., 2002) pointed out that
in the urban administration domain the basic environment that makes up the digital cartographic basis (e.g.: streets, blocks, plots and districts) can be reused by several different applications.
domain. Section 2 describes the UML-GeoFrame approach used in the conceptual modeling of Mobile GIS applications and in the presentation of the proposed solution for the proposed pattern. Section 3 presents the step-by-step modeling of a Mobile GIS application for the urban administration domain. Section 4 describes the analysis patterns we propose for these applications. Section 5 presents the use of the proposed analysis pattern. Finally, Section 6 presents the final conclusions and prospects of future developments.
2 THE UML-GEOFRAME
MODELING METHOD
GeoFrame is a specified conceptual framework based on the class model of the Unified Modeling Language (UML), which serves as a guide for modeling GIS applications. GeoFrame provides a basic class diagram to assist the designer in the initial steps of the database conceptual modeling of a new GIS application. It also provides a stereotype set (Figure 1) that allows obtaining data schemes easily understandable by users (Lisboa Filho & Iochpe, 2008).
Figure 1: Stereotypes for the UML-GeoFrame model
In Figure 1, the first three stereotypes to the left, are used to differentiate the main types of objects belonging to database of geographic applications: geographic object []; geographic field [] and non-geographic object [].
The two other stereotype sets are used for modeling of spatial components of geographic phenomena. The set located at the center represents the spatial component of geographic phenomena, according to the object view, and the set more to the right represents the geographic phenomena according to the field view. It is also possible to generate several representations by combining stereotypes. The stereotype <<function>> characterizes a special type of association that occurs in a categorical function modeling, whereas
the stereotypes Instant [] and Interval [] are used for temporal aspects modeling.
The UML-GeoFrame method consists of the following 5 steps. More details on each step can be found in (Lisboa Filho & Iochpe, 2008).
• Step 1: identify themes and sub-themes for each application target region;
• Step 2: draw the class diagram for each identified theme;
• Step 3: model the spatial characteristics of each geographic phenomenon;
• Step 4: specify the integrity constraints for the spatial relationships;
• Step 5: model the temporal aspects.
(Lisboa Filho & Iochpe, 2008) also emphasized that these five steps need not necessarily be followed in this order, some steps can be carried out simultaneously, depending on the designer’s experience. In the next section, we show a modeling example using the UML-GeoFrame method.
3 DATABASE MODELING FOR
URBAN MOBILE GIS
APPLICATIONS
Aiming at determining which geospatial basic dataset is necessary for developing Mobile GIS applications focusing on a specific urban area, the following applications were modeled:
• School cataloguing system; • School location system;
• Hospital and health center cadastre system; • Medical emergency system;
• Traffic sign cadastre system; • Meter reading system.
The applications were modeled using the UML-GeoFrame method, with the ArgoCASEGEO support tool (Lisboa Filho et. al, 2004), an open source CASE tool built upon ArgoUML (ArgoUML, 2007) that supports modeling geographic application databases based on the UML-GeoFrame model.
3.1 Mobile GIS application for Traffic
Accident Reports
This type of application seeks to assist the user in the recording of data on traffic accidents occurred in a town. The functionalities that this application should include are: road network viewing and road circulation traffic network; recording of the accident location in the map; recording of other data related to the accident; searching accident records per street, vehicles, and drivers, among others.
The steps of UML-GeoFrame method are as follows.
Step 1 - Identify the themes and sub-themes for each geographic area.
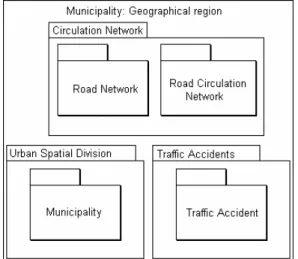
The referred geographic area is the municipality itself. Figure 2 shows the themes and sub-themes of the application, which include: Circulation Network, with the sub-themes Road Network and Road Circulation Network; Urban Spatial Division, including the theme Municipality; and Traffic Accidents, with the sub-theme Traffic Accident.
Figure 2: Step 1 - Themes of the application.
Step 2 - Draw the class diagram for each identified theme and sub-theme and Step 3 - Model the spatial characteristics of each geographic phenomenon.
Figure 3 shows the result of steps 2 and 3, containing the class diagram of the modeled geographic phenomena. The spatial characteristics
were also modeled according to the stereotypes present in the UML-GeoFrame approach.
Data on traffic accident, required for the application, were defined based upon the instruction manual "Basic Instruction of Traffic Statistics" (FGV, 2001), together with the document “Basic Concepts and Definitions”, from the “Detran Traffic Accident Information System” (DETRAN/DF, 1989). The modeling of the Road Circulation Network was carried out based on an analysis pattern described by (Lisboa Filho et al., 2002).
Following, we present a description of each class of the diagram showed in Figure 3.
The Municipality class has spatial representation in the form of a polygon [] and is composed by one or more Administrative Departments.
The Administrative Departments class is specialized in the classes Districts and Neighborhoods that have spatial representation in the form of polygons [].
A thoroughfare is considered a non-geographic object []. It is composed by several thoroughfare segments modeled as geographic objects of the type line [].
The classes Thoroughfare, Thoroughfare Segment and Intersection represent the road network of the city.
Road Circulation Network is composed by the road network and the classes Traffic Flow Section [] and Conversion Point [].
The Accident class was modeled as a geographic object of the type point [], allowing a spatial representation of the accident location. An accident can take place in both a Thoroughfare Segment and an Intersection []; this condition is indicated in the scheme through the restriction XOR (Dietrich & Urban, 2005).
The scheme also indicates that an accident can involve several vehicles, and each vehicle is associated with one single driver. The classes Vehicle and Driver are modeled as non-geographic objects [].
The Victim class [] is specialized in six other subclasses (Driver, Passenger, Pedestrian, Cyclist, Motorcyclist and Others).
Step 4 - Specify the integrity constraints for the spatial relationships and Step 5 - model the temporal aspects.
Accident class has temporal characteristics, indicated by the stereotype Instant [].
Figure 3 - UML-GeoFrame Class Diagram for the Traffic Accidents Report Application
4 THE URBAN MOBILE GIS
BASIS ANALYSIS PATTERN
The analysis of the conceptual diagrams of the Mobile GIS application for Traffic Accidents Report, as well as of the others mentioned in the previous section, have shown classes of common objects. By analyzing these classes, relationships were extracted based on the conceptual schema of each application, and then these elements were organized in the form of an analysis pattern.
Next we introduce the analysis pattern named “Urban Mobile GIS Basis” to be reused in the
development of Mobile GIS applications in the domain of urban areas. The structure used for the presentation of the analysis pattern is the one defined by (Meszaros & Doble, 1998), in which the pattern specification should contain, at least, the following items: Problem-Context-Forces-Participants-Solution.
Pattern Name: Urban Mobile GIS Basis
Problem
What are the data for developing Mobile GIS Applications and how they should be structured?
The development of Mobile GIS applications for urban administration begins with the creation of a minimum cartographic base regarding the structure of the municipality in question. This minimum base can be used by several applications for the most varied areas of a municipal public administration, such as: Education, Health, Public Safety, Transportation, etc. The necessary basic information to those applications is the plan of districts, blocks and plots and the road network of the municipality.
Forces
- The level of granularity of the proposed analysis pattern depends on the existence of spatial data for the municipality being modeled. In this pattern, the highest granularity level is the plot, but it could be a building in the plot, for example.
- The most common types of administrative municipal divisions are neighborhoods and districts. Other subdivisions can be easily included if necessary.
- The concept of neighborhood can vary quite a lot among municipalities. Thus, it is possible that a same block belongs to more than one neighborhood and that the boundary of a neighborhood can even cross a plot.
- The set of administrative divisions, blocks and plots comprise the division of the urban space of a municipality.
- A thoroughfare segment corresponds to the street segment comprised between two intersections. Several segments correspond to a thoroughfare.
- The set formed by the intersections, or terminal points and thoroughfare segments constitute the urban road network.
- The packages Road Network and the Urban Space Division comprise the analysis pattern Urban Mobile GIS Base.
Solution
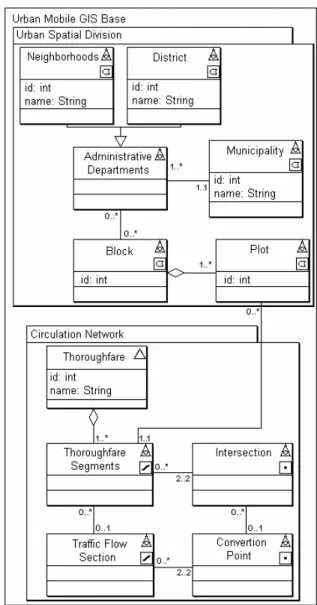
Figure 4 shows the diagram of classes belonging to the Urban Mobile GIS Base pattern.
Participants
The Municipality class is associated with the Administrative Division class through a "one-to-many" multiplicity. In this solution, the Administrative Division class is specialized in the classes Neighborhood and District, but in some cases, it can be specialized in other municipal subdivisions such as: census sectors, police surveillance zones, etc.
The Administrative Division class relates with the Blocks class through a many-to-many cardinality. In this way, it is supposed that a neighborhood boundary (or any other administrative
division) may cross a block. In municipalities where this does not happen, the cardinality can be changed to one-to-many.
The Plot class is associated with the classes Block and Thoroughfare segment. A group of plots make up only one block, whereas a plot has its front access to only one thoroughfare segment.
Several thoroughfare segments are part of a same thoroughfare, here represented by a non-geographic phenomenon. Besides, several thoroughfare segments can be connected by intersections that represent the knots forming the road network.
5 USING THE PROPOSED
ANALYSIS PATTERN
In this section we present the use of the Urban Mobile GIS Base Analysis Pattern in the conceptual modeling of the Pocket-GIS’s database, which is a Mobile GIS application for recording Property Cadastre Bulletins – PCB (Martins et al., 2007). Pocket-GIS was developed by Computer Science Department of Federal University of Viçosa.
The Pocket-GIS system assists users in the data collection for the Property Cadastre Bulletin, using spatial data to improve the identification and location of properties and the urban allotment within the system.
Pocket-GIS’s development was done in two steps. In the first, requirements and use-case identifications was accomplished. In the second step, the Pocket-GIS was codified.
Figure 5 shows the UML use case diagram.
Figure 5: Pocket-GIS Use cases
The systems’ actor is an employee responsible for obtaining the PCB’s data in field. The use cases identified were:
• Register / Update PCB data • Communicate to server
• Visualize descriptive and spatial data • Select data through its geographic view The “Register / Update PCB data” use case allows user to accomplish inclusions and updates to the PCB data onsite. The data are temporarily stored on a PDA (Digital Personal Assistant) for later server update.
Server communication allows actor to download data to the client PDA, and it allows uploading data to the server. While downloading data to the PDA, the user can select which data he wishes, in other
words, he can select which spatial data themes and descriptive data he wants.
The “Visualize descriptive and spatial data” use case allows user to visualize geo-spatial data (Rio Branco-AC City maps) and non-geographic data. The descriptive data visualization was made from an interaction with other system, called Cupuaçu.
Cupuaçu is the first system made through a partnership between the Computer Science department of Federal University of Viçosa and City Hall of Rio Branco-AC. This system aims to help the collection of the PCB descriptive data process using mobile devices as PDAs.
This use case is closely related to “Select data through its geographic view” use case, which allows selecting objects through its spatial representation.
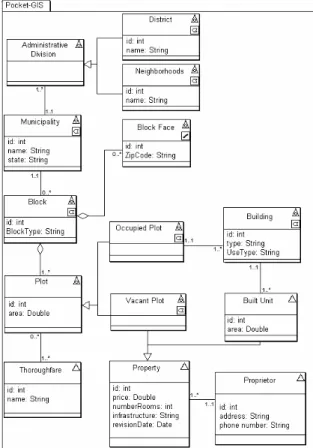
The data conceptual modeling was done by reusing the proposed analysis pattern. Figure 6 illustrates the resulting data conceptual schema. Next, each class is briefly described.
Figure 6 - Conceptual scheme of Pocket-GIS.
- Each Administrative Division is related with the several Blocks, as well as a same Block can be related with several Administrative Divisions.
- Each Block is formed by several Block Faces. These block faces are the lines that form the polygon.
- One or more Plots form a Block.
- Thoroughfare is modeled as a non-geographic object, since only the thoroughfare name is important for the application.
- Each Plot, in its turn, is specialized in Occupied Plot or Vacant Plot.
- An Occupied Plot can have one or more Buildings, which are represented by polygons. A Building, in its turn, is in a single Occupied Plot.
- A Building has a one-to-many relationship with the class Built Unit, which has no spatial representation.
- The classes Built Unit and Vacant Plot are generalized for the class Property, which represents the entity without geographic representation that will store the data related to PCB.
- Last of all, a Proprietor (owner) who does not have geographic representation may have one or several Properties.
The spatial relationships corresponding to Step-Four of the UML-GeoFrame method were not modeled. Only the semantic relationships were considered for modeling this system. As for temporality (step 5), Pocket-GIS has no temporal characteristic.
Pocket-GIS was developed to operate in PDAs that run the Microsoft Windows CE 4.x operational system or above. The mobile device used was a PDA, Jornada HP 220 Pocket PC, 64 MB memory, 400 MHz processor.
The system was developed in C# language. The library used for spatial data visualization was the Map Suite Pocket PC® (Evaluation Edition). The database used in the server was the SQL Server 2000, with SQL Server CE in the client side. All the communication between the client and the server was carried out via Web Services.
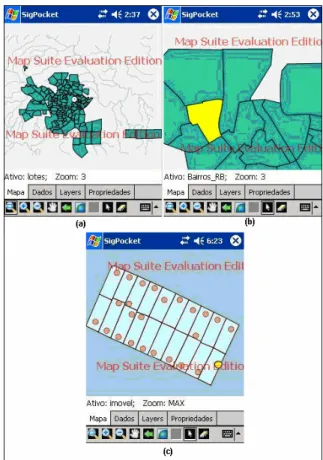
Figure 7 shows (a) the main system interface, (b) the feature selection screen and (c) the Property layer.
Figure 7 - (a) Pocket-GIS Main Interface, (b) Process of neighborhood selection (c) Properties layer.
The interface screen basically contains: a map display area; tabbed browsing, which allows the visualization of some properties and functionalities of the system; and a toolbar for handling maps.
The Pocket-GIS main functions are: - Map display in the shapefile format;
- Map browsing: to zoom in and out of the map, move the map and view browsing history;
- Choice of zoom level, allowing more zoom in and out of the map, for greater or less map detailing;
- Management of active layers;
- Display of descriptive data associated with the shapefile.
6 CONCLUSIONS
Mobile GIS applications focused on urban administration have a great potential for reusing solutions. The proposed analysis pattern can be used in assisting in the development of many applications for the most varied areas that form a municipal public administration.
The development of the Pocket-GIS system made it possible to test the use of the analysis pattern, partly or fully. The use of the analysis pattern reduces the time for the data conceptual modeling, assisting designers by indicating a possible solution in the identification of the kinds of data necessary to the application.
Other applications using the pattern should be developed to allow pattern refinement and enhancement, thus making it possible to test its usefulness in actual applications.
The definition of an analysis pattern for non-urban areas of a municipality is also suggested for further research.
Acknowledgements
This project was partially supported by the Minas Gerais State Foundation for Research Support (FAPEMIG), the National Council for Scientific and Technological Development (CNPq) and the Coordination for Improvement of Personnel of Superior Level (CAPES).
7 REFERENCES
ARGOUML – Disponível em <http://argouml.tigris.org/>. Acesso em: dezembro, 2007.
DETRAN/DF – Conceitos e Definições Básicas. 1989. Disponível em <http://www.detran.df.gov.br /sites/200/240/00000020.pdf> Acesso em: agosto, 2007. (in Portuguese)
Dietrich, S. W.; Urban, S. D. An Advanced Course in Database Systems: Beyond Relational Databases. Arizona: Prentice Hall, 2005.
FGV. Instrução Básica de Estatística de Trânsito. 2001. Disponível em: <http://www.denatran.gov.br/ publicacoes/show_public.asp?cod=9> Acesso em: agosto, 2007. (in Portuguese).
Fowler, M. Analysis Patterns: Reusable Object Models. Menlo Park, CA: Addison Wesley Longman, 1997. Lisboa Filho, J.; Iochpe, C.; Borges, K. A. Analysis
patterns for GIS data schema reuse on urban management applications. CLEI Electronic Journal, v.5, n.2, p.1-15, 2002.
Lisboa Filho, J., Sodré, V.F., Daltio, J., Rodrigues, M.F., Vilela, V. (2004) A CASE tool for geographic database design supporting analysis patterns. Proc. Conceptual Modelling for GIS, ER2004. LNCS 3289. Lisboa Filho, J.; Iochpe, C. Modeling with a UML profile.
In: Shashi Shekhar and Hui Xiong. Encyclopaedia of GIS. Germany: Springer-Verlag, 2008.
Maguire, D. Mobile geographic services come of age: ESRI Drives into Wireless Markets. Geoinformatics, n.4, 2001.
Martins, W. S.; Monteiro, B. R.; Lisboa Filho, J.; ROCHA, M. N. Um SIG Móvel para Aplicações de Gestão Urbana. REIC - Revista Eletrônica de Iniciação Científica, 2007. (in Portuguese)
Meszaros, G. Doble, J. A pattern language for pattern writing. Disponível em: < http://www.hillside.net/ patterns/writing/patternwritingpaper.htm> Acesso em: outubro de 2007.
Monteiro, B. R. Aplicações de Sistemas de Informações Geográficas Móveis: um estudo voltado para iniciativas de governo eletrônico na administração pública municipal. 2007. 106f. Dissertação (Mestrado em Ciência da Computação) – Universidade Federal de Viçosa, Viçosa, MG, 2007. (in Portuguese) Tsou, M. Integrated Mobile GIS and Wireless Internet
Map Servers for Environmental Monitoring and Management. Cartography and Geography Information Science, v. 31, n. 3, p. 153-165, 2004. Xiaoqing, Z.; Qingquan, L. The Deliver and Visualization