EUROPEAN ORGANIZATION FOR NUCLEAR RESEARCH (CERN)
CERN-PH-EP/2012-322 2013/05/01
CMS-TOP-11-013
Measurement of differential top-quark-pair production
cross sections in pp collisions at
√
s
=
7 TeV
The CMS Collaboration
∗Abstract
Normalised differential top-quark-pair production cross sections are measured in pp collisions at a centre-of-mass energy of 7 TeV at the LHC with the CMS detector us-ing data recorded in 2011 correspondus-ing to an integrated luminosity of 5.0 fb−1. The measurements are performed in the lepton+jets decay channels (e+jets and µ+jets) and the dilepton decay channels (e+e−, µ+
µ−, and µ±e∓). The tt differential cross
section is measured as a function of kinematic properties of the final-state charged leptons and jets associated to b quarks, as well as those of the top quarks and the tt system. The data are compared with several predictions from perturbative QCD cal-culations up to approximate next-to-next-to-leading-order precision. No significant deviations from the standard model are observed.
Submitted to the European Physical Journal C
c
2013 CERN for the benefit of the CMS Collaboration. CC-BY-3.0 license ∗See Appendix B for the list of collaboration members
1
1
Introduction
Measurements of top-quark production cross section and properties have played a major role in testing the standard model (SM) and in searches for new physics beyond it. The large top-quark production rates at the Large Hadron Collider (LHC) give access to a new realm of precision measurements. For the first time, the tt pair production rate is sufficiently high to perform a detailed and precise measurement of the tt production cross section differentially as a func-tion of various kinematic observables in tt events [1]. These measurements are crucial to verify the top-quark production mechanism at the LHC energy scale in the context of SM predic-tions with various levels of perturbative quantum chromodynamics (QCD) approximapredic-tions. Furthermore, scenarios beyond the SM, for example decays of massive Z-like bosons into top-quark pairs, could be revealed in such measurements, most prominently as resonances in the invariant tt mass spectrum [2–4].
Here, measurements of the normalised differential tt production cross section in proton-proton (pp) collisions at a centre-of-mass energy√s of 7 TeV with the Compact Muon Solenoid (CMS) detector are presented. These results complement the recent CMS measurements of the tt pro-duction cross section [5–9]. The analysis makes use of the full set of data recorded in 2011, corresponding to an integrated luminosity of 5.0±0.1 fb−1. The cross section is determined as a function of the kinematic properties of the leptons and of the jets associated to b quarks or antiquarks (b jets) from top-quark decays, of the top quarks themselves, as well as of the tt system. The results are compared to several theoretical predictions obtained with MAD -GRAPH [10], MC@NLO [11], POWHEG [12–14], and to the latest next-to-leading-order (NLO) plus logarithm (NNLL) [15] and approximate next-to-next-to-leading-order (NNLO) [16, 17] calculations.
The measurements are performed in several decay channels of the tt system, both in the`+jets channels (` = e or µ), with a single isolated lepton and at least four jets in the final state, and in the dilepton channels, with two oppositely charged leptons (e+e−, µ+
µ−, µ±e∓) and at
least two jets. The top-quark-pair candidate events are selected by requiring isolated leptons and jets with high transverse momenta. Backgrounds to tt production are suppressed by use of b-tagging techniques. The top-quark kinematic properties are obtained through kinematic fitting and reconstruction algorithms. The normalised differential tt production cross section is determined by counting the number of tt signal events in each bin of the measurement, correcting for the detector effects and dividing by the measured total cross section. Correlations between the bins of the measurement are taken into account by using regularised unfolding techniques.
The measurement performed here refers to kinematical distributions. To remove systematic uncertainties on the normalisation, the absolute differential cross section is normalised to the in-situ measured inclusive cross section. The inclusive cross section, as obtained in this analy-sis, is consistent with the results from dedicated CMS measurements [5–9]. To avoid additional model uncertainties due to the extrapolation of the measured cross section into experimentally inaccessible phase space regions, the results for directly measurable quantities, such as the kine-matic properties of leptons and b jets, are reported in a visible phase space. This phase space is defined as the kinematic region in which all selected final state objects are produced within the detector acceptance and are thus measurable experimentally. For top-quark and tt distribu-tions, the measurements are performed in the full phase space, allowing for comparison with calculations up to the approximate NNLO precision.
This document is structured as follows. A brief description of the CMS detector is provided in Section 2, followed by details of the event simulation in Section 3, and the event selection
2 3 Event Simulation and Theoretical Calculations
and reconstruction in Section 4. The estimated systematic uncertainties on the measurements of the cross section are described in Section 5. The result of the differential cross section mea-surements are presented in Section 6, followed by a summary in Section 7.
2
The CMS Detector
The central feature of the CMS apparatus is a superconducting solenoid of 13 m length and 6 m internal diameter, which provides an axial magnetic field of 3.8 T. Within the field volume are the silicon pixel and strip trackers, the crystal electromagnetic calorimeter (ECAL), and the brass/scintillator hadron calorimeter (HCAL). Charged particle trajectories are measured by the inner tracker, covering 0 < φ < 2π in azimuth and|η| < 2.5, where the pseudorapidity ηis defined as η = −ln[tan θ/2], and θ is the polar angle of the trajectory of the particle with
respect to the anticlockwise-beam direction. The ECAL and the HCAL surround the tracking volume, providing high-resolution energy and direction measurements of electrons, photons, and hadronic jets. Muons are measured in gas-ionisation detectors embedded in the steel field return yoke. Extensive forward calorimetry complements the coverage provided by the barrel and endcap detectors. The detector is nearly hermetic, allowing for energy balance measure-ments in the plane transverse to the beam directions. A two-tier trigger system selects the pp collision events for use in physics analysis. A more detailed description of the CMS detector can be found in Ref. [18].
3
Event Simulation and Theoretical Calculations
Event generators, interfaced with detailed detector simulations, are used to model experimen-tal effects, such as reconstruction and selection efficiencies as well as detector resolutions. For the simulation of the tt signal sample, the MADGRAPH event generator (v. 5.1.1.0) is used,
which implements the relevant matrix elements up to three additional partons. The value of the top-quark mass is fixed to mt=172.5 GeV and the proton structure is described by the
par-ton density functions (PDF) CTEQ6L1 [19]. The generated events are subsequently processed with PYTHIA (v. 6.424) [20] for parton showering and hadronisation, and the MLM prescrip-tion [21] is used for the matching of the jets with parton showers.
Standard-model background samples are simulated with MADGRAPH, POWHEG (r1380) [22], orPYTHIA, depending on the process. For the`+jets channels, W- and Z/γ∗-boson production
with additional jets (referred to as W+jets and Z+jets, respectively, in the following), single-top-quark production (s-, t-, and tW-channel), diboson (WW, WZ, and ZZ), and QCD multijet events are considered as background processes and listed according to their importance. For the dilepton channels, the main background contributions (in decreasing order of importance) stem from Z+jets, single-top-quark, W+jets, diboson, and QCD multijet events. The W+jets and Z+jets samples, including the W/Z+c¯c/b ¯b processes, are simulated with MADGRAPHwith up to four partons in the final state. POWHEGis used for single-top-quark production, while
PYTHIAis used to simulate diboson and QCD multijet events. Parton showering and hadroni-sation are also simulated withPYTHIAin all the background samples. ThePYTHIAZ2 tune [23]
is used to characterise the underlying event in both the tt signal and the background samples. The CMS detector response is simulated using GEANT4 (v. 9.4) [24].
For comparison with the measured distributions, the events in the simulated samples are nor-malised to an integrated luminosity of 5.0 fb−1according to their predicted cross sections. The latter are taken from NNLO (W+jets, Z+jets), NLO+NNLL (single-top-quark s- [25], t- [26], and tW- [27] channels), NLO (diboson [28]), and leading-order (LO) (QCD multijet [20])
calcula-3
tions. Correction factors described in Section 5 are applied where necessary to improve the description of the data by the simulation. The tt simulation sample is normalised to the data to present expected rates in figures in Section 4.
In addition to the MADGRAPH prediction, theoretical calculations obtained with the NLO generatorsPOWHEGandMC@NLO(v. 3.41), and the latest NLO+NNLL [15] and approximate NNLO [16, 17] predictions are compared, when available, to the final results presented in Sec-tion 6. The proton structure is described by the PDF sets CTEQ6M [19] both forPOWHEG and
MC@NLO, while the NNLO MSTW2008 [29] PDF set is used for the NLO+NNLL and for the approximate NNLO calculations. The events generated with POWHEGandMC@NLOare fur-ther processed withPYTHIAandHERWIG(v. 6.520) [30], respectively, for the subsequent parton
showering and hadronisation. WhilePOWHEGandMC@NLOare formally equivalent up to the
NLO accuracy, they differ in the techniques used to avoid double counting of radiative cor-rections that may arise from interfacing with the parton showering generators. Furthermore, the parton showering inPYTHIAis based on a transverse-momentum-ordered evolution scale, whereas inHERWIGit is angular-ordered.
4
Event Reconstruction and Selection
The event selection is based on the decay topology of the top quark, where each top quark decays into a W boson and a b quark. The`+jets channels refer to events with only one leptonic W-boson decay, whereas in the dilepton channels each of the two W bosons decays leptonically (muon or electron). These signatures imply the identification of isolated leptons with high transverse momentum pT, large missing transverse momentum due to neutrinos from W-boson
decays escaping the detector, and highly energetic jets. The heavy-quark content of the jets is identified through b-tagging techniques.
4.1 Lepton and Jet Reconstruction
Events are reconstructed using a particle-flow technique [31, 32], which combines signals from all sub-detectors to enhance the reconstruction performance by identifying individual particle candidates in pp collisions. Charged hadrons from pileup events, i.e. those originating from a vertex other than the one of the hard interaction, are subtracted event-by-event. Subsequently, the remaining neutral-hadron pileup component is subtracted at the level of jet energy correc-tions [33].
Electron candidates are reconstructed from a combination of the track momentum at the main interaction vertex, the corresponding energy deposition in the ECAL, and the energy sum of all bremsstrahlung photons attached to the track. They are required to have a transverse en-ergy ET > 30 GeV within the pseudorapidity interval|η| < 2.1 for the `+jets channels, while
electrons in the dilepton channels have to fulfil ET > 20 GeV and|η| < 2.4. As an additional
quality criterion, a relative isolation Irelis computed. It is defined by the sum of the transverse
momenta of all neutral and charged reconstructed particle candidates inside a cone around the electron in η−φspace of∆R≡ p(∆η)2+ (∆φ)2 <0.4 for the`+jets channels and∆R<0.3 for
the dilepton channels, divided by the pTof the electron. The transverse momentum associated
with the electron is excluded from the sum. A relative isolation of the electron Irel < 0.125 is demanded for the`+jets channels and Irel < 0.17 for the dilepton channels. In addition, elec-trons from photon conversions, identified by missing hits in the silicon tracker, or being close to a second electron track, are rejected.
4 4 Event Reconstruction and Selection
and the muon system. They are required to have pT > 30 GeV and |η| < 2.1 for the`+jets
channels, while in the dilepton channels the corresponding selections require pT >20 GeV and
|η| <2.4. Isolated muon candidates are selected if they fulfil Irel<0.125 for the`+jets channels
and Irel < 0.20 for the dilepton channels. To further increase the purity of muons originating from the primary interaction and to suppress misidentified muons or muons from decay-in-flight processes, additional quality criteria, such as a minimal number of hits associated with the muon track, are required in both the silicon tracker and the muon system.
Jets are reconstructed by clustering the particle-flow candidates [34] using the anti-ktclustering
algorithm with a distance parameter of 0.5 [35]. Electrons and muons passing less stringent selections on lepton kinematic quantities and isolation compared to the ones mentioned above have been identified and are excluded from the clustering process. A jet is selected if it has pT >
30 GeV and |η| < 2.4 for both the `+jets and dilepton channels. In addition, jets originating
from b quarks are identified in each decay channel by a “combined secondary-vertex” (CSV) algorithm [36], which provides a b-tagging discriminant by combining secondary vertices and track-based lifetime information. The chosen working point in the `+jets channels results in an efficiency for tagging a b jet of about 60%, while the probability to misidentify light-flavour jets as b jets (mistag rate) is only about 1.5%. In the dilepton channels, the working point is selected such that the b-tagging efficiency and mistag rate are about 80–85% and around 10%, respectively [36].
The missing transverse energy E/ is defined as the magnitude of the transverse momentumT
imbalance p/ , which is the negative of the vectorial sum of the transverse momenta of all the~T
particles reconstructed with the particle-flow algorithm [37].
4.2 Event Selection
The event selection in the`+jets channels proceeds as follows. In the e+jets channel, events are triggered by an isolated electron and three or more jets fulfilling transverse momentum thresh-olds. The trigger efficiency within the acceptance of this analysis is above 96%. Events in the
µ+jets channel are triggered by the presence of an isolated muon fulfilling pT thresholds and
geometrical acceptance requirements. In this channel, the trigger efficiency is above 87%. For the final analysis, only triggered events that have exactly one isolated lepton (leading lepton) according to the lepton identification criteria described in Section 4.1 are retained. Events with additional muons with pT>10 GeV,|η| <2.5, and relative isolation Irel<0.2 are rejected.
Fur-thermore, in the e+jets channel, events are rejected if additional electrons have ET > 20 GeV,
|η| <2.5, and Irel< 0.2, and form a dielectron mass within 15 GeV of the mass of the Z boson.
In the µ+jets channel, events are rejected if they contain electron candidates with ET >15 GeV,
|η| < 2.5, and Irel < 0.2. These lepton vetoes are meant to suppress background events from
Z-boson and diboson production. An event must contain at least four reconstructed jets satisfy-ing the criteria mentioned in Section 4.1. At least two of them are required to be tagged as b jets in order to suppress the background contribution mainly from W+jets events. After this selec-tion, the remaining backgrounds are dominantly single-top-quark and top-quark-pair events from other decay channels, i.e. events with missing transverse energy signature. Therefore, no requirement on missing transverse energy is imposed.
In the dilepton channels, at least two isolated leptons of opposite charge are required. These events are triggered using combinations of two leptons fulfilling transverse momentum thresh-olds and isolation requirements. The trigger efficiency is greater than 95% in the µ+µ−channel
and greater than 97% in the µ±e∓ and e+e− channels. For the final analysis, only triggered events passing the lepton identification criteria described above are retained. In events with
4.3 Kinematic Top-Quark-Pair Reconstruction 5
more than two leptons, only the lepton pair with the highest pT sum is considered. Events
with an invariant mass of the lepton pair smaller than 12 GeV are removed in order to suppress events from heavy-flavour resonance decays. Dilepton events are required to have at least two jets. At least one of the jets is required to be identified as a b jet to reduce the background contribution. In addition, backgrounds from Z+jets processes in the µ+µ−and e+e−channels
are further suppressed by requiring the dilepton invariant mass to be outside a Z-boson mass window of 91±15 GeV and E/ to be larger than 30 GeV.T
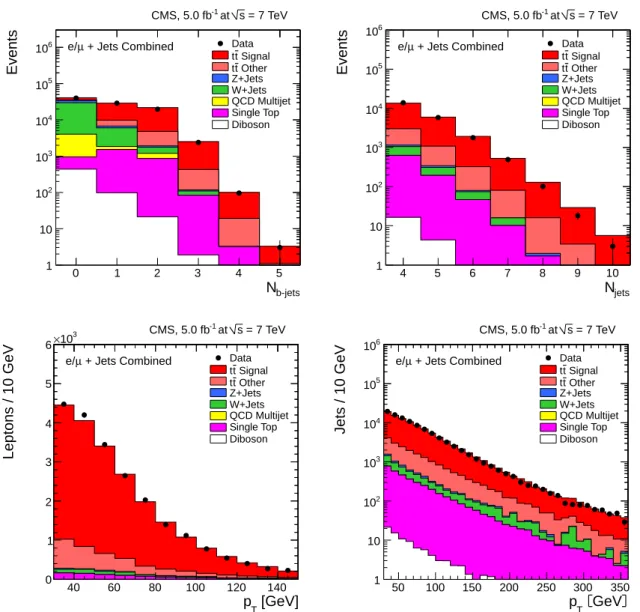
Basic distributions of the `+jets and dilepton event samples are shown in Figs. 1 and 2, re-spectively, for different steps of the selection. The data are well described by the simulation. It has been verified that the result of the measurement is unaffected by the small remaining differences.
In the`+jets channels, the main contributions to the background arise from W+jets and QCD multijet events, which are efficiently suppressed after the b-tagging requirement. After per-forming the full event selection, including the kinematic top-quark-pair reconstruction de-scribed in Section 4.3, 9 076 events are found in the e+jets channel and 10 766 events in the
µ+jets channel. In both decay channels, the`+jets signal contribution to the final event sample
is about 80%. The remaining fraction of events contains around 13% tt decays other than the
`+jets channels, including tt decays into τ leptons originating from the primary interaction, about 4% single-top-quark events, around 3% W+jets events, and negligible fractions of Z+jets, diboson, and QCD multijet events. The background contributions are all estimated from sim-ulation, normalised as described in Section 3 and subtracted from the data in each bin of the measurement.
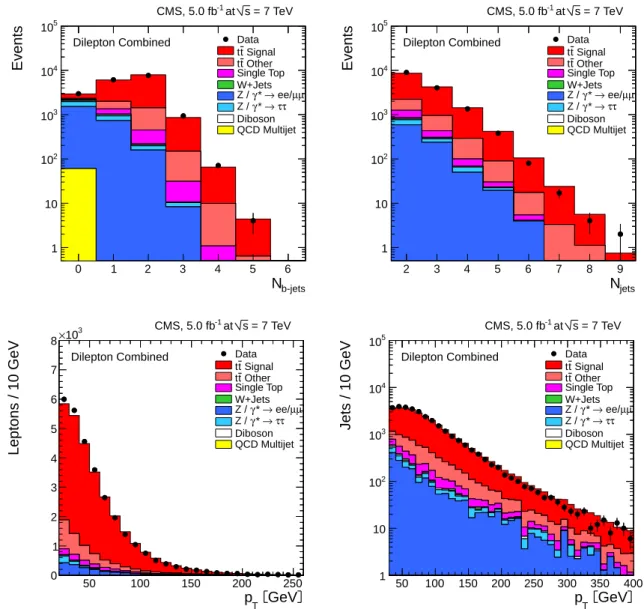
In the dilepton channels, after performing the full event selection, including the kinematic top-quark-pair reconstruction (cf. Section 4.3), 2 632 events are found in the e+e− channel, 3 014 in the µ+
µ− channel, and 7 498 in the µ±e∓ channel. Only tt events with two leptons
(electrons or muons) in the final state are considered as signal and constitute about 70–80% of the final event sample, depending on the decay channel. All other tt events, specifically those originating from decays via τ leptons, are considered as background and amount to 12–14% of the final event sample. Dominant backgrounds to the e+e−and µ+µ−channels originate from
Z+jets processes. Their contribution is estimated from data following the procedure described in Ref. [38]. The background normalisation is determined using the number of events inside the Z-peak region (removed from the candidate sample), and a correction needed for non-Z+jets backgrounds in this control region is derived from the µ±e∓ channel. The fraction of Z+jets events is found to be around 13%. Other sources of background, including single-top-quark production and diboson events, are estimated from simulation and found to be about 6%. The contribution arising from misidentified or genuine leptons within jets is estimated from data using like-sign events in a non-isolated region and found to be smaller than 1%, consistent with the simulation. The background contributions are subtracted from the data in each bin of the measurement.
4.3 Kinematic Top-Quark-Pair Reconstruction
For both the`+jets and dilepton channels, the kinematic properties of the top-quark pair are de-termined from the four-momenta of all final-state objects by means of kinematic reconstruction algorithms.
In the`+jets channels, a constrained kinematic fitting algorithm is applied [39]. In the fit, the four-momenta of the selected lepton, up to five leading jets, and thep/ representing the trans-~T
6 4 Event Reconstruction and Selection b-jets N 0 1 2 3 4 5 Events 1 10 2 10 3 10 4 10 5 10 6 10 Data Signal t t Other t t Z+Jets W+Jets QCD Multijet Single Top Diboson + Jets Combined µ e/ = 7 TeV s at -1 CMS, 5.0 fb jets N 4 5 6 7 8 9 10 Events 1 10 2 10 3 10 4 10 5 10 6 10 Data Signal t t Other t t Z+Jets W+Jets QCD Multijet Single Top Diboson + Jets Combined µ e/ = 7 TeV s at -1 CMS, 5.0 fb [GeV] T p 40 60 80 100 120 140 Leptons / 10 GeV 0 1 2 3 4 5 6 3 10 × Data Signal t t Other t t Z+Jets W+Jets QCD Multijet Single Top Diboson + Jets Combined µ e/ = 7 TeV s at -1 CMS, 5.0 fb GeV T p 50 100 150 200 250 300 350 Jets / 10 GeV 1 10 2 10 3 10 4 10 5 10 6 10 Data Signal t t Other t t Z+Jets W+Jets QCD Multijet Single Top Diboson + Jets Combined µ e/ = 7 TeV s at -1 CMS, 5.0 fb
Figure 1: Basic kinematic distributions after event selection for the`+jets channels. The top left plot shows the multiplicity of the reconstructed b-tagged jets. The multiplicity of the recon-structed jets (top right), the pT of the selected isolated leptons (bottom left), and the pT of the
4.3 Kinematic Top-Quark-Pair Reconstruction 7 b-jets N 0 1 2 3 4 5 6 Events 1 10 2 10 3 10 4 10 5 10 = 7 TeV s at -1 CMS, 5.0 fb
Dilepton Combined Data
Signal t t Other t t Single Top W+Jets µ µ ee/ → * γ Z / τ τ → * γ Z / Diboson QCD Multijet jets N 2 3 4 5 6 7 8 9 Events 1 10 2 10 3 10 4 10 5 10 = 7 TeV s at -1 CMS, 5.0 fb
Dilepton Combined Data
Signal t t Other t t Single Top W+Jets µ µ ee/ → * γ Z / τ τ → * γ Z / Diboson QCD Multijet GeV T p 50 100 150 200 250 Leptons / 10 GeV 0 1 2 3 4 5 6 7 8 3 10 × at s = 7 TeV -1 CMS, 5.0 fb
Dilepton Combined Data
Signal t t Other t t Single Top W+Jets µ µ ee/ → * γ Z / τ τ → * γ Z / Diboson QCD Multijet GeV T p 50 100 150 200 250 300 350 400 Jets / 10 GeV 1 10 2 10 3 10 4 10 5 10 = 7 TeV s at -1 CMS, 5.0 fb
Dilepton Combined Data
Signal t t Other t t Single Top W+Jets µ µ ee/ → * γ Z / τ τ → * γ Z / Diboson QCD Multijet
Figure 2: Basic kinematic distributions after event selection for the dilepton channels. The top left plot shows the multiplicity of the reconstructed b-tagged jets. The multiplicity of the reconstructed jets (top right), the pTof the selected isolated leptons (bottom left), and the pTof
the reconstructed jets (bottom right) are shown after the b-tagging requirement. The Z/γ∗+jets background is determined from data (cf. Section 4.2).
8 5 Systematic Uncertainties
component of the neutrino is treated as a free parameter. Moreover, the fit is constrained to reconstruct two W bosons, each with a mass of 80.4 GeV, and top quark and antiquark with identical masses. In events with several combinatorial solutions, only the one with the mini-mum χ2of the fit is accepted.
In the dilepton channels, an alternative kinematic reconstruction method is used [40]. In these channels, due to the presence of two neutrinos, the kinematic reconstruction is undercon-strained, even after imposing a transverse-momentum balance of the two neutrinos, a W-boson invariant mass of 80.4 GeV, and equality of the top-quark and antiquark masses. The top-quark mass can be reconstructed in a broad mass range due to detector resolution effects. To account for this, the top-quark mass for each lepton-jet combination is assumed between 100 GeV and 300 GeV in steps of 1 GeV. In the case that an event produces more than one physical solution, those using two b-tagged jets are preferred to the ones using one b-tagged jet, and solutions using one b-tagged jets are preferred to those using no b-tagged jets. After this selection, if an event has more than one solution with the preferred b-tagging, these are ranked according to how the neutrino energies match with a simulated neutrino energy spectrum, and the highest ranked one is chosen.
For both decay channels, the kinematic reconstruction yields no physical solution for about 11% of the events. These events are excluded from further analysis. The simulation provides a good description of the data before and after this requirement.
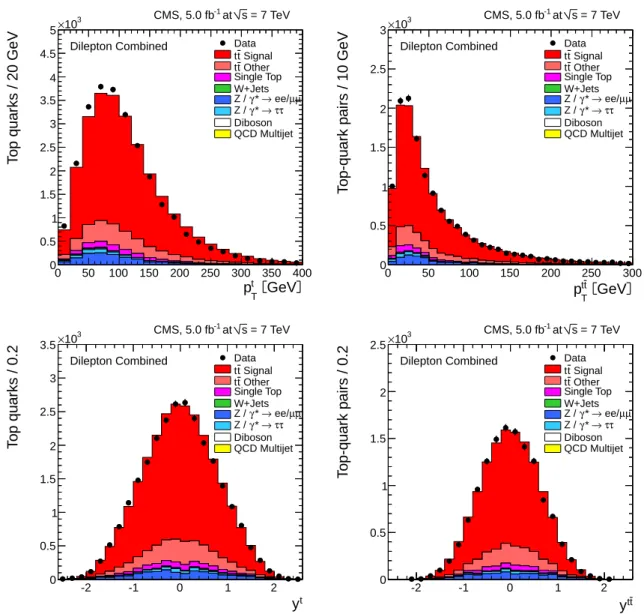
Distributions of the top-quark or antiquark and tt kinematic observables (ptT, yt, pttT, and ytt, where y is the rapidity defined as y = 1/2·ln[(E+ pz)/(E−pz)], with E and pz denoting
the particle energy and the momentum along the anticlockwise-beam axis, respectively) as ob-tained from the kinematic reconstruction, are presented in Fig. 3 for the`+jets event sample and in Fig. 4 for the dilepton event sample. In general, the data are well described by the simulation within uncertainties. As in Figs. 1 and 2, the final results are not affected by the small remain-ing differences in normalisation between data and simulation. For both channels, the measured pT distributions show a trend of being shifted to lower transverse momenta compared to the
simulated distributions.
5
Systematic Uncertainties
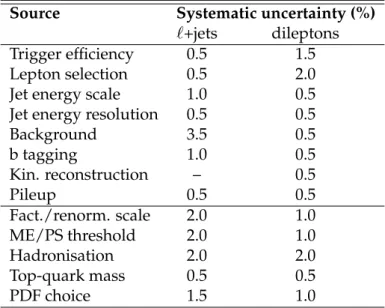
Systematic uncertainties on the measurement arise from detector effects as well as from the-oretical uncertainties. Each systematic uncertainty is investigated separately, and determined individually in each bin of the measurement, by variation of the corresponding efficiency, res-olution, or scale within its uncertainty. Correction factors, subsequently referred to as scale factors, are applied where necessary to improve the description of the data by the simulation. For each variation, the measured normalised differential cross section is recalculated, and the difference of the varied result to the nominal result in each bin is taken as the systematic uncer-tainty. The overall uncertainty on the measurement is then derived by adding the individual contributions in quadrature. The dominant uncertainties on the normalised differential cross section originate from the lepton selection, the b tagging, and from model uncertainties. A summary of the typical systematic uncertainties of the normalised differential cross section, obtained by averaging over all quantities and bins, is given in Table 1 and a detailed descrip-tion is given in Secdescrip-tions 5.1 and 5.2.
9 GeV t T p 0 50 100 150 200 250 300 350 400 T o p q u a rk s / 2 0 G e V 0 1 2 3 4 5 6 7 3 10 × Data Signal t t Other t t Z+Jets W+Jets QCD Multijet Single Top Diboson + Jets Combined µ e/ = 7 TeV s at -1 CMS, 5.0 fb GeV t t T p 0 50 100 150 200 250 300 T o p -q u a rk p a ir s / 2 0 G e V 0 1 2 3 4 5 6 3 10 × Data Signal t t Other t t Z+Jets W+Jets QCD Multijet Single Top Diboson + Jets Combined µ e/ = 7 TeV s at -1 CMS, 5.0 fb t y -2 -1 0 1 2 T o p q u a rk s / 0 .1 0 0.5 1 1.5 2 2.5 3 10 × Data Signal t t Other t t Z+Jets W+Jets QCD Multijet Single Top Diboson + Jets Combined µ e/ = 7 TeV s at -1 CMS, 5.0 fb t t y -2 -1 0 1 2 T o p -q u a rk p a ir s / 0 .1 0 0.2 0.4 0.6 0.8 1 1.2 1.4 1.6 3 10 × Data Signal t t Other t t Z+Jets W+Jets QCD Multijet Single Top Diboson + Jets Combined µ e/ = 7 TeV s at -1 CMS, 5.0 fb
Figure 3: Distribution of top-quark and tt quantities as obtained from the kinematic recon-struction in the `+jets channels. The left plots show the distributions for the top quarks or antiquarks; the right plots show the tt system. The top row shows the transverse momenta, and the bottom row shows the rapidities.
10 5 Systematic Uncertainties GeV t T p 0 50 100 150 200 250 300 350 400 T o p q u a rk s / 2 0 G e V 0 0.5 1 1.5 2 2.5 3 3.5 4 4.5 5 3 10 × at s = 7 TeV -1 CMS, 5.0 fb
Dilepton Combined Data
Signal t t Other t t Single Top W+Jets µ µ ee/ → * γ Z / τ τ → * γ Z / Diboson QCD Multijet GeV t t T p 0 50 100 150 200 250 300 T o p -q u a rk p a ir s / 1 0 G e V 0 0.5 1 1.5 2 2.5 3 3 10 × at s = 7 TeV -1 CMS, 5.0 fb
Dilepton Combined Data
Signal t t Other t t Single Top W+Jets µ µ ee/ → * γ Z / τ τ → * γ Z / Diboson QCD Multijet t y -2 -1 0 1 2 T o p q u a rk s / 0 .2 0 0.5 1 1.5 2 2.5 3 3.5 3 10 × at s = 7 TeV -1 CMS, 5.0 fb
Dilepton Combined Data
Signal t t Other t t Single Top W+Jets µ µ ee/ → * γ Z / τ τ → * γ Z / Diboson QCD Multijet t t y -2 -1 0 1 2 T o p -q u a rk p a ir s / 0 .2 0 0.5 1 1.5 2 2.5 3 10 × at s = 7 TeV -1 CMS, 5.0 fb
Dilepton Combined Data
Signal t t Other t t Single Top W+Jets µ µ ee/ → * γ Z / τ τ → * γ Z / Diboson QCD Multijet
Figure 4: Distribution of top-quark and tt quantities as obtained from the kinematic recon-struction in the dilepton channels. The left plots show the distributions for the top quarks or antiquarks; the right plots show the tt system. The top row shows the transverse momenta, and the bottom row shows the rapidities. The Z/γ∗+jets background is determined from data (cf. Section 4.2).
5.1 Experimental Uncertainties 11
5.1 Experimental Uncertainties
The efficiency of the single-muon trigger in µ+jets events is determined using the “tag-and-probe” method [41] with Z-boson event samples. A dependence on the pseudorapidity of the muon of a few percent is observed and scale factors are derived. In order to determine the efficiency of the electron-trijet trigger in e+jets events, the tag-and-probe method is also applied to the electron branch, while independent control triggers are used for the hadronic part. Good agreement is observed between data and simulation, and scale factors very close to unity are applied. The lepton identification and isolation efficiencies for the `+jets channels obtained with the tag-and-probe method agree well between data and simulation, so that corrections very close or equal to unity are applied. The systematic uncertainties are determined by shape-dependent variations of trigger and selection efficiencies within their uncertainties. Lepton trigger efficiencies in the dilepton channels are measured using triggers that are only weakly correlated to the dilepton triggers. The lepton identification and isolation uncertainties in the dilepton channels are also determined using the tag-and-probe method, and are found to be described very well by the simulation for both electrons and muons. The overall difference between data and simulation in bins of pseudorapidity and transverse momentum is estimated to be less than 2% for electrons, while scale factors for muons are found to be close to unity. To estimate the uncertainty on the jet energy scale, the reconstructed jet energy is varied as a function of the transverse momentum and the pseudorapidity of the jet (typically by a few percent) [34]. The uncertainty on the jet energy resolution (JER) is determined by variation of the simulated JER up and down by about±6%, ±9%, and ±20%, for the pseudorapidity regions|η| <1.7, 1.7< |η| <2.3, and|η| >2.3, respectively [34].
The uncertainty due to background normalisation is determined by variation of the back-ground yields. For the `+jets channels, the background normalisation is varied by ±30% for the single-top-quark and diboson samples, and by±50% for the QCD samples [5, 6]. For the W/Z-boson samples, this uncertainty is covered by variations of the kinematic scales of the event process (renormalisation and factorisation scales and jet-parton matching), as described in Section 5.2. In the e+e− and µ+µ− channels, the dominant background from Z+jets
pro-cesses as determined from data (cf. Section 4) is varied in normalisation by±30%. In addition, variations of the background contributions from single-top-quark and diboson events up and down by±30% are performed [9, 42].
The uncertainty on the b-tagging efficiency is determined by dividing the b-jet distributions for transverse momentum and pseudorapidity into two bins at the median of the respective distributions. These are pT = 65 GeV and |η| = 0.7 for the`+jets and pT = 65 GeV and|η| =
0.75 for the dilepton channels. The b-tagging scale factors for the b jets in the first bin are scaled up by half of the uncertainties quoted in Ref. [36], while those in the second bin are scaled down and vice versa, so that a maximum variation is assumed and the difference between the scale factors in the two bins amounts to the full uncertainty. The variations are performed separately for the transverse-momentum and pseudorapidity distributions.
The kinematic reconstruction of the top quarks is generally found to be very well described by the simulation, and the resulting uncertainties are small. In the case of the`+jets analysis, the uncertainty of the kinematic fit is included in the variations of jet energy scales and resolutions. In the dilepton analysis, the bin-to-bin uncertainty is determined from the small remaining difference between the simulation and the data.
The pileup model estimates the mean number of additional pp interactions to be about 9.5 events for the analysed data. This estimate is based on the total inelastic proton-proton cross
12 6 Normalised Differential Cross Section
section, which is determined to be 73.5 mb [43]. The systematic uncertainty is determined by varying this cross section within its uncertainty of±8%.
5.2 Model Uncertainties
The impact of theoretical assumptions on the measurement is determined by repeating the analysis, replacing the standard MADGRAPH signal simulation by dedicated simulation
sam-ples, as described below.
The uncertainty on the modeling of the hard-production process is assessed by varying the renormalisation and factorisation scale in the MADGRAPH signal samples up and down by a factor of two with respect to its nominal value, equal to the Q2 of the hard process (Q2 =
m2t +Σp2T). Furthermore, the effect of additional jet production in MADGRAPHis studied by
varying the threshold between jet production at the matrix-element level and via parton show-ering up and down by a factor of two with respect to the nominal value of 20 GeV. In the`+jets channels, variations of the renormalisation and factorisation scale are also applied to single-top-quark events to determine a shape uncertainty for this background contribution. Addi-tionally, both kinematic scales are varied for W- and Z-boson background events to associate a shape and background normalisation uncertainty to these samples. Each type of variation is applied simultaneously for the W- and Z-boson samples.
The uncertainty due to the hadronisation model is determined by comparing samples simu-lated withPOWHEGandMC@NLOusingPYTHIAandHERWIG, respectively, for hadronisation. The dependence of the measurement on the top-quark mass is estimated from dedicated MAD -GRAPH simulation samples in which the top-quark mass is varied with respect to the value used for the default simulation. The resulting variations are scaled linearly according to the present world average uncertainty of 0.9 GeV. The effect of the uncertainty from parton den-sity functions on the measurement is assessed by reweighting the sample of simulated tt signal events. For this reweighting, the minimum and maximum variations with respect to the nom-inal value is obtained by following the PDF4LHC prescription [44] using the NLO PDF sets CT10 [45], MSTW2008NLO, and NNPDF2.1 [46].
6
Normalised Differential Cross Section
The normalised cross section in each bin i of each observable X is determined through the relation: 1 σ dσi dX = 1 σ xi ∆X i L (1) In each bin of the measurement, xi represents the number of signal events in data determined
after background subtraction and corrected for detector efficiencies, acceptances, and migra-tions, as described below. The normalised differential cross section is then derived by scaling to the integrated luminosityLand by dividing the corrected number of events by the width∆X i
of the bin and by the measured total cross section σ in the same phase space. Due to the normal-isation, those systematic uncertainties that are correlated across all bins of the measurement, and therefore only affect the normalisation, cancel out.
Effects from trigger and detector efficiencies and resolutions, leading to the migration of events across bin boundaries and statistical correlations among neighbouring bins, are corrected by
13
Table 1: Breakdown of typical systematic uncertainties for the normalised differential cross section in the`+jets and dilepton channels. The background uncertainty for the`+jets channels includes normalisation uncertainties as well as uncertainties due to variations of the kinematic scales in W/Z-boson events.
Source Systematic uncertainty (%)
`+jets dileptons
Trigger efficiency 0.5 1.5
Lepton selection 0.5 2.0
Jet energy scale 1.0 0.5
Jet energy resolution 0.5 0.5
Background 3.5 0.5 b tagging 1.0 0.5 Kin. reconstruction – 0.5 Pileup 0.5 0.5 Fact./renorm. scale 2.0 1.0 ME/PS threshold 2.0 1.0 Hadronisation 2.0 2.0 Top-quark mass 0.5 0.5 PDF choice 1.5 1.0
using a regularised unfolding method [47, 48]. For each measured distribution, a response ma-trix that accounts for migrations and efficiencies is calculated from the simulated MADGRAPH
tt signal sample. The generalised inverse of the response matrix is used to obtain the unfolded distribution from the measured distribution by applying a χ2technique. To avoid non-physical fluctuations, a smoothing prescription (regularisation) is applied. The regularisation level is de-termined individually for each distribution using the averaged global correlation method [49]. To keep the bin-to-bin migrations small, the width of the bins of the measurement are chosen according to their purity and stability. For a certain bin i, the number of particles generated and correctly reconstructed Nigen&rec is determined. The purity pi is then this number divided by
the total number of reconstructed particles in the same bin Nirec: pi = Nigen&rec/Nirec. Similarly,
the stability siis defined as that number scaled to the total number of generated particles in the
particular bin Nigen, yielding si = Nigen&rec/Nigen. In this analysis, the purity and stability of
the bins are typically 50% or larger. The performance of the unfolding procedure is tested for a possible bias due to the choice of the input model (the tt MADGRAPHsignal simulation). It has
been verified that, by either reweighting the signal simulation or injecting a resonant tt signal into the signal simulation, the unfolding procedure still reproduces the results correctly when using the default MADGRAPHtt signal simulation to account for migrations and efficiencies. The analysis proceeds by measuring the normalised differential cross section in the`+jets chan-nels and dilepton chanchan-nels. For each kinematic distribution, the event yields in the separate channels are added up, the background is subtracted, and the unfolding is performed. As a cross-check, it has been verified that the measurements in the individual channels are in agree-ment with each other within the uncertainties.
The systematic uncertainties in each bin are assessed from the variations of the combined cross sections. This means that the full analysis is repeated for every systematic variation and the difference with respect to the nominal combined value is taken as the systematic uncertainty for each bin and each measured observable. By using this method, the possible correlations of
14 6 Normalised Differential Cross Section
the systematic uncertainties between the different channels and bins are taken into account. The normalised differential tt cross section 1/σ·dσ/dX is determined as a function of the kinematic properties of the leading leptons, the lepton pair, the b jets, the top quarks, and the top-quark pair, and presented in the following sections. In order to avoid additional model un-certainties due to the extrapolation of the measurement outside experimentally well-described phase space regions, the normalised differential cross sections for the measured leptons and b jets are determined in a visible phase space defined by the kinematic and geometrical ac-ceptance of the final state leptons and jets. In contrast, the top-quark and the top-quark-pair quantities are presented in the full phase space in order to allow for comparisons with recent QCD calculations up to approximate NNLO precision. To facilitate comparison with theory curves independently of the binning, a horizontal bin-centre correction is applied. In each bin, the measured data points are presented at the horizontal position in the bin where the pre-dicted bin-averaged cross section equals the differential cross section according to the MAD -GRAPH calculation (cf. [50]). The measurement is compared to the predictions from MAD -GRAPH, POWHEG, andMC@NLO. For the latter, uncertainty bands corresponding to the PDF (following the PDF4LHC prescription [44]), the top-quark mass, and renormalisation and fac-torisation scale variations are also given. The top-quark and tt results are also compared to the latest approximate NNLO [16, 17] and NLO+NNLL [15] predictions, respectively. All mea-sured normalised differential cross section values, including bin boundaries and centres, are available in tabular form in App. A.
6.1 Lepton and b-Jet Differential Cross Sections
For the`+jets channels, the normalised differential tt cross section as a function of the lepton and b-jet kinematic properties is defined at the particle level for the visible phase space where the lepton from the W-boson decay has a pseudorapidity|η`| < 2.1 and a transverse
momen-tum p`T > 30 GeV, and at least four jets with|η| < 2.4 and pT > 30 GeV, out of which two
are b jets. A jet is defined at the particle level as a b jet if it contains the decay products of a B hadron. For this analysis, the two highest transverse momentum b jets originating from different B hadrons are selected.
In Fig. 5, the normalised differential cross section is presented as a function of the lepton trans-verse momentum pT` and pseudorapidity η`. In Fig. 6, the distributions for the transverse mo-mentum of the b jets, pbT, and their pseudorapidity, ηb, are shown. Also shown are predictions from MADGRAPH, POWHEG, and MC@NLO. Good agreement is observed between the data and the theoretical predictions within experimental uncertainties.
For the dilepton channels, the normalised tt differential cross section as a function of the lepton and b jet kinematic properties is defined at the particle level for the visible phase space where the leptons have |η`| < 2.4 and p`T > 20 GeV, and the b jets from the top-quark decays both
lie within the range |η| < 2.4 and pT > 30 GeV. The b jet at the particle level is defined as
described above for the`+jets analysis.
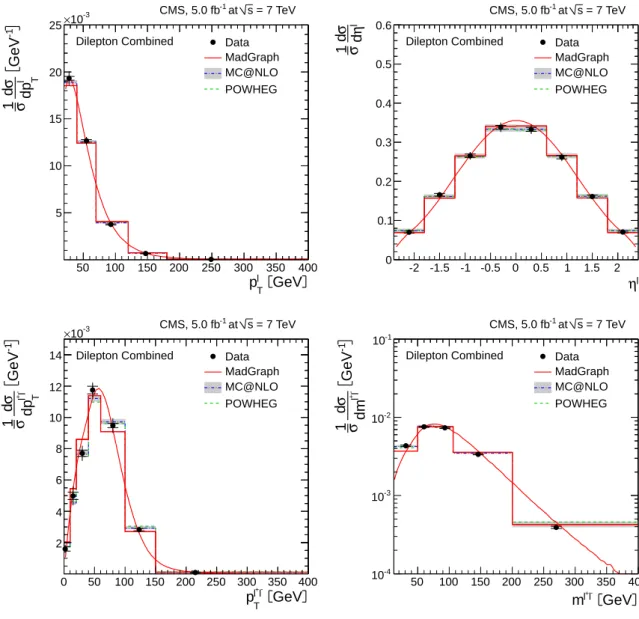
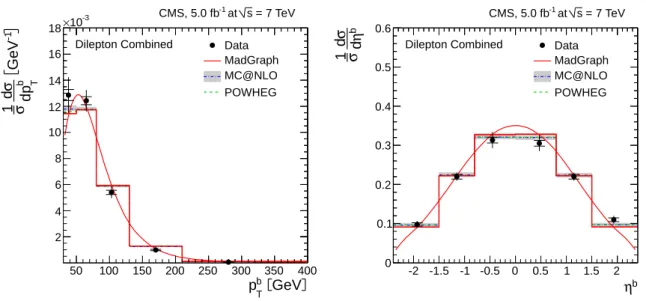
In Fig. 7, the normalised differential cross section for the following lepton and lepton-pair observables are presented: the transverse momentum of the leptons p`T, the pseudorapidity η` of the leptons, the transverse momentum of the lepton pair p`T+`−, and the invariant mass of the lepton pair m`+`−. The distributions for the transverse momentum of the b jets, pbT, and their pseudorapidity, ηb, are shown in Fig. 8. Predictions from MADGRAPH,POWHEG, andMC@NLO
are also shown. Good agreement is observed between data and theoretical predictions within experimental uncertainties. The MC@NLOand POWHEGpredictions, which take into account
6.1 Lepton and b-Jet Differential Cross Sections 15 GeV l T p 40 60 80 100 120 140 160 180 200 -1 GeV l T dp σ d σ 1 0 5 10 15 20 25 30 -3 10 × Data MadGraph MC@NLO POWHEG = 7 TeV s at -1 CMS, 5.0 fb + Jets Combined µ e/ l η -2 -1.5 -1 -0.5 0 0.5 1 1.5 2 lη d σ d 1 σ 0 0.1 0.2 0.3 0.4 0.5 0.6 Data MadGraph MC@NLO POWHEG = 7 TeV s at -1 CMS, 5.0 fb + Jets Combined µ e/
Figure 5: Normalised differential tt production cross section in the`+jets channels as a function of the p`T(left) and η`(right) of the lepton. The superscript ‘`’ refers to both`+and`−. The inner (outer) error bars indicate the statistical (combined statistical and systematic) uncertainty. The measurements are compared to predictions from MADGRAPH, POWHEG, and MC@NLO. The
MADGRAPHprediction is shown both as a curve and as a binned histogram.
GeV b T p 50 100 150 200 250 300 350 400 -1 GeV b T dp σ d σ 1 0 2 4 6 8 10 12 14 16 18 -3 10 × Data MadGraph MC@NLO POWHEG = 7 TeV s at -1 CMS, 5.0 fb + Jets Combined µ e/ b η -2 -1.5 -1 -0.5 0 0.5 1 1.5 2 b η d σ d σ 1 0 0.1 0.2 0.3 0.4 0.5 0.6 Data MadGraph MC@NLO POWHEG = 7 TeV s at -1 CMS, 5.0 fb + Jets Combined µ e/
Figure 6: Normalised differential tt production cross section in the`+jets channels as a function of the pbT (left) and ηb(right) of the b jets. The superscript ‘b’ refers to both b and bb jets. The inner (outer) error bars indicate the statistical (combined statistical and systematic) uncertainty. The measurements are compared to predictions from MADGRAPH, POWHEG, and MC@NLO. The MADGRAPHprediction is shown both as a curve and as a binned histogram.
16 6 Normalised Differential Cross Section
which there exists some discrepancy between the different generators.
GeV l T p 50 100 150 200 250 300 350 400 -1 GeV l T dp σ d σ 1 5 10 15 20 25 -3 10 × at s = 7 TeV -1 CMS, 5.0 fb
Dilepton Combined Data
MadGraph MC@NLO POWHEG l η -2 -1.5 -1 -0.5 0 0.5 1 1.5 2 lη d σ d 1 σ 0 0.1 0.2 0.3 0.4 0.5 0.6 = 7 TeV s at -1 CMS, 5.0 fb
Dilepton Combined Data
MadGraph MC@NLO POWHEG GeV -l + l T p 0 50 100 150 200 250 300 350 400 -1 GeV -+l l T dp σ d σ 1 2 4 6 8 10 12 14 -3 10 × at s = 7 TeV -1 CMS, 5.0 fb
Dilepton Combined Data
MadGraph MC@NLO POWHEG GeV -l + l m 50 100 150 200 250 300 350 400 -1 GeV -+l l dm σ d σ 1 -4 10 -3 10 -2 10 -1 10 = 7 TeV s at -1 CMS, 5.0 fb
Dilepton Combined Data
MadGraph MC@NLO POWHEG
Figure 7: Normalised differential tt production cross section in the dilepton channels as a func-tion of the p`T (top left) and η`(top right) of the leptons, and the p`T+`− (bottom left), and m`+`− (bottom right) of the lepton pair. The superscript ‘`’ refers to both`+and`−. The inner (outer) error bars indicate the statistical (combined statistical and systematic) uncertainty. The mea-surements are compared to predictions from MADGRAPH,POWHEG, andMC@NLO. The MAD -GRAPHprediction is shown both as a curve and as a binned histogram.
6.2 Top-Quark and tt Differential Cross Sections
The normalised differential tt cross section as a function of the kinematic properties of the top quarks and the top-quark pair is presented at parton level and extrapolated to the full phase space using the MADGRAPHprediction for both the`+jets and the dilepton channels.
In Figs. 9 and 10, the distributions for the top-quark and the top-quark-pair observables in the
`+jets channels and the dilepton channels are presented. Those are the transverse momentum ptT and the rapidity ytof the top quarks and antiquarks, and the transverse momentum pttT, the
17 GeV b T p 50 100 150 200 250 300 350 400 -1 GeV b T dp σ d σ 1 2 4 6 8 10 12 14 16 18 -3 10 × at s = 7 TeV -1 CMS, 5.0 fb
Dilepton Combined Data
MadGraph MC@NLO POWHEG b η -2 -1.5 -1 -0.5 0 0.5 1 1.5 2 bη d σ d 1 σ 0 0.1 0.2 0.3 0.4 0.5 0.6 = 7 TeV s at -1 CMS, 5.0 fb
Dilepton Combined Data
MadGraph MC@NLO POWHEG
Figure 8: Normalised differential tt production cross section in the dilepton channels as a func-tion of the pbT (left) and ηb (right) of the b jets. The superscript ‘b’ refers to both b and bb jets. The inner (outer) error bars indicate the statistical (combined statistical and systematic) uncertainty. The measurements are compared to predictions from MADGRAPH,POWHEG, and MC@NLO. The MADGRAPHprediction is shown both as a curve and as a binned histogram.
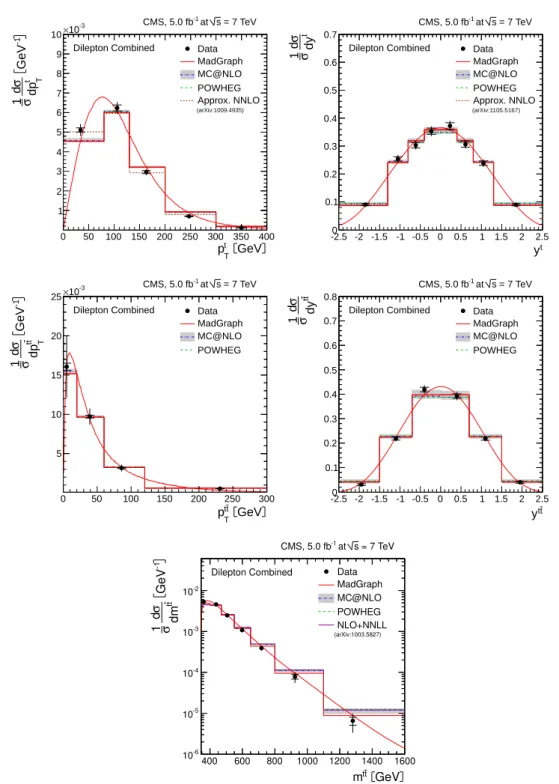
rapidity ytt, and the invariant mass mttof the top-quark pair. Also shown are predictions from MADGRAPH,POWHEG, andMC@NLO. In addition, the top-quark results are compared to the
approximate NNLO calculations from Ref. [16, 17], while the mttdistribution is compared to the NLO+NNLL prediction in Ref. [15].
For both`+jets and dilepton channels, good agreement is observed between data and theoreti-cal predictions within experimental uncertainties. Among the various predictions, the approx-imate NNLO calculation provides a better description of the data, as it predicts a slightly softer top-quark transverse momentum spectrum than the other three predictions.
7
Summary
First measurements of normalised differential top-quark-pair production cross sections in pp col-lisions at√s = 7 TeV with the CMS detector are presented. The measurements are performed in the `+jets (e+jets and µ+jets) and the dilepton (e+e−, µ+
µ−, and µ±e∓) tt decay
chan-nels. The normalised tt cross section is measured as a function of the transverse momentum, (pseudo)rapidity, and invariant mass of the final-state leptons and b jets in the visible phase space, and of the top quarks and tt system in the full phase space. The measurements among the different decay channels are in agreement with each other and with standard model predic-tions up to approximate next-to-next-to-leading-order precision. The prediction at approximate NNLO precision is found to give a particularly good description of the top-quark transverse momentum.
Acknowledgements
We thank Nikolaos Kidonakis for providing the approximate NNLO calculations and for fruit-ful discussions, and Li Lin Yang for providing the NLO+NNLL calculation. We congratulate
18 7 Summary GeV t T p 0 50 100 150 200 250 300 350 400 -1 GeV t T dp σ d 1 σ 0 1 2 3 4 5 6 7 8 9 10 -3 10 × Data MadGraph MC@NLO POWHEG Approx. NNLO = 7 TeV s at -1 CMS, 5.0 fb + Jets Combined µ e/ (arXiv:1009.4935) t y -2.5 -2 -1.5 -1 -0.5 0 0.5 1 1.5 2 2.5 t dy σ d 1 σ 0 0.1 0.2 0.3 0.4 0.5 0.6 0.7 Data MadGraph MC@NLO POWHEG Approx. NNLO = 7 TeV s at -1 CMS, 5.0 fb + Jets Combined µ e/ (arXiv:1105.5167) GeV t t T p 0 50 100 150 200 250 300 -1 GeV tt T dp σ d σ 1 0 5 10 15 20 25 -3 10 × Data MadGraph MC@NLO POWHEG = 7 TeV s at -1 CMS, 5.0 fb + Jets Combined µ e/ t t y -2.5 -2 -1.5 -1 -0.5 0 0.5 1 1.5 2 2.5 tt dy σ d σ 1 0 0.1 0.2 0.3 0.4 0.5 0.6 0.7 0.8 Data MadGraph MC@NLO POWHEG = 7 TeV s at -1 CMS, 5.0 fb + Jets Combined µ e/ GeV t t m 400 600 800 1000 1200 1400 1600 -1 GeV tt dm σ d σ 1 -6 10 -5 10 -4 10 -3 10 -2 10 Data MadGraph MC@NLO POWHEG NLO+NNLL = 7 TeV s at -1 CMS, 5.0 fb + Jets Combined µ e/ (arXiv:1003.5827)
Figure 9: Normalised differential tt production cross section in the`+jets channels as a func-tion of the ptT(top left) and yt(top right) of the top quarks, and the pttT (middle left), ytt(middle right), and mtt(bottom) of the top-quark pairs. The superscript ‘t’ refers to both top quarks and
antiquarks. The inner (outer) error bars indicate the statistical (combined statistical and system-atic) uncertainty. The measurements are compared to predictions from MADGRAPH,POWHEG, and MC@NLO, and to NLO+NNLL [15] and approximate NNLO [16, 17] calculations, when available. The MADGRAPHprediction is shown both as a curve and as a binned histogram.
19 GeV t T p 0 50 100 150 200 250 300 350 400 -1 GeV t T dp σ d 1 σ 1 2 3 4 5 6 7 8 9 10 -3 10 × at s = 7 TeV -1 CMS, 5.0 fb
Dilepton Combined Data
MadGraph MC@NLO POWHEG Approx. NNLO (arXiv:1009.4935) t y -2.5 -2 -1.5 -1 -0.5 0 0.5 1 1.5 2 2.5 t dy σ d 1 σ 0 0.1 0.2 0.3 0.4 0.5 0.6 0.7 = 7 TeV s at -1 CMS, 5.0 fb
Dilepton Combined Data
MadGraph MC@NLO POWHEG Approx. NNLO (arXiv:1105.5167) GeV t t T p 0 50 100 150 200 250 300 -1 GeV tt T dp σ d σ 1 5 10 15 20 25 -3 10 × at s = 7 TeV -1 CMS, 5.0 fb
Dilepton Combined Data
MadGraph MC@NLO POWHEG t t y -2.5 -2 -1.5 -1 -0.5 0 0.5 1 1.5 2 2.5 tt dy σ d 1 σ 0 0.1 0.2 0.3 0.4 0.5 0.6 0.7 0.8 = 7 TeV s at -1 CMS, 5.0 fb
Dilepton Combined Data
MadGraph MC@NLO POWHEG GeV t t m 400 600 800 1000 1200 1400 1600 -1 GeV tt dm σ d σ 1 -6 10 -5 10 -4 10 -3 10 -2 10 = 7 TeV s at -1 CMS, 5.0 fb Dilepton Combined Data
MadGraph MC@NLO POWHEG NLO+NNLL
(arXiv:1003.5827)
Figure 10: Normalised differential tt production cross section in the dilepton channels as a func-tion of the ptT(top left) and yt(top right) of the top quarks, and the pttT (middle left), ytt(middle right), and mtt(bottom) of the top-quark pairs. The superscript ‘t’ refers to both top quarks and
antiquarks. The inner (outer) error bars indicate the statistical (combined statistical and system-atic) uncertainty. The measurements are compared to predictions from MADGRAPH,POWHEG, and MC@NLO, and to NLO+NNLL [15] and approximate NNLO [16, 17] calculations, when available. The MADGRAPHprediction is shown both as a curve and as a binned histogram.
20 7 Summary
our colleagues in the CERN accelerator departments for the excellent performance of the LHC and thank the technical and administrative staffs at CERN and at other CMS institutes for their contributions to the success of the CMS effort. In addition, we gratefully acknowledge the computing centres and personnel of the Worldwide LHC Computing Grid for delivering so effectively the computing infrastructure essential to our analyses. Finally, we acknowledge the enduring support for the construction and operation of the LHC and the CMS detector provided by the following funding agencies: the Austrian Federal Ministry of Science and Re-search; the Belgian Fonds de la Recherche Scientifique, and Fonds voor Wetenschappelijk On-derzoek; the Brazilian Funding Agencies (CNPq, CAPES, FAPERJ, and FAPESP); the Bulgarian Ministry of Education, Youth and Science; CERN; the Chinese Academy of Sciences, Ministry of Science and Technology, and National Natural Science Foundation of China; the Colom-bian Funding Agency (COLCIENCIAS); the Croatian Ministry of Science, Education and Sport; the Research Promotion Foundation, Cyprus; the Ministry of Education and Research, Recur-rent financing contract SF0690030s09 and European Regional Development Fund, Estonia; the Academy of Finland, Finnish Ministry of Education and Culture, and Helsinki Institute of Physics; the Institut National de Physique Nucl´eaire et de Physique des Particules / CNRS, and Commissariat `a l’ ´Energie Atomique et aux ´Energies Alternatives / CEA, France; the Bundes-ministerium f ¨ur Bildung und Forschung, Deutsche Forschungsgemeinschaft, and Helmholtz-Gemeinschaft Deutscher Forschungszentren, Germany; the General Secretariat for Research and Technology, Greece; the National Scientific Research Foundation, and National Office for Research and Technology, Hungary; the Department of Atomic Energy and the Department of Science and Technology, India; the Institute for Studies in Theoretical Physics and Mathematics, Iran; the Science Foundation, Ireland; the Istituto Nazionale di Fisica Nucleare, Italy; the Ko-rean Ministry of Education, Science and Technology and the World Class University program of NRF, Korea; the Lithuanian Academy of Sciences; the Mexican Funding Agencies (CINVES-TAV, CONACYT, SEP, and UASLP-FAI); the Ministry of Science and Innovation, New Zealand; the Pakistan Atomic Energy Commission; the Ministry of Science and Higher Education and the National Science Centre, Poland; the Fundac¸˜ao para a Ciˆencia e a Tecnologia, Portugal; JINR (Armenia, Belarus, Georgia, Ukraine, Uzbekistan); the Ministry of Education and Science of the Russian Federation, the Federal Agency of Atomic Energy of the Russian Federation, Russian Academy of Sciences, and the Russian Foundation for Basic Research; the Ministry of Science and Technological Development of Serbia; the Secretar´ıa de Estado de Investigaci ´on, Desar-rollo e Innovaci ´on and Programa Consolider-Ingenio 2010, Spain; the Swiss Funding Agencies (ETH Board, ETH Zurich, PSI, SNF, UniZH, Canton Zurich, and SER); the National Science Council, Taipei; the Thailand Center of Excellence in Physics, the Institute for the Promotion of Teaching Science and Technology and National Electronics and Computer Technology Center; the Scientific and Technical Research Council of Turkey, and Turkish Atomic Energy Authority; the Science and Technology Facilities Council, UK; the US Department of Energy, and the US National Science Foundation.
Individuals have received support from the Marie-Curie programme and the European Re-search Council (European Union); the Leventis Foundation; the A. P. Sloan Foundation; the Alexander von Humboldt Foundation; the Belgian Federal Science Policy Office; the Fonds pour la Formation `a la Recherche dans l’Industrie et dans l’Agriculture (FRIA-Belgium); the Agentschap voor Innovatie door Wetenschap en Technologie (IWT-Belgium); the Ministry of Education, Youth and Sports (MEYS) of Czech Republic; the Council of Science and Industrial Research, India; the Compagnia di San Paolo (Torino); and the HOMING PLUS programme of Foundation for Polish Science, cofinanced from European Union, Regional Development Fund.
References 21
References
[1] ATLAS Collaboration, “Measurements of top quark pair relative differential cross-sections with ATLAS in pp collisions at√s = 7 TeV”, (2012).
arXiv:hep-ex/1207.5644.
[2] C. T. Hill, “Topcolor: top quark condensation in a gauge extension of the standard model”, Phys. Lett. B 266 (1991) 419, doi:10.1016/0370-2693(91)91061-Y. [3] C. T. Hill, “Topcolor assisted technicolor”, Phys. Lett. B 345 (1995) 483,
doi:10.1016/0370-2693(94)01660-5, arXiv:hep-ph/9411426. Updates in arXiv:hep-ph/9911288.
[4] S. Weinberg, “Implications of dynamical symmetry breaking”, Phys. Rev. D 13 (1976) 974, doi:10.1103/PhysRevD.13.974.
[5] CMS Collaboration, “Measurement of the t¯t Production Cross Section in pp Collisions at√ s =7 TeV using the Kinematic Properties of Events with Leptons and Jets”, Eur. Phys. J. C 71 (2011) 1721, doi:10.1140/epjc/s10052-011-1721-3,
arXiv:hep-ph/1106.0902.
[6] CMS Collaboration, “Measurement of the tt Production Cross Section in pp Collisions at 7 TeV in Lepton + Jets Events Using b-quark Jet Identification”, Phys. Rev. D 84 (2011) 092004, doi:10.1103/PhysRevD.84.092004, arXiv:hep-ph/1108.3773. [7] CMS Collaboration, “Measurement of the t¯t production cross section in pp collisions at√
s = 7 TeV with lepton+jets final states”, (2012). arXiv:hep-ex/1212.6682. Submitted to Phys. Lett. B.
[8] CMS Collaboration, “Measurement of the tt production cross section in pp collisions at√ s=7 TeV in dilepton final states containing a τ”, Phys. Rev. D 85 (2012) 112007, doi:10.1103/PhysRevD.85.112007, arXiv:hep-ex/1203.6810.
[9] CMS Collaboration, “Measurement of the t¯t production cross section in the dilepton channel in pp collisions at√s = 7 TeV”, (2012). arXiv:hep-ex/1208.2671. Submitted to JHEP.
[10] J. Alwall et al., “MadGraph v5: going beyond”, JHEP 06 (2011) 128, doi:10.1007/JHEP06(2011)128, arXiv:1106.0522.
[11] S. Frixione and B. R. Webber, “Matching NLO QCD computations and parton shower simulations”, JHEP 06 (2002) 29, doi:10.1088/1126-6708/2002/06/029, arXiv:hep-ph/0204244.
[12] S. Alioli et al., “NLO single-top production matched with shower in POWHEG: s- and t-channel contributions”, JHEP 09 (2009) 111,
doi:10.1088/1126-6708/2009/09/111, arXiv:0907.4076.
[13] S. Alioli et al., “A general framework for implementing NLO calculations in shower Monte Carlo programs: the POWHEG BOX”, JHEP 06 (2010) 043,
doi:10.1007/JHEP06(2010)043, arXiv:1002.2581.
[14] E. Re, “Single-top Wt-channel production matched with parton showers using the POWHEG method”, Eur. Phys. J. C 71 (2011) 1547,
22 References
[15] V. Ahrens et al., “Renormalization-group improved predictions for top-quark pair production at hadron colliders”, (2010). arXiv:hep-ph/1003.5827.
[16] N. Kidonakis, “Next-to-next-to-leading soft-gluon corrections for the top quark cross section and transverse momentum distribution”, Phys. Rev. D 82 (2010) 114030, doi:10.1103/PhysRevD.82.114030, arXiv:hep-ph/1009.4935.
[17] N. Kidonakis, “The top quark rapidity distribution and forward-backward asymmetry”, Phys. Rev. D 84 (2011) 011504(R), doi:10.1103/PhysRevD.84.011504,
arXiv:1105.5167.
[18] CMS Collaboration, “The CMS experiment at the CERN LHC”, JINST 03 (2008) S08004, doi:10.1088/1748-0221/3/08/S08004.
[19] J. Pumplin et al., “New generation of parton distributions with uncertainties from global QCD analysis”, JHEP 07 (2002) 012, doi:10.1088/1126-6708/2002/07/012, arXiv:hep-ph/0201195.
[20] T. Sj ¨ostrand, S. Mrenna, and P. Skands, “PYTHIA 6.4 physics and manual”, JHEP 05 (2006) 026, doi:10.1088/1126-6708/2006/05/026, arXiv:hep-ph/0603175. [21] M. L. Mangano et al., “Matching matrix elements and shower evolution for top-quark
production in hadronic collisions”, JHEP 01 (2007) 013,
doi:10.1088/1126-6708/2007/01/013, arXiv:hep-ex/0611129.
[22] S. Frixione, P. Nason, and C. Oleari, “Matching NLO QCD computations with parton shower simulations: the POWHEG method”, JHEP 11 (2007) 070,
doi:10.1088/1126-6708/2007/11/070, arXiv:hep-ph/0709.2092.
[23] R. Field, “Min-bias and the underlying event at the LHC”, Acta Physica Polonica B 42 (2011) 2631, doi:10.5506/APhysPolB.42.2631.
[24] S. Agostinelli et al., “GEANT4– a simulation toolkit”, Nucl. Instrum. Meth. A 506 (2003) 250, doi:10.1016/S0168-9002(03)01368-8.
[25] N. Kidonakis, “Next-to-next-to-leading-logarithm resummation for s-channel single top quark production”, Phys. Rev. D 81 (2010) 054028,
doi:10.1103/PhysRevD.81.054028, arXiv:hep-ph/1001.5034.
[26] N. Kidonakis, “Next-to-next-to-leading-order collinear and soft gluon corrections for t-channel single top quark production”, Phys. Rev. D 83 (2011) 091503,
doi:10.1103/PhysRevD.83.091503, arXiv:hep-ph/1103.2792.
[27] N. Kidonakis, “Two-loop soft anomalous dimensions for single top quark associated production with W- or H-”, Phys. Rev. D 82 (2010) 054018,
doi:10.1103/PhysRevD.82.054018, arXiv:hep-ph/1005.4451.
[28] J. M. Campbell, R. K. Ellis, and C. Williams, “Vector boson pair production at the LHC”, JHEP 07 (2011) 018, doi:10.1007/JHEP07(2011)018, arXiv:1105.0020.
[29] A. D. Martin et al., “Parton distributions for the LHC”, Eur. Phys. J. C 63 (2009) 189, doi:10.1140/epjc/s10052-009-1072-5, arXiv:0901.0002.
[30] G. Corcella et al., “HERWIG 6.5: An event generator for hadron emission reactions with interfering gluons (including supersymmetric processes)”, JHEP 01 (2001) 010,
References 23
[31] CMS Collaboration, “Particle–Flow Event Reconstruction in CMS and Performance for Jets, Taus, and EmissT ”, CMS Physics Analysis Summary CMS-PAS-PFT-09-001, (2009). [32] CMS Collaboration, “Commissioning of the Particle-Flow Reconstruction in
Minimum-Bias and Jet Events from pp Collisions at 7 TeV”, CMS Physics Analysis Summary CMS-PAS-PFT-10-002, (2010).
[33] M. Cacciari, G. P. Salam, and G. Soyez, “The catchment area of jets”, JHEP 04 (2008) 005, doi:10.1088/1126-6708/2008/04/005, arXiv:0802.1188.
[34] CMS Collaboration, “Determination of jet energy calibration and transverse momentum resolution in CMS”, JINST 06 (2011) P11002,
doi:10.1088/1748-0221/6/11/P11002, arXiv:1107.4277.
[35] M. Cacciari, G. P. Salam, and G. Soyez, “The anti-ktjet clustering algorithm”, JHEP 04
(2008) 063, doi:10.1088/1126-6708/2008/04/063, arXiv:hep-ph/0802.1189. [36] CMS Collaboration, “b-Jet Identification in the CMS Experiment”, CMS Physics Analysis
Summary CMS-PAS-BTV-11-004, (2011).
[37] CMS Collaboration, “Missing transverse energy performance of the CMS detector”, JINST 06 (2011) P09001, doi:10.1088/1748-0221/6/09/P09001,
arXiv:1106.5048.
[38] CMS Collaboration, “Measurement of the t¯t production cross section and the top quark mass in the dilepton channel in pp collisions at√s =7 TeV”, JHEP 07 (2011) 049, doi:10.1007/JHEP07(2011)049, arXiv:1105.5661.
[39] J. d’Hondt et al., “Fitting of event topologies with external kinematic constraints in CMS”, CMS Note 2006-023, (2006).
[40] D0 Collaboration, “Measurement of the top quark mass using dilepton events”, Phys. Rev. Lett. 80 (1998) 2063, doi:10.1103/PhysRevLett.80.2063,
arXiv:hep-ex/9706014.
[41] CMS Collaboration, “Measurement of the inclusive W and Z production cross sections in pp collisions at√s = 7 TeV with the CMS experiment”, JHEP 04 (2008) 007,
doi:10.1007/JHEP10(2011)007, arXiv:1108.0566.
[42] CMS Collaboration, “Measurement of the t¯t production cross section and the top quark mass in the dilepton channel in pp collisions at√s = 7 TeV”, JHEP 07 (2011) 049, doi:10.1007/JHEP07(2011)049, arXiv:hep-ph/1105.5661.
[43] TOTEM Collaboration, “First measurement of the total proton-proton cross section at the LHC energy of√s =7 TeV”, Europhys. Lett. 96 (2011) 21002,
doi:10.1209/0295-5075/96/21002, arXiv:hep-ex/1110.1395.
[44] M. Botje et al., “The PDF4LHC working group interim recommendations”, (2011). arXiv:hep-ph/1101.0538.
[45] L. Hung-Liang et al., “New parton distributions for collider physics”, Phys. Rev. D 82 (2010) 074024, doi:10.1103/PhysRevD.82.074024, arXiv:hep-ph/1007.2241. [46] NNPDF Collaboration, “Unbiased global determination of parton distributions and their
uncertainties at NNLO and LO”, Nucl. Phys. B 855 (2012) 153,
24 References
[47] A. Hoecker and V. Kartvelishvili, “SVD approach to data unfolding”, Nucl. Instrum. Meth. A 372 (1996) 469, doi:10.1016/0168-9002(95)01478-0,
arXiv:hep-ph/9509307.
[48] V. Blobel, “An unfolding method for high energy physics experiments”, (2002). arXiv:hep-ex/0208022.
[49] F. James, “Statistical methods in experimental physics”. World Scientific, second edition, 2006.
[50] G. D. Lafferty and T. R. Wyatt, “Where to stick your data points: the treatment of measurements within wide bins”, Nucl. Instrum. Meth. A 355 (1995) 541,
25
A
Normalised Differential Cross Section Values
Table 2: Normalised differential tt cross section as a function of lepton observables in the`+jets channels: the transverse momentum of the leptons pT` and the pseudorapidity of the leptons
η`.
p`Tbin [GeV] 1/σ dσ/dp`T stat. [%] sys. [%] total [%]
30 to 35 2.25·10−2 2.4 6.1 6.6 35 to 40 2.24·10−2 2.5 3.8 4.6 40 to 45 2.12·10−2 2.5 6.0 6.5 45 to 50 1.88·10−2 2.6 3.7 4.6 50 to 60 1.50·10−2 2.1 2.2 3.0 60 to 70 1.14·10−2 2.3 3.6 4.3 70 to 80 0.90·10−2 2.5 4.3 5.0 80 to 100 0.53·10−2 2.4 3.7 4.4 100 to 120 0.27·10−2 3.3 5.6 6.5 120 to 150 0.12·10−2 3.9 5.6 6.8 150 to 200 0.04·10−2 5.8 8.5 10.3
η` bin 1/σ dσ/dη` stat. [%] sys. [%] total [%]
−2.1 to−1.8 0.83·10−1 5.4 10.0 11.4 −1.8 to−1.5 1.35·10−1 4.1 6.1 7.4 −1.5 to−1.2 1.74·10−1 3.3 8.3 8.9 −1.2 to−0.9 2.54·10−1 2.8 4.2 5.1 −0.9 to−0.6 3.03·10−1 2.4 4.2 4.8 −0.6 to−0.3 3.49·10−1 2.2 2.9 3.6 −0.3 to 0.0 3.52·10−1 2.3 3.8 4.4 0.0 to 0.3 3.68·10−1 2.3 3.2 3.9 0.3 to 0.6 3.57·10−1 2.2 3.4 4.0 0.6 to 0.9 3.11·10−1 2.3 2.2 3.2 0.9 to 1.2 2.34·10−1 2.7 4.3 5.1 1.2 to 1.5 1.95·10−1 3.2 6.8 7.5 1.5 to 1.8 1.41·10−1 4.1 5.1 6.5 1.8 to 2.1 0.77·10−1 5.4 12.8 13.9
26 A Normalised Differential Cross Section Values
Table 3: Normalised differential tt cross section as a function of b-jet observables in the`+jets channels: the transverse momentum of the b jets pb
Tand the pseudorapidity of the b jets ηb.
pbTbin [GeV] 1/σ dσ/dpbT stat. [%] sys. [%] total [%]
30 to 60 1.35·10−2 1.0 4.5 4.6
60 to 95 0.96·10−2 1.3 2.6 2.9
95 to 140 0.38·10−2 1.8 3.6 4.0
140 to 200 0.11·10−2 2.6 9.7 10.0
200 to 400 0.01·10−2 5.3 16.3 17.1
ηbbin 1/σ dσ/dηb stat. [%] sys. [%] total [%]
−2.4 to−1.5 1.01·10−1 2.1 4.2 4.7 −1.5 to−1.0 2.01·10−1 1.7 2.8 3.3 −1.0 to−0.5 2.86·10−1 1.4 2.2 2.6 −0.5 to 0.0 3.39·10−1 1.3 2.5 2.8 0.0 to 0.5 3.30·10−1 1.3 3.2 3.5 0.5 to 1.0 2.84·10−1 1.5 3.0 3.3 1.5 to 1.5 2.06·10−1 1.8 2.6 3.1 1.6 to 2.4 0.95·10−1 2.1 6.1 6.5
27
Table 4: Normalised differential tt cross section as a function of top-quark observables in the
`+jets channels: the transverse momentum of the top quarks ptT, the rapidity of the top quarks yt, the transverse momentum of the top-quark pair ptt
T, the rapidity of the top-quark pair ytt,
and the invariant mass of the top-quark pair mtt.
ptTbin [GeV] 1/σ dσ/dptT stat. [%] sys. [%] total [%]
0 to 60 4.54·10−3 2.5 3.6 4.4 60 to 100 6.66·10−3 2.4 4.9 5.5 100 to 150 4.74·10−3 2.4 3.2 4.0 150 to 200 2.50·10−3 2.6 5.1 5.8 200 to 260 1.04·10−3 2.9 5.5 6.2 260 to 320 0.38·10−3 3.7 8.2 9.0 320 to 400 0.12·10−3 5.8 9.5 11.1
ytbin 1/σ dσ/dyt stat. [%] sys. [%] total [%]
−2. to−1.6 0.65·10−1 5.1 10.3 11.5 −1. to−1.2 1.73·10−1 2.9 5.9 6.6 −1. to−0.8 2.62·10−1 2.8 4.1 5.0 −0. to−0.4 3.16·10−1 2.6 3.8 4.6 −0. to 0.0 3.34·10−1 2.7 4.8 5.5 0. to 0.4 3.58·10−1 2.5 2.6 3.6 0. to 0.8 3.27·10−1 2.5 5.2 5.8 0. to 1.2 2.56·10−1 2.7 5.0 5.7 1. to 1.6 1.68·10−1 3.0 5.7 6.4 1. to 2.5 0.64·10−1 5.0 7.1 8.7 ptt
T bin [GeV] 1/σ dσ/dpttT stat. [%] sys. [%] total [%]
0 to 20 1.50·10−2 4.1 11.8 12.5 20 to 45 1.21·10−2 3.5 7.0 7.8 45 to 75 0.58·10−2 3.8 9.2 10.0 75 to 120 0.26·10−2 4.3 14.0 14.6 120 to 190 0.10·10−2 4.5 7.8 8.9 190 to 300 0.02·10−2 6.3 18.0 19.1
yttbin 1/σ dσ/dytt stat. [%] sys. [%] total [%]
−2.5 to−1.3 0.55·10−1 6.4 10.8 12.5 −1.3 to−0.9 2.17·10−1 3.4 5.8 6.7 −0.9 to−0.6 3.12·10−1 3.6 4.4 5.7 −0.6 to−0.3 4.00·10−1 3.1 3.3 4.5 −0.3 to 0.0 4.35·10−1 3.1 4.1 5.1 0.0 to 0.3 4.69·10−1 2.8 3.8 4.8 0.3 to 0.6 3.94·10−1 3.1 5.9 6.7 0.6 to 0.9 3.17·10−1 3.4 4.7 5.8 0.9 to 1.3 2.22·10−1 3.3 5.8 6.6 1.3 to 2.5 0.50·10−1 6.8 9.7 11.9
mttbin [GeV] 1/σ dσ/dmtt stat. [%] sys. [%] total [%]
0 to 345 - - - -345 to 400 4.81·10−3 5.2 9.7 11.1 400 to 470 4.60·10−3 5.0 8.4 9.8 470 to 550 2.46·10−3 5.2 10.2 11.4 550 to 650 1.14·10−3 5.6 10.6 12.0 650 to 800 0.43·10−3 6.2 8.3 10.3 800 to 1100 0.99·10−4 7.1 20.0 21.2 1100 to 1600 0.14·10−4 13.5 19.4 23.7