D
EMAND
R
ESPONSIVE
T
RANSPORTATION
FOR A SUSTAINABLE MOBILITY IN
M
ATOSINHOS
G
ONÇALON
EVES DEL
IMADissertação submetida para satisfação parcial dos requisitos do grau de
MESTRE EM ENGENHARIA CIVIL —ESPECIALIZAÇÃO EM PLANEAMENTO URBANO
Orientador: Professora Doutora Cecília do Carmo Ferreira da Silva
Coorientador: Arquiteto Jorge Manuel Andrade Pereira
Tel. +351-22-508 1901 Fax +351-22-508 1446 [email protected]
Editado por
FACULDADE DE ENGENHARIA DA UNIVERSIDADE DO PORTO
Rua Dr. Roberto Frias 4200-465 PORTO Portugal Tel. +351-22-508 1400 Fax +351-22-508 1440 [email protected] http://www.fe.up.pt
Reproduções parciais deste documento serão autorizadas na condição que seja mencionado o Autor e feita referência a Mestrado Integrado em Engenharia Civil - 2015/2016 -
Departamento de Engenharia Civil, Faculdade de Engenharia da Universidade do Porto, Porto, Portugal, 2016.
As opiniões e informações incluídas neste documento representam unicamente o ponto de vista do respetivo Autor, não podendo o Editor aceitar qualquer responsabilidade legal ou outra em relação a erros ou omissões que possam existir.
Aos meus pais, Luísa e Jorge, e ao meu irmão, João.
Be water my friend. Bruce Lee
i
ACKNOWLEDGEMENTS
Em primeiro lugar gostaria de agradecer à minha orientadora Professora Doutora Cecília Silva, por toda a ajuda e tempo dispensado a guiar-me. Não foi um percurso fácil para mim e sem esta ajuda essencial a realização deste trabalho teria sido muito mais complicada. A minha gratidão estende-se ao coorientador, o Arquiteto Jorge Pereira, e a toda a Câmara Municipal de Matosinhos, pela oportunidade e disponibilidade fornecida. O estágio realizado foi uma importante experiência profissional para o meu desenvolvimento pessoal.
Agradeço à minha familia por toda a minha vida até este momento. Nunca me deixam sentir sozinho, sei que posso contar com vocês para o que for preciso. Tudo o que tenho deve-se a vocês e aos muitos sacrificios que sei ter causado. Obrigado.
A todos os meus amigos, aqueles do passado, aos presentes e aos que ainda virão, um obrigado. Foi através de todas as experiências vividas convosco que sou a pessoa que existe hoje.
iii
RESUMO
O sistema de transportes públicos tradicional é essencial para responder às necessidades de mobilidade da população. Porém, por vezes, esses sistemas de transportes públicos convencionais não são adequados, nem sustentáveis, para responder/atuar em certas situações ou locais. É neste enquadramento que surgem os transportes flexíveis e todas as suas nuances, incluindo o tema desta dissertação, o transporte a pedido (DRT).
O objectivo desta dissertação é estudar a realidade atual dos DRT, apurar características e indicadores que permitam encontrar oportunidades de aplicação para os mesmos. A estratégia para este trabalho foi a seguinte: desenvolvimento da revisão de literatura, estudo de casos reais de aplicações dos transportes fléxiveis, estudo do município de Matosinhos, tanto da população como do sistema de transportes públicos e, finalmente, encontrar oportunidades de aplicações para os DRT no local.
No final, foi possível encontrar oportunidades de aplicação para diferentes tipos de DRT. Este é um trabalho académico que não procura dar soluções pormenorizadas e específicas. Esta informação pode servir de base para futuramente, com recurso a estudos financeiros, criar novos serviços de transportes adequados à realidade de Matosinhos.
Esta dissertação permitiu perceber que os DRT tem um potencial real para oferecer soluções de mobilidade sustentáveis, onde o transporte público tradicional não consegue, aumentando a eficiência do uso de recursos disponíveis.
PALAVRAS-CHAVE: Transportes flexíveis, transporte a pedido, transportes públicos, transportes sustentáveis, planeamento de transportes.
v
ABSTRACT
The traditional public transport system is essential to answer to the mobility needs of the population. Although, sometimes, those conventional public transport systems are not as adequate, or sustainable to respond/act in certain situations or places. It is with this mindset that flexible transports and all their subtleties appear, including the focus of this thesis, demand responsive transports (DRT).
The objective of this thesis is to study the current reality of DRT, find characteristics and indicators that allow to find application opportunities for them. The strategy of this work was as follows: development of literature review, analysis of real case studies of flexible transport application, study of the municipality of Matosinhos, both population and public transports, and lastly, finding opportunities of application for DRT in Matosinhos.
In the end, it was possible to find opportunities of applications for different types of DRT. This is an academic work that does not try to find detailed and specific solutions. This information can serve as a basis for future works, with extra financial studies, create new transport services adequate for the Matosinhos reality.
This dissertation allowed to understand that DRT have real potential to offer sustainable mobility solutions where traditional public transport cannot, increasing the efficiency of use of available resources.
KEYWORDS:Flexible transports services, demand responsive transports, public transports, sustainable transports, transport planning.
vii INDEX ACKNOWLEDGEMENTS ...i RESUMO ... iii ABSTRACT ... v
1. Introduction
... 11.1. THE NEED FOR SUSTAINABLE TRANSPORT SOLUTIONS... 1
1.2. OBJECTIVES ... 3 1.3. METHOD ... 4 1.4. STRUCTURE ... 4
2. DRT- Into detail
... 5 2.1.DRT TYPES ... 5 2.2.ORGANIZATION OF A DRT SERVICE ... 82.3. CHALLENGES AND DIFFICULTIES ... 12
2.4.DRT IN PORTUGAL ... 14 2.5.DRTTARGETS ... 15 2.6.DRTCASE STUDIES ... 18 2.6.1.DRTCASES ... 18 2.6.2.FLIPPERPROJECT ... 21
3. Characterization of Matosinhos
... 25 3.1.POPULATION ... 26 3.1.1.THE YOUTH ... 27 3.1.2. THE ADULTS ... 29 3.1.3.THE ELDERLY ... 293.1.4.DISABLED OR DISADVANTAGED RESIDENTS ... 31
3.2.PUBLIC SERVICES ... 32
3.2.1EDUCATION... 32
3.2.2.HEALTH SERVICES ... 34
3.2.3.SUPERMARKETS AND SHOPPING CENTRES ... 36
viii
3.4.PUBLIC TRANSPORTATION SYSTEM ... 41
3.4.1.MUNICIPAL BUS SERVICES ... 42
3.4.2.INTERMUNICIPAL BUS SERVICES ... 43
3.4.3.METRO ... 45
3.5.POTENTIAL TRAVEL TIME ... 47
3.5.1.EDUCATION ... 47
3.5.2.HEALTH ... 49
3.5.3.EMPLOYMENT ... 51
4. Analysis and opportunities for DRT
... 534.1.ANALYSIS ... 53 4.1.1POPULATION ... 53 4.1.2.PUBLIC SERVICES ... 53 4.1.2.1.EDUCATION ... 54 4.1.2.2.HEALTH ... 54 4.1.2.3.SHOPPING ... 54 4.2.OVERVIEW ... 54
4.2.1.POPULATION AND PUBLIC SERVICES ... 54
4.2.2.PUBLIC TRANSPORTATION SYSTEM ... 55
4.3.DRT–LOOKING FOR OPPORTUNITIES ... 58
4.3.1.NETWORK DRT ... 58
4.3.1.1.LATE-NIGHT TRANSPORTATION ... 58
4.3.1.2.AREAS WITHOUT PT ... 59
4.3.1.3.TRANSPORTATION FOR THE ELDERLY AND DISABLED ... 60
4.3.2.INTERCHANGE DRT ... 61
4.3.2.1.LATE-NIGHT TRANSPORTATION ... 61
4.3.3.DESTINATION SPECIFIC DRT ... 62 4.3.3.1.HOSPITALS ... 62 4.3.3.2.EDUCATION ... 63 4.3.3.3.SHOPPING ... 63 4.3.3.4.AIRPORT TRANSPORT ... 63 4.3.3.5.COMMUTERS ... 63 4.3.4.SUBSTITUTE DRT ... 64
ix
5. Conclusion
... 655.1.CONCLUSION ... 65 5.2.FURTHER DEVELOPMENTS AND RECOMMENDATIONS ... 66
ACRONYMS
ADA – Americans with Disabilities Act CMM – Câmara Municipal de Matosinhos DRT – Demand Responsive Transports
FEUP – Faculdade de Engenharia da Universidade do Porto FTS – Flexible Transportation Services
GIS – Geographic Information System
IMTT – Instituto da Mobilildade e dos Transportes INE – Instituto Nacional de Estatística
PT – Public Transports
SIGGESC – Sistema de Informação Geográfica de Gestão de Carreiras STCP – Sociedade de Transportes Coletivos do Porto
1
1
INTRODUCTION
This dissertation was developed during the Master in Civil Engineering course at Faculdade de Engenharia da Universidade do Porto (FEUP), inserted in the area of Urban Planning. The first chapter introduces the thematic, followed by the objectives of the work, the method and the structure of the document.1.1. The need for sustainable transport solutions
Currently, one of the problems of society lies on the population reliance on private car usage to satisfy their mobility needs. This causes several issues, environmental, social and economic, such as pollution, severe traffic congestion and social exclusion. Traditional public transports help in fighting against those problems but they are not always sustainable or the best solution. The study of new sustainable transport solutions, in all its components (Figure 1), is essential for the future of society.
Ferreira et al. (2007) describes the scenario that calls for action in the transport sector, in particular by the flexible transportation services, FTS. An ageing population with very diverse traveling patterns and behaviours makes sustainable PT systems hard to achieve. Large portions of the population, the youth, the disabled and the elderly, do not usually have access to car and rely on public transports to meet their traveling demands. In Europe the percentage of population that uses public transports is on average 17%
(source: Eurostat,
http://ec.europa.eu/eurostat/tgm/table.do?tab=table&plugin=1&language=en&pcode=tsdtr210 ). Social exclusion is a serious problem of present days that will keep affecting mainly the elderly and people living in suburban or rural areas that do not have access to private car. Without transportation, there is no way that those groups of people can be an active part of society, they will simply limit
2
themselves to a small area around their residence. Children need access to education and health facilities and the older generation should be able to use urban equipment. If there is a way of giving them that access, with flexible transportation, there is no reason not to do it, provided the service is well planned and has some degree of financial sustainability (Ramazzotti and Lois., 2009).
Figure 1: Different aspects of a sustainable transport system (source: Ramazzotti and Lois, 2009)
Sustainability has been on the discussion table in Europe for some time. The Green Paper (2007) and the White Paper (2011) discuss this theme and bring to light some important data. Urban transports are liable for 40% of CO2 emissions, and urban traffic congestion costed 1% of the European GDP per year (Commission of the European communities, 2007). By 2050 congestion will cost society an extra 50% and the accessibility difference between urban, suburban and rural locations will continue to rise. Transportation must be sustainable and currently it is not. The Green Paper (2007) and the White Paper (2011) by the European commission point the direction for a sustainable future. For an effective transportation system, all the services need to be integrated and planned. Getting all the operations working together for the improvement of the quality of the service offered is essential. Only when the quality and offer of transportation service get close to that of the private car, will the users change the mode of transportation in any significant way.
Public transportation as it is known in urban areas has close to no flexibility and is designed to serve large demands. It is with no surprise that the lack of efficient public transport services in low population and low demand areas were the main catalysts for the emergence of flexible transports and consequently demand responsive transports (DRT). Flexible transportation services (FTS) are a part of public transportation that is explored in a way that is adapted to the needs of the users, allowing flexibility in at least one of the following dimensions: route, schedule, designed stops and type of vehicle (Portuguese
3 legislation Law nº52/2015, 9th of July; Brake et al., 2006). According to Ferreira et al. (2007) FTS contains several concepts, some of them being: car sharing, carpooling, community and special needs transport and Demand Responsive Transports. The focus of this document will be the DRT.
Scheme 1.1: The place of DRT in the big picture concerning public transports.
There are references to DRT since the 70’s where they were defined as a type of transport that carried the user from its origin until an exact destination upon its request (Higgins, 1976). DRT is a category of FTS that “… provide transport “on demand” from passengers using fleets of vehicles scheduled to pick up and drop off people in accordance with their needs. DRT is an intermediate form of transport, somewhere between bus and taxi which covers a wide range of transport services ranging from less formal community transport through to area-wide service networks” (Grosso et al., 2002).
The origin of the term DRT is given to the USA when in 1970 in response to the ‘The Amendment to the Urban Mass Transportation Act’ of 1966 some innovative ideas were tried with demand responsive buses that had the purpose of serving low density areas. In the 90’s the ADA (American with Disabilities Act) brought further development and applications to the subject. In Europe, the first signs of DRT and flexible transport services appeared in France during the 70’s. The French transportation plans had in them ‘collective services with reservations’ that would only run if the minimum of four reservations was achieved. The term DRT in the United Kingdom showed up later in 1985 when shared taxis were implemented.
1.2. Objective
The objective of this work is looking into possible transport solutions, specifically demand responsive transport solutions, that can be applied in situations where traditional public transport is not sustainable. The target for this work is the municipality of Matosinhos, that will serve as an example of how to find opportunities for applications of DRT services.
The dissertation goals are:
- To gather knowledge about DRT, presenting information about their organization and characteristics;
FTS
Car sharing, carpooling, community and special needs
transport and DRT Public Transportation
4
- Fully characterize the municipality of Matosinhos in the themes that relate to DRT; - Analyse if DRT solutions are applicable to the municipality of Matosinhos.
1.3. Method
The work starts by doing a literature review about demand responsive transports. It gathers information about their possible types, organization, problems, target users, target markets and past applications. Several case studies about DRT are also visited to better know the impacts they cause, where they were implemented and why.
Following the literature review is the characterization and analysis of the municipality of Matosinhos. This analysis focuses on the data that is found to be relevant to the application of DRT services. After the analysis, comes the looking for possible opportunities of implementing DRT services in the case study of Matosinhos. This is followed by a discussion of the results, future developments and recommendations.
1.4. Structure
Chapter 2 develops the thematic of FTS and DRT. This chapter gathers knowledge about the subject of DRT services and their characteristics. This chapter covers DRT organization, challenges and problems, impacts, possible targets and case studies.
In chapter 3 the area of the municipality of Matosinhos is characterized according to relevant information for DRT services such as: its population, public services and public transport system. Chapter 4 focus is the analysis of the information gathered in chapter 3. Crossing that information with the knowledge of chapter 2 an analysis was made about possible DRT opportunities in Matosinhos. The final chapter discusses the results of the previous chapter and gives a conclusion to the work.
5
2
DRT – INTO DETAIL
This chapter starts by briefly describing different opinions about classification of DRT services. The second part of chapter 2 is about the different aspects of the organization of a DRT service followed by a section concerning possible problems of DRT services. The current situation about DRT in Portugal is also discussed. The final parts of the chapter are about DRT targets and case studies.2.1. Types of DRT
Davison et al. (2014) classifies as DRT all the services that fulfil the following conditions: the service cannot be restricted to anyone, regardless of age, social standing or disabilities; vehicles used are of low capacity (taxis, minibus); it is flexible in its schedule and route and the cost must be per passenger and not per vehicle.
DRT are a part of FTS which were mainly used to fight against social exclusion and provide transportation in areas that the public transports don’t support, such as suburban or rural areas. In their genesis, the majority of the markets for DRT were aimed at the elderly and the disabled who couldn’t pay for the existing means of transport available to them (taxis) and had no other way of reaching destinations of need (Mulley and Nelson, 2009). Nowadays DRT acts in a wider range of markets and should be an important and integrated part of the transportation system.
6
Figure 2.1: Geographical distribution of DRT services (source: Laws et al., 2009)
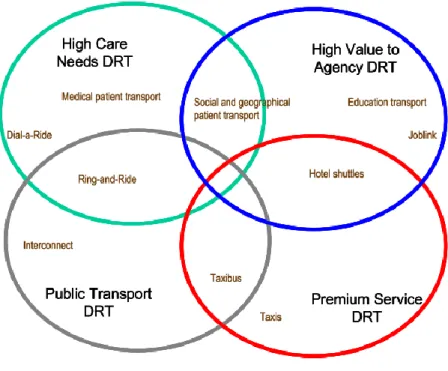
Derek Halden Consultancy (2006) splits the DRT in four categories (Figure 2.2): - ‘High care needs’ that include door-to-door services mainly health related;
- ‘Best value solutions for low demand public transport’ which act in low demand areas, usually rural or suburban places and offer better services than the traditional PT;
- ‘Premium value services’ such as airport shuttles and time sensitive services, cost to user is a less important issue in this case;
- ‘High value to agency services’ take care of some demands of society, such as education transport and access to work place.
7
Figure 2.2: DRT Markets (source: Derek Halden Consultancy, 2006)
As can be observed, DRT acts in the areas that PT cannot reach or is insufficient such as low density areas, times of the day that demand is low (between 00:00 and 6:00) or niche markets. For this reason, these types of services are not always profitable but should be encouraged for the value they bring fighting against social exclusion, reducing environmental impacts of transports.
Enoch et al. (2004) opts to split DRT services in four classes:
- ‘Interchange DRT’ are the services that feed the existing fixed public transport routes. This type of service should have integrated timetables with connecting services and if possible a way of buying both tickets, for DRT and PT after interchange, together. The service has to guarantee connections and be reliable. If it fails to arrive in time the journey back home should be guaranteed. Normally it has prices similar to traditional bus.
- ‘Network DRT’. This type of DRT is found operating, instead of the PT services, at low demand times and in low demand locations. They serve to complete the transportation network and not only to link the existing PT. Network DRT may charge more than traditional PT, if appropriate, for example for premiums and door-to-door services.
- ‘Destination-specific DRT’ were made to bring people to specific locations such as airports and hotels where traditional PT would not work. Partnerships between the authority and the ‘location’ are encouraged. It has the advantage of knowing the destiny or origin of the trip since its constant. Users are either willing to play extras (airport shuttles) or subject to subsidies (Healthcare transport). No need for schedules tailored according to PT or integration in the network.
- ‘Substitute DRT’ happens where the DRT replaces completely or almost completely the traditional PT. This service is the hardest to explain to users and is mostly seen in rural areas and small settlements.
8
Some connections can be seen between the two different classifications, ‘Premium value services’ has a similar function to ‘Destination-specific DRT’ and ‘Best value solutions for low demand public transport’ is similar to ‘Network DRT’.
2.2. Organization of a DRT service
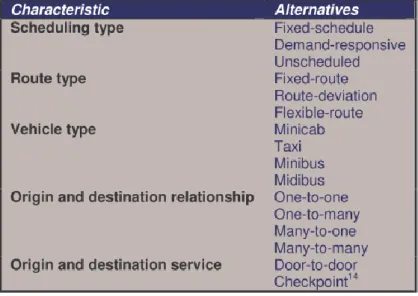
To fully characterize a DRT service it is necessary to consider its degree of flexibility and the concepts of route and schedule, booking, intermodal integration and vehicle allocation (Ambrosino et al., 2004). This idea is very similar to the way Enoch et al., (2004) opts to categorize DRT operations. The author categorizes DRT services by having the following characteristics, which differ between services, scheduling type, route type, vehicle type, origin and destination relationship, origin and destination service (table 2.2). Choices inside all of those characteristics have to be made to fully define a DRT service.
Concerning routes, stops and schedules there are several options. They can be pre-defined or partially defined, can allow for detours, can have pre-defined stops along a corridor or area or act in a general area. DRT can be a substitution service and/or complementary service. It can have special fares or use the same fares as local PT. Vehicle and resource allocation can be pre-defined or dynamic according to demands, one example would be having several sizes of vehicles according to the number of trip requests. The level of technology used can vary, it can range from low tech to high tech service (IMTT, 2015).
Table 2.2: DRT characteristics (source: Enoch et al., 2004)
Type of scheduling is one of the big decisions to take when making a new DRT service. Should the service only be available when there is demand or during a fixed-schedule? Choosing the wrong option can be the difference between success and failure. If a DRT operation has a more free and flexible schedule it will be more enticing for the users. One of the major characteristics that make people use private car it is its liberty and freedom of choice of when to use it.
9 The level of flexibility in routes is highly linked with demand, land use and road network. (Enoch et al., 2004). To give a better idea of route and scheduling types available, Ambrosino et al., (2004) manages to pass that information with some scenarios examples. The first scenario has a predefined route with a schedule that is part fixed and extra stops that are only used if there is demand. One problem that might arise with this type of service is the scheduling that is prefixed. For example, if there is demand for the extra non-fixed stops, the time of arrival in the fixed stops will change too. The completely black squares are stops that are predefined and are always served with fixed schedule. The white squares represent predefined stops with fixed schedule that only have service if there is demand. The circles are stops that only are served when there is demand and the ‘house’ symbol represents stops that can be anywhere in the service area, for example a house address or any point of interest.
Figure 2.3: Scenario 1 (source: Ambrosino et al., 2004)
The second scenario uses a route that follows a main corridor that is fixed and allows for deviations of that corridor.
Figure 2.4: Scenario 2 (source: Ambrosino et al., 2004)
The deviations to the route only happen when requested and are made to places within short distances of the main corridor. One aspect to have in mind when planning this kind of service is adjusting the schedule to consider the increased travel time when there are deviations.
10
Figure 2.5: Scenario 3 (source: Ambrosino et al., 2004)
In scenario 3 there is a main corridor with few pre-defined stops that have scheduled service and several pre-defined stops that are only used if there is demand. To comply with the schedule in the stops that are always used there should be some margins that take into consideration the possibility of serving extra stops on demand. When there are a lot of extra stops, the service will lose quality regarding the speed of service. There exists the possibility of removing some of the predefined stops and do the service only taking demand in consideration.
Figure 2.6: Scenario 4 (source: Ambrosino et al., 2004)
The fourth service option is area based, it can have one predefined stop with fixed schedule or no fixed schedule. When there is not any predefined schedule the service will be totally dependent on the demand and be more similar to a traditional taxi. If the possibility of reserving the trip with some anticipation is available, a more optimized route can be made so that multiple users can be served at the same time. Without pre-reservations the vehicle will make more trips for the same number of users, making the service a hard one to maintain economically.
11
Figure 2.7: Scenario 5 (source: Ambrosino et al., 2004)
The last scenario is similar to the fourth. The main difference is the type of stop, in this scenario the stops can be any kind of place, in an area, that the user demands, like houses, points of interest… Several combinations can be made between the services described above. Each situation must be analysed carefully to find out which service, or combination of services, is more adequate to its characteristics. There is not one solution that can be applied to every case. The degree of route flexibility is an important choice that must be made based on the level of demand and its spatial distribution. Processing user requests for trips can be done having several criteria in mind. Some examples would be: using the least number of vehicles, driving the shorter distance possible, planning the trip so it has the least amount of risk of having schedule deviations (Ambrosino et al., 2004).
Booking is a critical part of DRT services that can be wildly different between different operations. Ambrosino et al., (2004) identified five steps in the booking process, from the request until the actual trip. It has to be kept in mind that not all services go through the same steps, several can be skipped. It is important to have a booking process that allows for efficient trip planning. If every trip has to be pre-booked the service might be losing potential clients that did not go through with the process of booking (Brake et al., 2007).
Scheme 2.1: The process of booking according to Ambrosino et al., 2004.
The first step consists on the interested user contacting the provider, with the means used by the service, (e.g. phone or internet), and giving the details of the desired trip. The details will be different depending on the type of service, some examples would be: Place of departure and destiny, time of departure and arrival, special requirements, number of users. After this first contact the service provider gives some feedback about the request, with one or more possible routes and schedules that can have a relevant time window for departure and arrival. A more defined plan for the trip is then provided and the time window is greatly diminished. With the final offer on the table the client has to confirm the trip so that finally it can be done (Ambrosino et al., 2004).
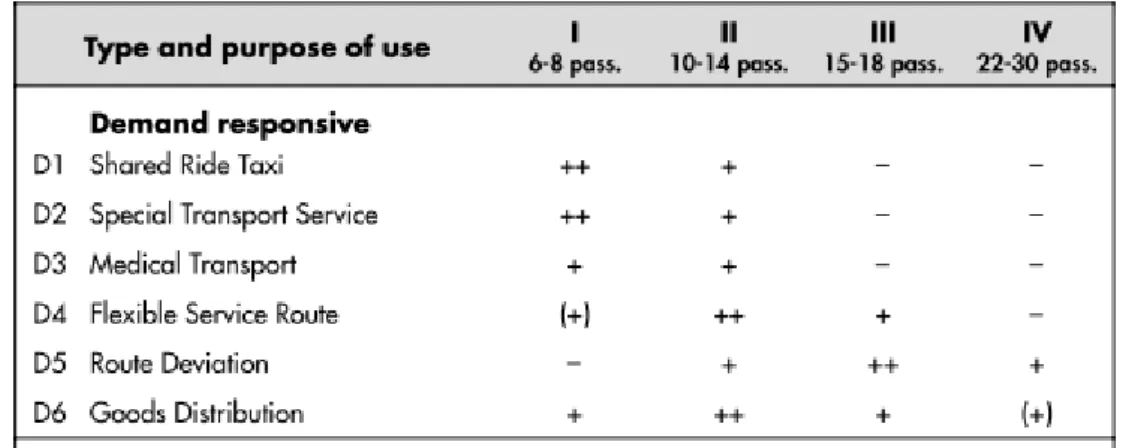
The next characteristic is vehicle type. The size of the vehicle should be chosen considering the expected demand of the service. The bigger the demand the bigger the vehicle. Keep in mind that bigger vehicles usually have a larger cost associated with them.
Customer request Preliminary trip notification Defined trip notification Booking confirmation Departure of the trip
12
When choosing the type of vehicle, it is important to keep in mind that different vehicles need different licenses to drive, so the driver choice can be a factor. Some women are uncomfortable using vehicles that have five or less seats, bigger vehicles give a more ‘official’ feeling, possibly for the similarities with the traditional bus. There are some examples of operations using more than one type of vehicle, that way they can respond to the peaks of demand that may occur during the service hours. Some types of operations that deal with disabled users, must have custom made vehicles that can accommodate their special needs (eg. Access ramps in the vehicle, space for wheelchairs) (Enoch et al., 2004)
.
Table 2.3: Appropriate vehicle size for different types of service (source: Ambrosino et al., 2004)
Moving on to ‘Origin and destination relationship’ there can be seen four choices: to-one, one-to-many, many-to-one and many-to-many. They are self-explanatory, one-to-one takes users from one origin to one destination, one-to-many takes them from one origin to multiple destinies or vice versa and finally many-to-many takes them from multiple points of origin to multiple destinies, the last one has the highest level of flexibility.
The two categories of ‘Origin and destination service’ are door-to-door and checkpoint. Door-to-door services take the user from their address of choice to the destiny they wish for, it is a very flexible service with high costs associated that are even higher in low density areas like rural locations. Checkpoint service happens when the stops happen at locations such as end of streets, pubs or other equipment instead of door-to-door.
2.3. Challenges and difficulties
DRT are often seen as a way to solve many transportation problems, such as car dependency, but some adversities, such as economic viability, technological needs and legal issues, kept it from really being a staple solution (Enoch et al., 2004). Nowadays in a reality where virtually everyone has access to the internet or a smartphone the technological difficulties seem less important. The main issue in a world marked by a recent economic crisis is the economic viability that public funds struggle to achieve. The success of DRT is also connected to the place where it is applied, a cultural barrier can exist. For example, some users in the United Kingdom were averse to sharing taxis because of the physical proximity with unknown people (Enoch et al., 2004). Users are often more comfortable with fixed
13 schedules and stops since that is what they are used to, some resistance to change is common even in some areas with poor PT services. Even operators, like the taxi sector, might hesitate to apply DRT services. In Europe, the lack of connection between the population and FTS is recognised as one of the main issues to surpass (Mulley et al., 2012). Providing the population with information about FTS should be priority, marketing can help achieve this goal.
An analysis of several DRT services that failed by Enoch et al. (2004) and another by Pots et al., (2010) allowed to gather some data and problems that came up and lead to their failure. Some of the problems: -Variation in the demand caused problems with the scheduling;
-Low demand when replacing a previous line operated by traditional PT; -If the demand was too high the operator changed back to a traditional service; -Using untested and unreliable technology;
-Using technology that is not adequate to the situation; -Lack of will and experience running DRT services; -No marketing, the service was unknown to the users;
-Offering a service that is too ambitious, too flexible without proper planning, leading to its downfall; -Service was too expensive;
-Fares too low to cover a significant part of the costs; -Conflicts with local authority.
Some thoughts about the problems that showed up in the case analysis in discussion. Partnership is a vital aspect to take into consideration when planning a DRT service. The operator of a public service should be chosen carefully and a contract made between the public and private entities. Control of the quality of the service must be ensured. Having too much flexibility is a real problem that can lead to the service getting out of hand financially. High levels of flexibility usually need a bigger demand to be viable. No service will be successful if the users do not know about it, marketing is a significant part of the future of DRT.
2.4. DRT in Portugal
Recent Portuguese legislation was made to go in the direction that the European Commission desires and update to a more actual reality. The European legislation points out the conditions in which public services can be imposed in public transportation services contracts. According to the regulation
14
1370/2007 of the European Commission every land transportation service has to have been to public procurement by the 3rd of December of 2019.
It is predicted the possibility of FTS services that feed the PT network sharing revenue with the PT provider.
Exploration of flexible transportation services can be made in one or more of the options given by the legislation (Article 34º, Law nº52/2015):
-Total or partial flexibility regarding the definition of stops, routes, frequency and schedules of the service;
-Flexibility in the capacity and characteristics of the vehicles; -Existence of solicitation or reservation systems by the passenger; -Existence of special fares;
-Exploration of the service using resources related to education transports; -Exploration of the service using taxi transportation;
-Exploration of the service using rent a car services with or without driver, taking in consideration the respective legislation.
The Portuguese legislation refers that FTS are put into use taking into consideration the existing PT network. If the possibility to integrate, or articulate, FTS into the PT of the targeted area exists, it should be taken. FTS can be applied to areas that are already being explored by an exclusive operator and if that operator shows no interest in that particular service, a deal to modify the ruling contract should be made. If there is no agreement between the FTS provider and the exclusive operator, the transportation authority can intervene and work to achieve a new contract to provide the proposed service.
The minimum services are described in the same document, those have to be reached by the 3rd of December of 2019. These minimum objectives can be disregarded, with proper justification, if the available resources do not allow it. Even when the minimum goals are achieved they may not be enough to satisfy the needs of a location. The responsible authority has to analyse each situation and find out the real needs of the users.
In locations with more than 40 residents there should exist access to FTS that ensures the connection to the municipality and the main public services. For suburban and rural locations with more than 40 residents there must assured one trip to the maincenter of the municipality from the location of origin and one trip, in the afternoon peak, back to the starting location. Between two maincenters of different municipalities at least one trip in the morning and one in the afternoon, both ways, should be provided. There are comfort requirements, regarding connections and interchange to others transports, with the objective of providing a timely and convenient interchange. Inside an urban perimeter there is not a
15 maximum number of interchanges but the waiting time cannot exceed 15 minutes. When the trip has both origin and destination inside the same maincenter of the municipality the maximum number of transfers is one with a time of waiting under 30 minutes. Trips between a local and a maincenter of the municipality the number of interchanges cannot be more than one and the waiting time inferior to 15 minutes.
2.5. DRT Targets
Filling the voids left by the PT and creating a sustainable transport network is the general function of DRT. To achieve this goal an analysis must be made on several points. According to Derek Halden Consultancy (2006) the starting point should be the user. The target population most likely already has an idea of what the problems are and what they need. When planning a DRT service, it is important to clearly define the goals, social, economic or geographical, target user and type of demand (Davison et al., 2014; Ambrosino et al., 2004).
An example of a social goal would be making a service to give a way for people living in remote areas to join the community. Economic motivator can simply be the need to replace a traditional PT that is not financially sustainable. A geographical objective would be to increase access, from and to, remote rural areas.
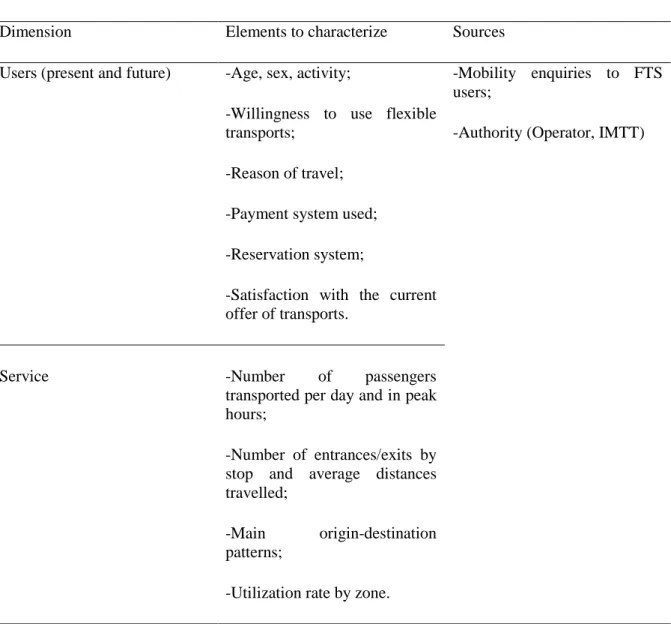
The Portuguese document by Seabra, M. I. et al. (2011a) gives us some information on the elements that should be gathered and analysed about the possible demand for DRT (table 2.4). Enquiries should be made to the population to fully characterize possible users according to age, sex, activity, their willingness to use DRT and their demands. About the service several metrics should be known, such as the number of passengers transported per day, number of entries/exits in each stops, average distances per trip and main origin-destination patterns.
16
Dimension Elements to characterize Sources
Users (present and future) -Age, sex, activity;
-Willingness to use flexible transports;
-Reason of travel; -Payment system used; -Reservation system;
-Satisfaction with the current offer of transports.
-Mobility enquiries to FTS users;
-Authority (Operator, IMTT)
Service -Number of passengers
transported per day and in peak hours;
-Number of entrances/exits by stop and average distances travelled;
-Main origin-destination patterns;
-Utilization rate by zone.
Table 2.4: DRT demand analysis (adapted from Seabra, M. I. et al. 2011a)
Characterizing the target area is vital. The UK Community Transport Association good practices guide for DRT services (2003) and Ferreira et al. (2007) mark the following data as a requisite to analyse transport needs: Definition of the boundaries of the study area, socio-economic characteristics, complete analysis of existing PT, existing unmet demands and groups of concern.
A survey made by Davison et al., (2014) to community transport operators and governmental organizations, allowed to know the main reasons to install a DRT service. One of the reasons was the rural aspect of an area, where the population is spread, in several small clusters, that traditional PT cannot serve in a sustainable way. Another great motivator for DRT is the slice of population that cannot reach PT either because of reduced physical mobility, like the elderly or disabled, or because they do not have services available nearby.
Davison et al., (2012) identified several markets where DRT is present and successful and other less certain markets that have potential. Established markets are the ones that gave birth to DRT such as services for the ones without access to car or PT, health related transports, rural transportation, users with limited mobility, special education needs transport and shopping trips. The less safe markets are
17 the ones that exist but need more time to establish themselves. Examples of these services are: airport links for employees and travellers, job link offers, services for tourists in rural areas.
Potts et al. (2010), believes that the types of service with the most potential for DRT are services for the youth and the elderly (table 2.5). According to the article connecting the youth to health services, shopping centres and areas used to socialize has higher potential for DRT than all of the possible services for adults. The elderly is also a high potential group when responding to demand for health, shopping, shopping for food and social trips
Table 2.5: Viability of FTS by demographics and trip motivation (source: Potts et al., 2010)
The target market should be clearly defined and studied, this study should be made along a financial study to estimate the level of sustainability of the service (commercially viable, acceptable subsidy, justifiable higher subsidy, financially unsustainable). There are some characteristics that successful services seem to have in common that Enoch et al. (2004) observed during the study made. Make the service simple and easy to understand for the user, this makes it more likely to make it appealing and successful. If the objective is to do a commercially viable service, it is likely that it will be a premium service that is less focused on social aspects, and more focused on markets that can be profitable. According to Ambrosino et al. (2004) the main expectations and needs of end users are: several destination options, wide coverage, easy access to service, service tailored for their specific needs, reliable communication with operator, easy and fast booking, reliable service concerning times, minimum detours on trips, having return trip if wished for, vehicles with space for luggage, accessibility to other modes, minimize transfers, reasonable pricing and long working hours.
Different demographics have different needs, Ferreira et al. (2007), provides information on some of their defining characteristics. The youth is more likely to walk some distance until PT stops and are more adaptable to new transports and technology. Most of them do not have their own car and so rely almost completely on PT, or on their family who might not have the means or availability to transport them.
18
Elderly population has more complicated needs. Most are retired/pensioners and may have mobility disabilities. If the elderly is a target for a DRT service, the operation needs to be specifically tailored for them. They are not willing or able to walk the same distances as the youth to reach transportation. The service should be simple and easy to use (Ferreira et al., 2007).
Another group that requires very specific needs is the disabled. The service needs to be tailored specifically for them, including special vehicles and trained personnel. DRT operation has to be reliable and comfortable so that the disabled have the confidence to use the service independently. One last special group is the unemployed one. They need reliable and affordable services, some of their destinations may not be near any stop. Discussion with business communities should be encouraged as a way of reaching solutions (Ferreira et al., 2007).
2.6. DRT case studies
In this section a review of previous cases of DRT services is made followed by a review of the FLIPPER Project and its results.
2.6.1. DRT cases
The table (2.6) contains information on 13 cases of DRT services. It is possible to pin the main purpose and type of service. As an example of this, the case of ‘Supershuttle’ is clearly a destination specific DRT and premium service. It is an example of a commercially driven DRT service that does not have a social goal as the main purpose. The special ‘premiums’ of the service show that it was tailored specifically for the demand it responds to. Another example of destination specific DRT, but with a more social objective, is the ‘Orange DRT’. This service links the users to their workplace at times where traditional PT does not offer them options, such as night time and weekends.
‘Ringbuss’ and ‘Belbus’ are a good example of Interchange DRT, their purpose is to feed the train system, linking the population to the traditional PT. Substitute DRT, as seen before, completely replaces traditional PT. ‘Personalbus’ does this, it serves areas that could not be served otherwise due to degraded/narrow streets. These last two types services have a clear social focus, but this does not mean that they cannot be sustainable or profitable.
Network DRT completely replaces the traditional PT at low demand times and locations. ‘Safety Bus’ serves students in campus during night time when there is no other PT, and ‘Shared Taxis’ (Beja) offers options for weekend mobility.
Some general observations of the cases:
-Mainly use one of three types of vehicles: taxi, minibus/shuttle or bus;
-Route is either zone based or has some predefined routes that may or may not allow detours; -Booking method, if necessary, is made generally by phone and sometimes internet;
19 -Pre-booking is almost always recommended/mandatory since it allows for a better optimization of service, for example, when there is no demand there is no service;
-The stops the service does highly depend on the type of service. A DRT that serves disabled users is likely to have door-to-door service and a service that replaces the traditional PT like ‘Taxibus’ has predefined stop locations;
-The schedule is also adapted to the type of service. While a service that acts to cover low demand times like weekend will only operate at that time, another that replaces completely the traditional PT like ‘Personal Bus’ operates almost daily;
-Objectives range from substituting PT, complementing the transport network, providing mobility to the disabled/elderly and providing destination specific services;
-Pricing is usually between traditional PT prices and below taxis.
From the results, both positive and negative, it can be observed that some services, while more sustainable than traditional public transport, are still far away from being profitable and most certainly need subsidies or sponsorships. The two cases that provide user satisfaction data give an optimistic view of DRT, most of users classified the service as good.
Many services target users that had no mobility before, many of those were not car owners (disabled, youth, elderly). Some interesting data would be information about the share of the DRT users that previously travelled by car. This would allow to understand if DRT has relevant impact on modal shift, or if it just creates extra trips. More data about the results and current state of the services studied would provide a clearer idea of what to aim for when planning DRT operations.
20
Table 2.6: Case studies characteristics.
M e th o d Ti me P o si ti ve N e ga ti ve 90 ,0 00 a n n u al p as se n ge r P as se n ge r re ve n u e c o ve re d 30 % o f th e r u n n in g co st. (1 99 3) O ra n ge D R T En o ch et a l., 2 0 0 4 P ly mo u th , D e vo n , UK M in ib u s (8 p as se n ge rs ) P re d e fi n e d r o u te P h o n e ca ll 20 mi n u te s b e fo re b u s d e p ar ts P re d e fi n e d s to p s M o n d ay to S atu rd ay : ( 20 :0 0 - 02 :0 0) ; S u n d ay ( al l d ay ) Fi gh t so ci al e xc lu si o n ca u se d b y p o o r P T in th e ar e a. T ar ge ts ma in ly n ig h t an d w e e ke n d s h if t w o rk e rs £1 ,5 f o r ge n e ra l u se rs , £ 0, 50 fo r O ra n ge s ta ff ( 20 03 ) D o o r-to -d o o r W e e kd ay s: (6 :0 0 - 19 :0 0) ; Sa tu rd ay : ( 7:0 0 - 19 :0 0) ; Su n d ay : ( 9:0 0 - 19 :0 0) D is ta n ce b as e d ( 3, 10 €; 3, 60 €; 4, 60 €) ( 20 16 ) A n ru fb u s Le e r En o ch et a l., 2 0 0 4 ; h tt p :/ /w w w .a n ru fb u s-lee r. d e/ Le e r, G e rma n y M in ib u se s Zo n e b as e d P h o n e ca ll P re d e fi n e d s to p s al o n g ma in c o rr id o r + cl o se b y p ic ku p s if fo re w ar n e d b y u se r P re d e fi n e d s to p s P re d e fi n e d s to p s an d d o o r-to -d o o r fo r d is ab le d /e ld e rl y u se rs A n yw h e re in si d e o f o p e ra ti o n z o n e R in gb u ss En o ch et a l., 2 0 0 4 H ö ö r, S kå n e , Sw e d e n B u se s Zo n e b as e d P h o n e ca ll Ca ll Co n n e ct En o ch et a l., 2 0 0 4 ; h tt p :/ /w w w .li n cs in ter co n n ec t. co m/ Li n co ln sh ir e , U K M in ib u se s ma xi mu m 7 d ay s b e fo re / 1 h o u r b e fo re f o r sa me d ay b o o ki n gs 1 h o u r b e fo re b u s d e p ar ts Zo n e b as e d In te rn e t o r p h o n e 1 d ay b e fo re P e rs o n al B u s A mb ro si n o et a l., 2 0 0 4 ; V al en ti et al ., 2 0 0 1 Fl o re n ce , I ta ly 5 mi n ib u se s Zo n e b as e d ( To w n ar e a o f Ca mp B is e n zi o ) In te rn e t o r p h o n e Su b sc ri p ti o n f e e + d is ta n ce b as e d p ri ce Sa me a s re gu la r P T W e e k d ay s Fe e d in g tr ai n s ys te m M o re s u sta in ab le th an p re vi o u s tr an sp o rta ti o n 42 36 tr ip s (2 00 0) , 6 0% o f th o se w e re ma d e b y fr e e tr av e l p as s h o ld e rs ( d is ab le d a n d p e n si o n e rs ) 77 % o f u se rs g av e p o si ti ve re vi e w s, w ith o n ly 6 % o f u se rs gi vi n g n e ga ti ve r e vi e w s. T ra ve l p u rp o se w as 5 1. 8% jo b li n k, 3 1. 2% sh o p p in g an d 1 5. 2% e d u ca ti o n (2 00 4) 1 d ay p e r w e e k Li n ki n g th e r u ra l p o p u la ti o n to th e P T n e tw o rk W e e k d ay s: (7 :0 0-19 :0 0) ; Sa tu rd ay : ( 8:0 0-18 :0 0) Imp ro vi n g mo b il ity in r u ra l ar e as a n d s o me ma rk e t to w n s th at h av e p o o r P T M o n d ay to S atu rd ay Se rv e a re as th at P T w as n o t ad e q u ate f o r (n ar ro w /d e gr ad e d s tr e e ts ) Tr an sp o rte a p e d id o h tt p :/ /med io tej o .p t/ in d ex .p h p /t ra n sp o rt e- a-p ed id o M é d io T e jo , P o rtu ga l Ta xi s (4 -8 p as se n ge rs ) 1 d ay b e fo re + sh o rt w ar n in g re se rv ati o n s if th e y fi t th e tr ip p la n 2 h o u rs b e fo re tr ip 4 d if fe re n t p ri ce s d e p e n d in g o n th e le n gh t o f th e tr ip , ch e ap e r th an ta xi s b u t mo re e xp e n si ve th an tr ad iti o n al b u se s 13 li n e s P h o n e ca ll W e e k d ay s (S ch o o l a n d 's u mme r h o li d ay s' sc h e d u le ) P re d e fi n e d s to p s B e lb u s, D e L ij n A mb ro si n o et a l., 2 0 0 4 V e u rn e , W e ste rn Fl an d e rs , B e lg iu m M in ib u se s Zo n e b as e d P h o n e ca ll W e e k d ay s: (6 :0 0 - 19 :3 0) ; W e e ke n d s: (7 :3 0 - 15 :0 0) P ro vi d in g mo b il ity f o r e ve ry o n e , f e e d in g th e r ai l sta ti o n In cr e as e d mo b il ity ma in ly f o r th e e ld e rl y, th e y o u th a n d th e o n e s w ith o u t ca r. A ve ra ge s 18 tr ip s an d 55 p as se n ge rs p e r d ay ( 20 04 ) D id n o t ma n ag e to in cr e as e u sa ge o f p u b li c tr an sp o rt Se rv e a re as w ith p o o r P T se rv ic e s 81 % u se r sa ti sf ac ti o n in p il o t p ro je ct; 6 7% u se d th e s e rv ic e f o r h e al th r e as o n s; 23 % u se d th e se rv ic e to c o n n e ct w ith o th e r P T Ti ck e ts c an b e b o u gh t b e fo re h an d in s e ve ra l p la ce s (tr ai n s ta ti o n , b u s sto p s, ma ga zi n e s h o p s. .. ) W e e ke n d s A ff o rd ab le o p ti o n s fo r w e e ke n d mo b il ity n e e d s G iv e s ru ra l p o p u la ti o n tr an sp o rta ti o n w h e n /w h e re th e tr ad iti o n al P T d o e s n o t Li n h a Ec o h tt p :/ /w w w .h o ra ri o sd o fu n ch al .p t; h tt p :/ /w w w .r cc .g o v. p t/ Fu n ch al , P o rtu ga l 4 M in ib u se s (c an tr an sp o rt d is ab le d u se rs ) 3 li n e s Si gn al v e h ic le s A n yw h e re o n th e li n e s P re d e fi n e d s to p s + an yw h e re o n th e li n e s + d o o r-to -d o o r fo r d is ab le d u se rs W e e k d ay s: (7 :3 0-19 :1 5) En vi ro n me n ta l f ri e n d ly , n o g as e mi ss io n s an d lo w n o is e v e ch il e s R u ra l L if t A mb ro si n o et a l., 2 0 0 4 Ir e la n d 6 li n e s P h o n e ca ll D is ta n ce b as e d ( £1 ,5 0 u n ti l 3 mi le s; £3 u n ti l 5 mi le s; £4 ,5 0 fo r lo n ge r d is ta n ce s) In cr e as e d s af e ty f o r stu d e n ts a n d ac ce ss to c amp u s at n ig h t. N o p re -b o o ki n g 30 mi n u te s b e fo re f o r d o o r-to -d o o r se rv ic e Sa me a s re gu la r P T Si mi la r to tr ad iti o n al b u s p ri ce s, ti ck e ts c an b e b o u gh t fr o m d ri ve r o r p re vi o u sl y in th e 'B u s ce n tr al s ta ti o n ' P re d e fi n e d s to p s B u se s b ro ke d o w n a n d w e re d is co n ti n u e d , v e ry e xp e n si ve to r e p ai r Sh ar e d T ax i ht tp: // w w w .c m -beja. pt /do c s /P D F s /C idade/ P erc o r ra_a_c idade/ T ax is _201 4. pdf ; ht tp: // w w w .c m -beja. pt /v iew m unic ipio .do 2?num ero = 2823 B e ja , P o rtu ga l Ta xi s (4 -8 p as se n ge rs ) 3 li n e s P h o n e ca ll Sa fe ty B u s En o ch e t a l., 2 0 0 4 ; h tt p s: // w w w .u n io n so u th a m p to n .o rg So u th amp to n , H amp sh ir e , U K So u th amp to n M in ib u s N ame R e su lts Sc h e d u le R o u te Ty p e a n d n u mb e r o f ve h ic le s A re a O b je cti ve B o o ki n g P ri ci n g/ Ti ck e ts Sto p s P re d e fi n e d sta rti n g p o in t B e a t th e d e p ar tu re s to p N o p re -b o o ki n g Le av e s u se rs a t th e ir d o o r Te rm o p e n in g Ev e ry d ay : (2 0:0 0 - 12 :3 0) ; T h u rs d ay : (2 0:0 0 - 2:0 0) ; S u n d ay : ( 20 :0 0 - 23 :3 0) . R e vi si o n p e ri o d M o n d ay F ri d ay : ( 20 :0 0 - 6:0 0) G iv e U n iv e rs ity s tu d e n ts a sa fe a n d a ff o rd ab le w ay to ge t h o me f ro m Ca mp u s at n ig h t. 3, 65 $ o r 2, 65 $ w ith d is co u n t (2 01 6) £5 ,3 6 le ss p e r u se r o n a ve ra ge , co mp ar is o n w ith s imi la r si ze d ci ti e s (2 00 1) ; av e ra ge s 3 p as se n ge rs p e r tr ip P as se n ge r re ve n u e c o ve re d 45 % o f ru n n in g co st. ( 20 00 ) Ch e ap e r th an ta xi s A d ap te d to th e k in d o f se rv ic e it p ro vi d e s (h as w ak e u p c al ls , s p ac e fo r lu gg ag e .. .) Ta xi b u s En o ch et a l., 2 0 0 4 ; h tt p :/ /w w w .v ill e. ri mo u sk i.q c. ca /en /c it o yen s/ n av /c ir cu la ti o n /R imo u sk i b u s. h tml R imo u sk i, Q u e b e c, Ca n ad a Ta xi s 3 li n e s P h o n e ca ll 1 h o u r b e fo re d e p ar tu re 30 0 sto p s Ev e ry d ay ( 1 tr ip /h o u r o r 1 tr ip /h al f h o u r) Tr ad iti o n al P T w o u ld b e u n su sta in ab le Su p e rs h u tt le h tt p s: // w w w .s u p er sh u tt le. co .n z/ N e w Ze al an d Sh u tt le s W h o le N e w Ze al an d In te rn e t o r p h o n e N o t n e ce ss ar y b u t sa fe r to p re b o o k to gu ar an te e Th e o n ly d e fi n e d sto p is th e a ir p o rt Ev e ry d ay P ro vi d e tr an sp o rt to a n d fr o m ai rp o rts
21
2.6.2. FLIPPER Project (W right and Masson, 2011)
FLIPPER was an European project with the aim of exchanging knowledge about FTS between several European countries to improve sustainability, social, environmental and financial, of transports. There were 7 cases that were studied, each with different characteristics (density, type of service, prices…). To evaluate each case data was collected regarding target groups, target area, passengers carried, revenues, distance driven, vehicles, emissions, operating costs and subsidies.
Table 2.8 gives an overview of the target area, type of service and operational data. Something that pops out is the relation between population density and subsidy per passenger trip. As expected, services that serve areas with lower population density have higher subsidies. Subsidy per vehicle hour is consistent when related with the type of vehicle used. In the 3 cases they are used, taxis have the lowest subsidy per hour, it being of around 10€. On the other end of the spectrum there is the Volos case at 31,23€. It uses high tech vehicles specialized for the mobility impaired, which involves custom made vehicles and trained personnel.
Subsidy per vehicle km cannot be taken very seriously to assess performance because it also counts km made with an empty vehicle. If a service has vehicles doing empty runs it might appear more effective than a service for short trips with multiple passengers. Doing a ratio between subsidy per passenger km and subsidy per vehicle km an average of the occupancy can be obtained. The only cases below 1 are South Tipperary and Formenterra which indicates that these services have more trips without passengers compared with the others.
Volos South
Tipperary
Borgo Panigale
Formenterra Purbach Kastoria Almada
1,01 0,59 1,00 0,83 1,00 1,08 2,00
Table 2.7: Ratio between subsidy per passenger km and subsidy per vehicle km
Ratio of fare revenue to operating cost reveals that none of the services are financially sustainable. While higher densities increase this ratio not even the best case, Kastoria with 0,51, is close to self-sustainability. These values include the cost of acquisition of the vehicles, without those values some values increase, for example the case of Almada goes from 0,22 to 0,34.
Trip purpose can be directly related to the type of user, for example Almada has 90% of FTS users above the age of 65 so the main purpose of the trips is not work or school related, shopping and health trips dominate. The three services that use taxis show a much larger share of trips related to work and education than the services that use bus (graphic 2.1)
22
Graphic 2.1: Trip purpose (source: Wright and Masson, 2011)
Wright and Masson (2011) provides information about modal shift caused by the services (graphic 2.2), such as the percentage of the FTS users that were previously using private car, either as a passenger or driver. The best case is Borgo Pangale with 60% and the worst is Almada with 11,2%.
23 75% of the trips made in the Almada service were previously done by walking. This might point towards several aspects, like lack of car access, short trip distance or poor PT service. Knowing that most of Almada users are the elderly it is understandable this shift to the FTS service, it is more comfortable for them.
Another interesting case is the case of Kastoria, more than 3 quarters of the users do not have access to car and most do not have a driver license. Users previously mainly used other PT services, 56% of the trips are work related. This shows that workers give value to comfort, reliability and flexibility of the taxis and can afford it even if they pay a bit more.
Finally, the satisfaction levels of the FLIPPER project were quite good. The two highest satisfaction rates were in Almada and Kastoria, the same places that have the lowest subsidy per passenger. One possible explanation found by Wright and Masson, (2011) is that when the complexity and diversity of user demands increases it is harder to meet user expectations. Simple services that respond to the demands of one group of users usually meet the expectations.
24
Table 2.8: FLIPPER case studies data.
p e r p as se n ge r tr ip p e r ve h ic le h o u r p e r ve h ic le k m p e r p as se n ge r km V o lo s 3, 1 U rb an a re a; fo r mo b il ity imp ai re d ; h ig h te ch v e h ic le ; d o o r- to-d o o r M o n d ay F ri d ay : (8 :0 0-15 :0 0) 12 ,8 6 31 ,2 3 2, 9 2, 87 0, 13 2, 43 0, 18 53% So u th T ip p e ra ry 4, 1 R u ra l a re a; re str ic te d u se rs ; h ig h te ch ; mi n ib u s; d o o r- to-d o o r if d e sti n ati o n is th e h o sp ita l M o n d ay F ri d ay : (7 :3 0-18 :3 0) Ch il d re n 2 €; A d u lts 3 € 15 ,2 2 17 ,6 6 0, 6 1, 01 0, 13 1, 16 0, 41 35% B o rg o P an ig al e 10 4, 6 R u ra l a re a; o p e n to al l; ta xi s e rv ic e ; s h ar e d b o o ki n g; fu ll y fl e xi b le ; fe e d s tr ad iti o n al P T M o n d ay F ri d ay : (7 :0 0-20 :3 0) ; Sa tu rd ay : ( 7:0 0-13 :3 0) D ai ly ti ck e t - 5€ ; 4 co n se cu ti ve d ay s ti ck e t - 12 € 8, 41 9, 1 1, 68 1, 68 0, 09 1, 08 0, 15 60% Fo rme n te rr a 20 4, 1 O p e n to al l; co n n e cts ma in s e tt le me n ts ; co n tr ac te d ta xi ; f ix e d ro u te th at o p e ra te s o n d e ma n d D ai ly : ( 7:0 0-20 :0 0) Fr e e f o r th e e ld e rl y 4, 42 10 ,5 5 0, 49 0, 59 0, 27 2, 38 0, 19 44 ,2 0% P u rb ac h 27 1, 1 O p e n to al l; mi n ib u s se rv ic e ; l o w te ch ; f u ll y fl e xi b le M o n d ay F ri d ay : (5 :0 0-21 :0 0) ; Sa tu rd ay : ( 8:0 0-12 :0 0) D ai ly ti ck e t - 2€ 3, 66 18 ,5 1, 15 1, 15 0, 18 5, 05 0, 33 42 ,1 0% K as tor ia 29 8, 2 U rb an a re a; o p e n to al l; ta xi p ar tn e rs h ip ; sh ar e d b o o ki n g; fu ll y fl e xi b le D ai ly : ( 7:0 0-20 :0 0) B e tw e e n 2 € an d 6€ 2, 22 9, 53 0, 96 0, 89 0, 51 4, 29 0, 14 17 ,3 0% A lma d a 14 75 ,2 U rb an a re a; o p e n to al l; co n n e cts o ld tow n to ce n tr e a n d in te rc h an ge ; e le ctr ic b u se s; fi xe d r o u te w ith so me d e tou rs a ll o w e d ; sh ar e d b o o ki n g M o n d ay F ri d ay : (7 :0 0-19 :0 0) ; Sa tu rd ay : ( 8:0 0-13 :0 0) <2 1 & > 65 0 ,5 0€ ; A d u lts 1 € 0, 95 15 ,6 3 0, 95 0, 47 0, 22 16 ,5 1 0, 14 11 ,2 0% P as se n ge r tr ip s p e r ve h ic le h o u r CO 2 ( kg ) p e r p as se n ge r km P re vi o u s ca r u se rs Su b si d y (€ ) Ci ty P o p u la ti o n D e n si ty (r e si d e n ts /k m 2) Ch ar ac te ri sti cs P ri ce R ati o o f fa re r e ve n u e to o p e ra ti n g co st Sc h e d u le
25
3
CHARACTERIZATION OF
MATOSINHOS
Following the knowledge gathered in the literature review comes the characterization of the target area of study, Matosinhos. For the following chapter was essential the use of GIS software. This characterization targets three mains areas: Public services, population and public transports.The first step was the characterization of the population of Matosinhos. With the information from INE (‘Instituto Nacional de Estatística’) several maps were created to find out and understand how the population is spread. The characterization was made not only considering the age of the residents but also other aspects such as retired residents, employed residents, illiteracy levels and where they worked. After characterization of the population comes the characterization of public services. The collected information about public services is focused on public services that have potential for the DRT like health, education, employment centres and shopping. This allows to know how the different public services are distributed among the different areas of the territory.
Thirdly comes the study of the PT system in Matosinhos. This study is based on information provided by CMM (‘Câmara Municipal de Matosinhos’), SIGGESC and the study made by P. Pinho et al. (2016). This study covers the most used transports in Matosinhos, bus and metro. The service is studied according to spatial distribution of the lines, their frequency and schedules. The final point of analysis is the potential travel time by PT when accessing several different public services.
26
3.1. Population
The municipality of Matosinhos has an area of 62,42 km2, is located in the north-western shore of Portugal, and is a part of the NUTS II ‘Norte’ and NUTS III ‘A.M. do Porto’ (Metropolitan area of Porto). After the 2013 rearrangement of the Portuguese territory Matosinhos is organized in four parishes: Custóias, Leça do Bálio and Guifões; Matosinhos and Leça da Palmeira; Perafita, Lavra and Santa Cruz do Bispo; São Mamede de Infesta and Senhora da Hora.
Figure 3.1: Municipality of Matosinhos (source: http://www.cm-matosinhos.pt/pages/46)
The total number of residents in 2011 was 175 478 and its density 2 811,2 (residents/km2), from 2001 to 2011 the population grew around 10,5%. As can be seen in the table 3.1, most of the population belongs to the age group from 20 to 64 years old. The largest part of the population is concentrated in the urbanized southern areas and in Leça da Palmeira, with higher densities of inhabitants (map 3.1).
27 Age Nº of residents % 0-19 34207 19,5 20-64 112986 64,4 65+ 28285 16,1 Total 175478 100
Table 3.1: Population split by age group (2011).
Map 3.1: Population density (residents/km2).
3.1.1. The youth
The youth group was split into 2 groups, from age 5 to 13 and from 13 to 19. This split allows to better understand the target populations for elementary school and high school. From observing the two maps (3.2, 3.3) it is possible to conclude that both groups densities are higher in the south area, having lower densities in the remaining areas.
28
Map 3.2: Density of residents from the age 5 to 13 (residents/km2).
29
3.1.2. The adults
The adult population, from age 20 to 64, has a density distribution similar to the 14 to 19 age group, which is higher in the south (map 3.4). The adult population is the great majority of the working residents, they are the brunt of the population and the ones with the highest economic impact in the municipality.
Map 3.4: Density of residents from the age of 20 to 64 (residents/km2).
3.1.3. The elderly
Elderly resident densities follow the general pattern of the municipality. In many areas, the percentage of elderly residents is over 30%, reaching values above 50% in some of them (map 3.6). This shows that some areas of Matosinhos are severely aged and might need special attention when it comes to transport services.
30
Map 3.5: Elderly population density (residents/km2).
31
3.1.4. Disabled or disadvantaged residents
In the map 3.7 can be seen all the disabled parking places attributed by the CMM in the last years. More than 90% of them are near the place of residence of the disabled user that requested the spot. This does not give us much information regarding public transportation since these disabled users likely have private car and use it regularly to have requested a parking spot. More data like the level of disability they have, where they live and their trip demands is necessary to make any conclusions.
Map 3.7: Handicapped parking locations.
The percentage of illiterate residents is an important factor to know since those potential users can be harder to ‘convert’ to the use of unconventional transport systems like the DRT. Marketing will not be as effective on illiterate targets. The highest values of illiteracy are seen in the north and central areas of Matosinhos. Many of those areas also have high percentages of elderly population there.
32
Map 3.8: Percentage of illiteracy.
3.2. Public services
Matosinhos presents both urban characteristics in some areas and rural aspects in others. This results in a heterogenic territory with consequences caused by urban sprawling and an uncontrolled expansion in low density areas. One of these consequences is the inequality of access to public services. The locations of several equipment like schools, high schools, university, healthcare facilities, hospitals, supermarkets, shopping centres and main job centres, are marked in maps.
3.2.1. Education
Starting by education facilities, both elementary and high schools show the same pattern. Clusters of schools exist in the southern areas of Matosinhos, while in the north, residents are only served by one high school that is close and three elementary schools (maps 3.9 and 3.10). University level education is only present in the most southern areas of Matosinhos along circunvalação, in Pólo da Asprela and in the area around IPAM and ESAD (map 3.11).
33
Map 3.9: Elementary school locations.
34
Map 3.11: College level School locations.
3.2.2. Health services
Moving on to hospitals, observing the two following maps (3.12 and 3.13), the majority are also along circunvalação, the only hospital that is closer to the centre of the territory is a private one (Hospital privado da Boa Nova). Many healthcare centres are concentrated in the area around Câmara de Matosinhos. Again, the zone that is more lacking is the northern one, having only Lavra health centre and Penafiel health centre nearby. Pharmacies show the same pattern of the healthcare centres, scarce in the north.
35
Map 3.12: Hospital and healthcare services locations.
36
3.2.3. Superm arkets and shopping centres
Supermarkets are an important part of modern times consumer patterns. Only two exist in the northern part (Continente Bom Dia and Pingo Doce) compared with 10 in the area around Câmara de Matosinhos. The central part of the territory also shows a lack of supermarkets (map 3.14). There are two large shopping centres in Matosinhos, Norteshopping and Marshopping (map 3.15)
37
Map 3.15: Shopping centres locations.
3.3. Economic Panorama
As it could be expected, the areas that have the highest percentage of retired/pensioners, coincide with the areas with the highest percentage of elderly residents. Logically that map (3.16) has a stark contrast with map 3.19 that represents the percentage of employed residents. These two groups have very different needs regarding transportation. While the elderly are more concerned with the price and ease of reaching the pickup point and less about the time schedule, the commuters care about the schedule reliability of the service and less about the price.