ii
PROCESS OF CHANGE IN MANAGEMENT ACCOUNTING: A CASE
STUDY OF AN INTERNATIONAL JOINT VENTURE
Alexandra La-Salete da Silva Martins
Dissertation
Master in Management
Supervised by
Prof. Dr. João Pedro Figueiredo Ferreira de Carvalho Oliveira
2018
iii ACKNOWLEDGEMENTS
First of all, I would like to thank Professor João Oliveira for all the guidance, availability and motivation during this year. He consistently allowed this paper to be my own work, always guiding me in the right direction. I am grateful for the opportunity to work with such an inspiring and dedicated person.
I also want to thank my mother, my brother and my uncles for supporting me throughout this journey. Their positive attitude towards my success helped me to remain motivated and confident about my work.
My deepest thanks to all the staff of the companies in which this research was undertaken, whose continuous support was crucial for the conclusion of the present dissertation. In particular, I would like to express my gratitude to the Corporate Controlling department.
Finally, I want to thank all my friends for the support and conversations that definitely made this year a lot easier.
iv ABSTRACT
International joint ventures have been of interest to many researchers for a long time, especially because it is considered an important issue when it comes to the internationalization strategy of many companies. However, their shared ownership gives rise to new challenges, including with regard to its management accounting and control. The purpose of this research is to describe and have an in-depth understanding on how and why an industrial company changed its cost structure shortly after becoming an International Joint Venture. This research focuses on understanding how that need for change emerged, the key factors that affected the change process and the implementation of the change process itself. The change process is analysed using the management accounting change model originally created by Innes and Mitchell (1990) and further developed by Cobb et al. (1995) and Kasurinen (2002). Evidence suggests that the reason behind the need for management accounting change was associated with the creation of the Joint Venture, mainly for benchmarking purposes. Further, several key factors that directly influenced the cost accounting change were identified: first, the change was negatively affected by the existence of other priorities; and second, different criteria used in the plants by each plant controller also hindered the change process. Despite this, change was usually well accepted at the corporate level and that facilitated the implementation of the change process.
A refined model is suggested for investigating change processes, in which three aspects are introduced to the existing change model. It helps to analyse change with additional focus on the organisational context of the company; on the role of the leaders; and on ramifications of the change.
Keywords:
Management Control; Management Accounting Change; Cost Accounting; Cost Benchmarking; Joint Venture.
v RESUMO
As Joint Ventures Internacionais têm suscitado grande interesse para muitos investigadores há muito tempo, especialmente porque são consideradas relevantes quando se trata da estratégia de internacionalização de muitas empresas. No entanto, a sua titularidade conjunta gera novos desafios, inclusivamente no que diz respeito à sua contabilidade e controlo de gestão. O objetivo desta pesquisa é descrever e ter uma compreensão profunda sobre como e porquê que uma empresa industrial mudou a sua estrutura de custos imediatamente após se tornar uma Joint Venture Internacional. Esta pesquisa foca-se em compreender como surgiu a necessidade de mudança, os principais fatores que afetaram o processo de mudança e a implementação do próprio processo de mudança. O processo de mudança é analisado usando o modelo de mudança da contabilidade de gestão originalmente criado por Innes e Mitchell (1990) e desenvolvido por Cobb et al. (1995) e Kasurinen (2002). Evidências sugerem que a razão por trás da necessidade de mudança na contabilidade de gestão estava associada à criação da Joint Venture, particularmente para fazer benchmarking. Além disso, vários fatores-chave que influenciaram diretamente a mudança na contabilização de custos foram identificados: primeiro, a mudança foi negativamente afetada pela existência de outras prioridades; e segundo, diferentes critérios usados por cada controlador de cada fábrica também atrasaram o processo de mudança. Ainda assim, as mudanças geralmente eram bem aceites a nível corporativo e facilitavam a implementação do processo de mudança.
Palavras-Chave:
Controlo de Gestão; Mudança no Controlo de Gestão; Contabilidade de Custos; Benchmarking de Custos; Joint Venture.
vi LIST OF ABREVIATIONS
CCC – Corporate Controller Chief CD – Controlling Director
CFO – Chief Financial Officer ERP – Enterprise Resource Planning HFM – Hyperion Financial Management IJV – International Joint Venture
IT – Information Technology JV – Joint Venture
MA – Management Accounting
MAC – Management Accounting Change MTO – Make to Order
MTS – Make to Stock P&L – Profit and Loss
vii TABLE OF CONTENTS ACKNOWLEDGEMENTS ... iii ABSTRACT ... iv RESUMO ... v LIST OF ABREVIATIONS ... vi
TABLE OF CONTENTS... vii
LIST OF FIGURES... ix
LIST OF TABLES ... x
1. INTRODUCTION ... 1
2. LITERATURE REVIEW... 4
2.1. Management Accounting Change ... 4
2.2. Fundamental Concepts about Production ... 11
2.3. Fundamental Concepts about Costs ... 11
2.4. Costing Methods ... 13
2.5. Cost Allocation Methods ... 14
2.6. Cost Benchmarking ... 16
3. METODOLOGY ... 18
3.1. Case Study Methodology ... 18
3.2. Steps and techniques for collecting information ... 20
4. THE CASE STUDY ... 22
4.1. Introduction and company overview ... 22
4.2. Production Process in SA ... 23
4.3. Cost accounting practices in SA ... 24
4.4. Cost reporting ... 27
4.5. Overview of the current cost system ... 29
4.6. Current cost accounting structure in S Beta ... 30
4.7. The new cost reporting system ... 32
5. ANALYSING MANAGEMENT ACCOUNTING CHANGE AT S ALPHA ... 36
5.1. How the need for change emerged... 36
5.2. The Pilot Test ... 38
5.3. The forces of change... 40
5.4. Barriers of change... 45
5.5. Ramifications of the original change process ... 49
6. REASSESSING THE MANAGEMENT ACCOUNTING CHANGE MODEL... 52
viii
6.2. Revised Accounting Change Model ... 53
6.2.1. Organizational Context ... 54
6.2.2. Three forces of Leaders ... 56
6.2.3. Ramifications of change ... 57
7. CONCLUSIONS ... 59
7.1. Research Findings ... 59
7.3. Research limitations ... 62
7.4. Recommendations for future research ... 62
8. BIBLIOGRAPHY ... 63
ix LIST OF FIGURES
Figure 1. Accounting Change Model ... 8
Figure 2. Revised Accounting Change Model. Source: Kasurinen (2002, p. 338). ... 10
Figure 3. Production Flows and Costing systems. ... 15
Figure 4. Cost systems... 15
Figure 5. Old Industrial Production, consumption and cost sheet at SA. ... 28
Figure 6. Cost Reporting Sheet at S Beta. ... 31
Figure 7. New Industrial Production, consumption and cost sheet at SA. ... 33
Figure 8. Influencing forces on SA management accounting change. ... 41
x LIST OF TABLES
Table 1. Summary of the meetings at SA. ... 19 Table 2. Summary of barriers to change at SA. ... 46
1 1. INTRODUCTION
In the recent years, International Joint Ventures (IJV) have become very common among several industries (Meer-Kooistra and Kamminga, 2007), not only due to the technological change but also because of the increased importance of globalization. It is gaining position as an important phenomenon of corporate strategy since it helps firms to access new markets, knowledge, capabilities and resources (Beamish and Lupton, 2009). But as Barkema et al. (1997, p. 426) once stated, “Successful international joint ventures entail both learning to operate across national boundaries and learning to cooperate”, which highlights the challenge that companies face to design and sustain a compatible and consistent business plan that fits both partners. These different partners, whose interests are typically not totally aligned, must manage cooperatively their “shared” subsidiary, and this may pose a problem to management control (Kamminga et al., 2006).
On one hand, some investigation has been done covering the topic of management control on Joint Ventures, mainly reflecting the importance that it has over the IJV. Considering a dynamic point of view, Meer-Kooistra and Kamminga (2010) tried to understand the patterns of management control in a Joint Venture (JV) relationship, stating that with the support of personnel resources – the representatives on the board of the directors –, parents not only contribute with their personal knowledge and experience to the JV, but also influence the decision-making within the relationship. Using a meta-analytic approach, Xiaoyu et al. (2014) investigated the main factors that influence management control in IJV’s, concluding that higher resource contribution and equity share, tends to lead to a higher management control from parent firms. Despite this, there is still plenty of research to do about the process of change in management accounting at an organizational level, since current studies “lack explanatory detail on the manner in which these changes have occurred within their particular organizational contexts” (Innes and Mitchell, 1990, p. 3).
On the other hand, many studies published in scholarly journals paid attention to the importance that cost accounting has on companies’ strategy, namely: emphasizing the manager’s need to measure costs right in order not to distort product costs (Cooper and Kaplan, 1988); evaluating the perception of the cost system used by several companies (Hughes and Gjerde, 2003); and analysing the influence of cost accounting change on manufacturing firms’ performance (Laitinen and Erkki, 2014).
However, although many management accounting studies were conducted in organizational settings, considering JV contexts or not, there has been little research on how cost accounting
2 differences may be highlighted and pushed to change by the creation of a new alliance (Burns and Scapens, 2000; Innes and Mitchell, 1990; Ribeiro and Scapens, 2006). Burns and Scapens (2000) confirms this idea by arguing that little attention has been given to understand how those new management accounting systems have occurred or failed to occur through time. Change in management accounting is a domain of great opportunity for development, particularly for exploring and understanding why and how change has occurred within a particular company within a period of time (Ribeiro and Scapens, 2006; Innes et al.,1990; Kasurinen, 2002; Dello, 2018).
Therefore, this research provides an in-depth insight into the change of cost accounting that emerged from the creation of a partnership, including the most important factors of influence and the challenges throughout the implementation process.
To support these views, consider the following case study that portrays the recent partnership between a multinational company based in Portugal, that produces homogeneous and undifferentiated products (identified as S Alpha), and a foreign company, that is one of the largest suppliers of the same products in the world (identified as S Beta), creating a new company (identified by the fictitious acronym ‘SA’ to preserve anonymity). And as this company is carrying out an ongoing change project to switch its cost reporting structure in order to meet its partner needs, I consider the choice of this particular company, in which I have worked in the Management Control Department during the period of the study, as very pertinent. Moreover, being this company part of a wider group and having a significant presence in the world, it is a great opportunity to make contributions to management accounting change literature: first, this study considers the partnership as the factor of origin of management accounting change; second, it identifies behavioural and contextual factors that influence the cost accounting method; and third, it addresses several limitations in the current field of study and proposes alternatives to overcome those limitations.
As a consequence of the global presence of the companies involved, the need to search for the best practices across industries to improve performance and face international competition was strengthened by this new alliance; however, the lack of a common cost accounting methodology in both partners hindered the benchmarking initiative. Therefore, the need for changing the cost accounting method in the IJV rose as it was considered a key element for the comparability of performance and costs of the benchmarking project. And since management accounting research on benchmarking has been limited (Elnathan et al.,
3 1996), I consider the present study as a good example, mainly since Elnathan and Kim (1995) argued that an increasing number of firms are participating more and more in cooperative benchmarking due to the competition in today’s changing business. Elnathan and Kim (1995) also pay a particular attention to cooperative benchmarking, where firms choose to share information about their operations in order to identify and learn from the best practices. This investigation will then study the project to develop and implement a new model of cost classification, highlighting the key cost concepts and systems involved. The first stage of the project will consist on shifting the cost concepts from variable and fixed costs to direct and indirect costs as the representativecost structure used in the IJV, followed by a pilot project made in one of the Portuguese company’s plant in order to test the new cost structure. If the pilot project is successful, the implementation of the new structure will be made in the remaining plants.
Therefore, as a summary, the present case study aims to describe and have an in-depth understanding on how and why the adopted cost structure in an industrial company was changed after this company became a Joint Venture, and it is guided by the following research questions:
a. Why did a change in cost concepts used in an IJV emerge? b. What key factors influenced the change process?
c. How was the change process implemented?
Section 2 provides a literature review that starts by introducing some concepts and views of management accounting change, followed by a general explanation of production concepts, cost terms, cost allocation models and a brief review on cost benchmarking concepts.
4 2. LITERATURE REVIEW
Management Accounting Change has been a subject of attention from both academic and professional literature mainly because it is a fundamental issue that begs for further understanding (Burns and Vaivio, 2001; Ribeiro and Scapens, 2006; Dello, 2018). Therefore, several definitions and points of view from several authors concerning this issue will be explored on the present case study.
Then, several cost concepts and allocation methods will be revised for a better understanding of the transition of the costing system that will be the crucial topic of this case study. Lastly, a background on cost benchmarking in general will be presented, highlighting its perceived benefits and exploring the process of implementation.
2.1. Management Accounting Change
On the dynamic business environment that we live in, it’s crucial to understand the incentives that drive companies to change their management accounting systems, particularly to adopt different cost accounting techniques or structures. There is a number of recent studies regarding the theory of management accounting and organizational change (Burns and Scapens, 2000; Burns and Vaivio, 2001; Innes and Mitchell, 1990; Ribeiro and Scapens, 2006; Kasurinen, T., 2002; Dello, 2018) and several case studies have been developed in order to investigate management accounting change on companies (Wnuk-Pel, 2010a; Major, 2012); Waweru et al., 2004; Kasurinen, T., 2002)
A conceptualization of management accounting change must be done in order to explore the complex and ongoing relationship between institutions and actions in shaping the process of Management Accounting Change (MAC) (Burns and Scapens, 2000). Burns and Vaivio (2001) defined three perspectives on management accounting change: (1) the epistemological change viewed as an “illusion of the observer” where normative claims of change should be distinguished from change as an empirical phenomenon; (2) change as a “managed and formal organizational event or process” (p. 394); and (3) change considering a “centrally driven effort” (p. 395), where managers recognize the need to change, organize and plan the change for secondary agents to assist and implement. Moreover, in studying both Management Accounting (MA) change and organizational behaviour, it is essential to acknowledge the role of power: explicit power at a first level – hierarchical power or strong individual personality; ceremonial use of organizational routines at a second level; and
5 embedded power of institutionalized routines that shape the actions and opinions of the employees (Burns and Scapens, 2000). In Burns and Scapens, (2000, pp. 591)’s opinion, “power mobilization essentially provides the energy and momentum necessary for implementing accounting change”, in which particular interests are often pursued. However, Burns and Scapens (2000) also state that such change requires agents to fully understand the purpose of the new accounting method, otherwise a sustainable accounting change might be difficult to achieve.
Regarding the need for change, Burns and Scapens (2000) discussed several dichotomies to classify different types of change processes, among them: the (1) formal or informal change; and the (2) revolutionary or evolutionary change. A (1) formal change occurs when new rules are introduced through actions of an individual or a group with power, which may require new ways of thinking (Burns and Scapens, 2000). Contrary, Burns and Scapens (2000) describe the informal change as a process presented through resistance or anxiety that would probably lead to failure in the implementation process. Resistance to change is defined by Ionescu et al. (2014) as a normal human reaction to the uncertainty that any change can bring with it, highlighting the need to debate and discuss about the importance of the change that is going to be implemented. The resistance could be related to competing interests, lack of ability to adapt to such change or resistance due to “mental faithfulness” to existing routines and institutions (Burns and Scapens, 2000). Burns and Scapens (2000) also highlighted the difficulty in predicting the effects of this sources of resistance and that will depend mostly on the institutions of that particular organization.
This distinction between formal and informal change is equally related to the distinction between unintentional or intentional change: the first term is used when change is not specifically directed, contrary to the last term that obviously illustrates anticipated changes that results from the planned introduction of new accounting changes (Burns and Scapens, 2000). In practice, Burns and Scapens (2000) stated that these new rules are expected to follow a top-down approach, impacting directly the technical aspects of MA systems; while bottom-up approach will probably have an impact at a tacit level.
MA change can also be seen as (2) revolutionary – when involves a radical disturbance to the current routines and institutions – and evolutionary – when the change is incremental and has little influence on prevailing routines and institutions (Burns and Scapens, 2000). Here, managers must take into account that “it is possible for apparently quite minor management accounting change to have major institutional consequences, while what appears a rather
6 more significant management accounting change may have only a limited impact on existing routines and institutions” (Burns and Scapens, 2000, p. 20). As noted earlier, there is always the problem of resistance to change when existing routines are challenged, but that does not necessarily mean that “such change is inevitably doomed to failure” (Burns and Scapens, 2000, p. 17). Instead, the particular context of the organizations and its institutional setting should be carefully explored, examining in-depth the current rules, institutions and routines and also analyse the potential conflicts and challenges that can emerge from the change process (Burns and Scapens, 2000). However, it is not always easy to predict the outcome of the planned change (Burns and Scapens, 2000), mainly since change factors will not only depend on the industry but also on the existing management accounting practices across the organizations (Schwarze et al., 2007).
On one hand, understanding the circumstances that lead to the process of change in MA is relevant for this particular case study. Innes and Mitchell (1990) identified a range of factors that influenced MA change, including: (1) Competitive and dynamic market environment, (2) Organizational structure, (3) Production technology, (4) Product cost structure, (5) Management influence and (6) Deteriorating financial performance. The case study presented by Wnuk-Pel (2010a) is an example of a change that emerged as a necessity for a reliable cost calculation and product profitability, since managers showed a great dissatisfaction towards the information provided by the cost accounting system. Similarly, Schwarze et al. (2007) indicated executive board pressure as a strong driver for change, as they were seeking more accurate information on profitability reports. A case study conducted by Major (2012) highlighted the pressure from the industry regulator as determinant for the change: the company was obliged to implement an appropriate cost accounting system that would fit the regulators’ demands. By studying four cases, Waweru et al. (2004) also supported the view that both external and internal pressures on a particular organization can affect management accounting change, highlighting rough competition and technology development as the key drivers.
In the case study to be presented on this research, management influence from one of the partners is clearly the factor that pushed the change process. According to Ionescu et al. (2014), managers have five roles during the change process: communicate the information about the change; actively support the implementation of the change; train employees; work with them; and manage the possible resistance to change that may arise. Top managers must
7 always demonstrate their commitment to the change process (Ionescu et al., 2014; Schwarze et al., 2007), otherwise change may be doomed to failure.
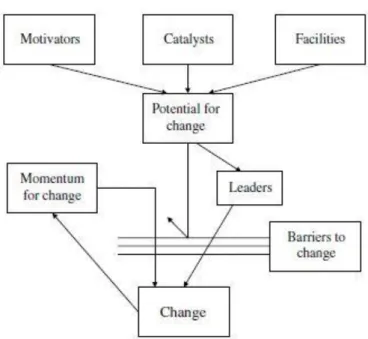
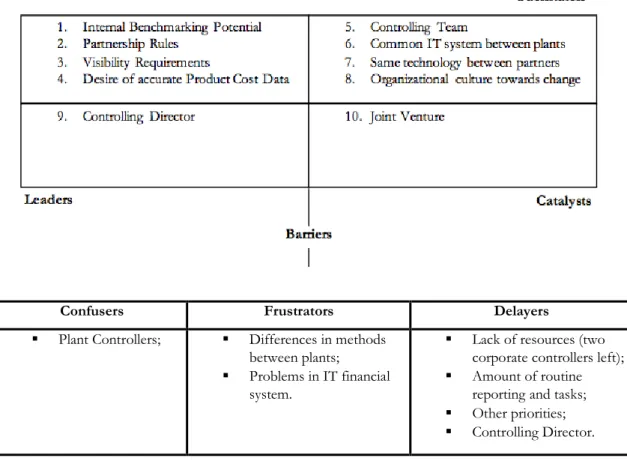
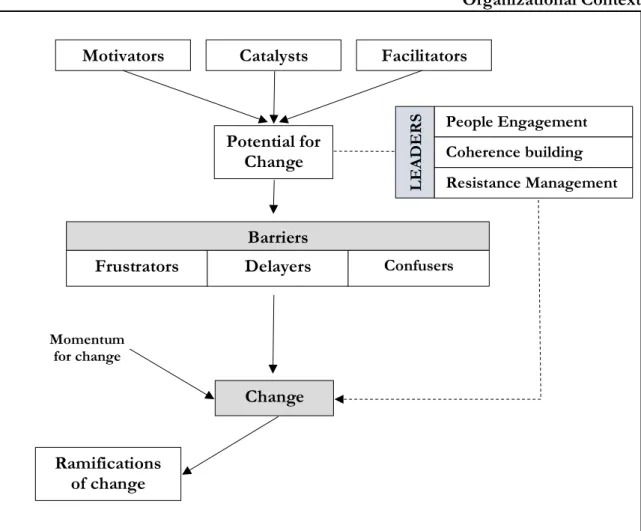
On the other hand, analysing “how these factors combine and interact to provide the ‘real world’ circumstances which result in practical developments occurring in management control” is also important (Innes and Mitchell, 1990, p. 3). As a result, an accounting change model was developed emphasizing the internal influencing factors of the change process, highlighting the importance of individuals (Innes and Mitchell, 1990; Cobb et al., 1995; Kasurinen, 2002). Innes and Mitchell (1990) divided the originating factors into 3 categories, based on the nature and the time of their influence on change. Motivators were associated with change in a general way and examples of these would be the increased competition and the rate of product innovation. Catalysts were directly related to the change and could be represented by the poor financial performance, the loss of market share or the launch of a new product. Finally, Facilitators were considered necessary but not sufficient for the change to happen, having as example the availability of adequate accounting staff and computing resources as well as the authority given to accounting function. Later, Cobb et al. (1995) argued that Innes and Mitchell (1990)’s model not only ignored barriers that could affect change but was also weak in explaining the process of change within the organization and in particular, the influence of individuals. Cobb et al. (1995) considered the role of individuals as catalysts and leaders crucial to the change process, and consequently decided to develop the accounting change model by emphasizing the role of individuals as leaders in change. The developed model by Cobb et al. (1995) is presented in Figure 1 and includes the barriers of change as being factors hindering, delaying and preventing the change; and the expectation of continuing change as momentum.
8
Source: Cobb et al. (1995, p.173).
Schwarze et al. (2007) confirmed some of these assumptions presented by Cobb et al. (1995) by identifying leaders as a key element for overcoming the barriers to MAC and the impact of board expectations as catalysts. Furthermore, the same author also confirmed the impact of information systems (IT) in MAC similarly described by Cobb et al. (1995).
But barriers to change can also be represented in other manners. For example, the lack of resources to support change is a common problem in several case studies (Wnuk-Pel, 2010a; Waweru et al., 2004). Similarly, the barriers identified by Wnuk-Pel (2010a) were linked to the large amount of human resources required to implement and maintain the Activity Based Costing (ABC) and the existence of other priorities. Wnuk-Pel (2010a) also highlighted the negative attitude that organizational culture had towards change and insufficient knowledge of managers as a negative factor affecting the implementation. Another example by Waweru et al. (2004) blamed management inertia, shortage of technology facilities and lack of skilled accountants for creating resistance to management accounting change.
The ‘organizational culture’ term mentioned by Wnuk-Pel (2010a) was perceived as a means to conceptualize management accounting change (Burns and Scapens, 2000). Contrary to the popular literature, Hofstede at al. (1990) argued that daily practices were at the core of the organizational culture and that those practices were shaped by the values of both the founders and the key leaders. But whether organizational culture is based in shared practices or not, the important assumption is that organizational culture change is possible when
9 management is committed towards new practices (Hofstede et al., 1990). Burns and Scapens (2000) agreed with this view, and also argued that organizational change as difficult but not impossible.
As a matter of fact, organizational culture influences the success of management accounting changes (Oliveira and Drury, 2006), and thus should be accompanied closely at an institutional level (Burns and Scapens, 2000).
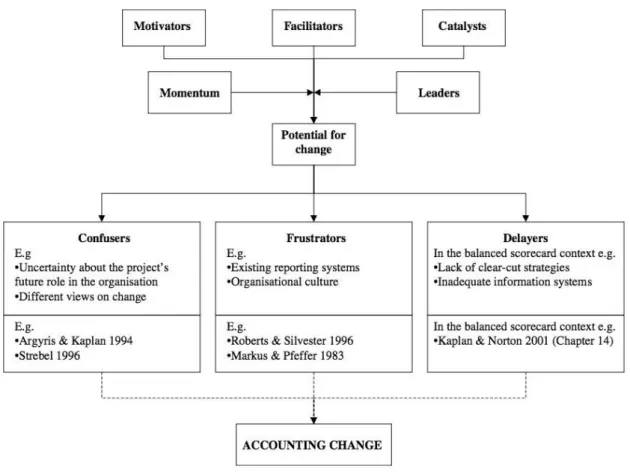
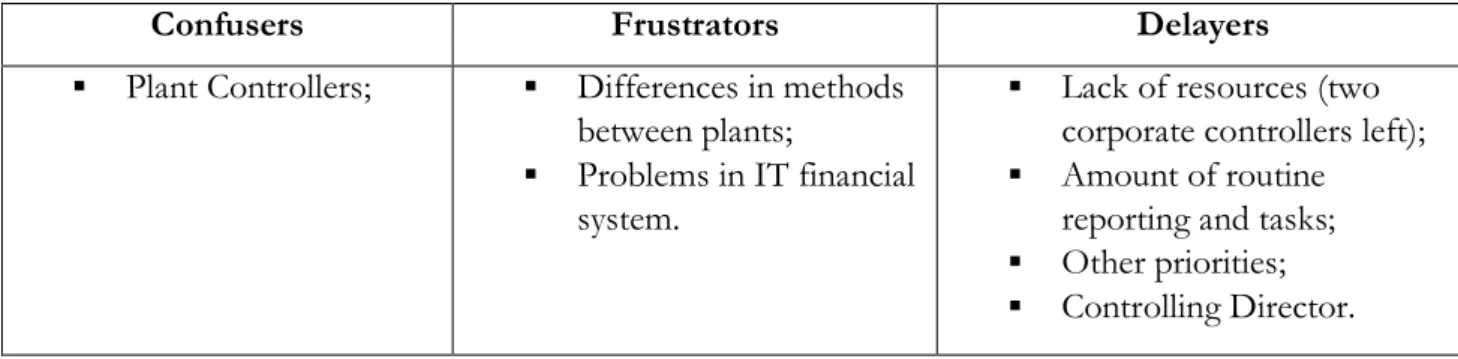
Following the objective to further develop the accounting change model of Cobb et al., Kasurinen (2002) worked on expanding the specifications of the several barriers to change which may hinder the process of change. The same author argued that the model of Cobb et al. failed to define the different sort of existing barriers, by generally aggregating all in only one category. In line with his longitudinal case study based on the implementation of a balanced scorecard in a Finnish group, Kasurinen (2002) enhanced the model of Cobb et al. with three new subcategories (see figure 2): Confusers; Frustrators; and Delayers.
The Confusers, as the name suggests, are barriers that confuse and disrupt the change implementation process. For example, when individuals question the validity of the change project or have different goals towards the accomplishment of the change. The Frustrators, on the contrary, are represented by the factors that consciously tend to suppress the change. Kasurinen (2002) exemplifies this element with the existence of a solid engineering culture where operational measures had more importance than the strategy. Lastly, the third element suggested by Kasurinen (2002) is categorized as Delayers. This type of factors is usually interconnected with the changing project itself, as they require proper resources – in the case study presented by the same author, the balanced scorecard was the delayer of the project since it required changes to the information system for accurate data collection (Kasurinen, 2002).
10 As stated before, these three subcategories were developed in order to help on the analysis and explanation of the barriers of change, to possibly detect and avoid potential concerns even during the change process (Kasurinen, 2002). Because, contrary to the accounting change model of Cobb et al. (1995) that focused on explaining change after its occurrence, Kasurinen (2002) pointed out more advantages in applying the change model during the planning phase of the change process – the organization could take corrective actions every time it identified advancing and delaying features.
Change is an issue that is still begs for further research, both theoretical and empirical (Burns and Vaivio, 2001; Schwarze et al., 2007; Kasurinen, 2002; Dello, 2018; Pimentel and Major, 2009). This paper attempts to make some contribution in this area by describing a real-life example of a company that has recently been subjected to change in the management accounting department.
Figure 2. Revised Accounting Change Model. Source: Kasurinen (2002, p. 338).
11 2.2. Fundamental Concepts about Production
Since production and production processes are closely related with product costing systems and concepts, it is essential to highlight some of the basic concepts on this matter.
As Baganha (1994b, p. 172) once stated, "In economic units of industrial production, (...), the calculation of costs arises in response to management needs, namely: decision-making, control and valuation of goods and/or services produced"1, which are crucial in the management of SA’s business. The necessity of cost benchmarking across SA’s multiple plants highlighted the importance of an adequate cost accounting method that is similar to other companies in the group; since production costs are one of the key costs of the company, particular attention should be paid to it.
The industrial production process includes not only materials, human actions (work and skills) and instruments (machines and tools powered by energy), but also agents, such as technology and the structured organization of the production unit, that nowadays play an important role in business (Baganha 1994a). This author defines the stages of the production process as the set of operations between two phases of the product elaboration.
Baganha (1994a) classifies each agent or class of agents involved in the productive process as productive factors. These factors may be considered as fixed or variable, and in accounting terms these correspond to fixed and variable costs, respectively. Baganha (1994) also distinguishes between uniform production - when an industrial unit manufactures a single product - and multiple production – when more than one product is manufactured; and between joint production – when in the same production cycle and same input lot there are multiple outputs - or disjoint production – when a single output is obtained. Finally, manufacturing regimes may be continuous or discontinuous, according to the need to suspend the production process of a product in order to produce others.
2.3. Fundamental Concepts about Costs
A cost is usually defined by accountants as a resource sacrificed or foregone to accomplish a particular goal, and in general they are measured and expressed in monetary terms (Horngren et al., 2011). In other words, there are two definitions for a cost: (1) “a sum of sacrifices
12 required for a particular goal”; and (2) “a sum of sacrifices incurred for a particular objective or caused by a particular event” (Baganha, 1995, p. 34).
When thinking of a cost, people usually want to know the cost of “something”, and this “something” is called a cost object, that is, anything for which a measurement of costs is desired (Horngren et al., 2011). Based on Hansen and Mowen (2007) work, a cost object is any item such as a product, client, project, department or activity for which costs are measured and allocated.
For a firm to take a critical first step for achieving competitive advantage it has not only to identify the key costs but also to identify their cost drivers, which represent any factor that has a changing effect on the amount of the total cost. Importantly, taking the key cost drivers into consideration can contribute positively to the company’s success (Blocher et al., 2012). Classifying those key costs is also important. “In general, the classification of costs depends on the classification of the charges that integrate them” (Baganha, 1995, p. 38). In this author’s view, if there is a direct and immediate causal link between the charge and the cost object, the charge is direct; otherwise, the charge is indirect. However, if we take into consideration the relationship between the amount of charges and the production, costs might be distinguished as variable – when the amount varies with the level of production - or fixed – when the amount is independent of the volume of the actual production (Baganha 1995). According to Horngren et al., (2011, p. 30), “identifying a cost as variable or fixed provides valuable information for making many management decisions and is an important input when evaluating performance”.
As asserted by Hansen and Mowen (2007), there are three methods of assigning costs to cost objects: direct tracing, driver tracing and allocation. The first method, direct tracing, relies on physically observable and exclusive causal relationships. The second method, driver tracing, relies on causal factors (or drivers) to assign costs to cost objects. The third method, allocation, consists in assigning indirect costs to cost objects based on convenience, when tracing is not possible or not economically feasible. But some costs do not have a significant importance to be allocated individually, and so they are pooled together on a cost pool to be subsequently allocated (Horngren et al., 2011). Horngren et al. (2011) concluded that a cost pool is a group of individual costs that are allocated to cost objects using a single cost driver, which means that all costs in the same cost pool are supposed to be caused by the same cost driver.
13 The first two (direct tracing and driver tracing) are more accurate since they are based on cause-effect relationships; therefore, allocation should be avoided whenever possible, since it tends to assign costs arbitrarily (Hansen et al. 2007).
Hansen et al. (2007, p. 34) specified that “assigning costs to products, services, customers and other objects of managerial interest is one of the principal objectives of a management accounting information system”. However, while an accurate cost assignment is important, companies should consider the reasonableness and logic of the cost assignment method, since “it’s better to be approximately correct than precisely inaccurate” (p. 36), meaning that trade-offs between accuracy and simplicity are often required.
Horngren et al. (2011) also indicated additional factors that can affect the classification of costs as direct or indirect, including: the materiality of the cost, the availability of the information; and the design of the operations. The first considers that the higher the amount of a cost, the more important it is to accurately assign that cost to a specific cost object; the second one highlights that the development of information technology and systems is crucial to help classify more costs as direct costs; and finally it is said that the way the manufacturing process is established could facilitate the classification of a cost as a direct cost (for example, if the entire manufacturing process of a product is carried out by a single and exclusive production line, rather than that process being scattered across multiple production lines manufacturing other products).
Horngren et al. (2011, p. 30) also warn about the fact that “a specific cost might be both a direct cost of one object and an indirect cost of another cost object” (see also Baganha, 1995), that is, the classification as direct/indirect cost is dependent on the choice of the cost object.
2.4. Costing Methods
After explaining the main cost concepts and their managerial importance, the next step is to choose between two alternative costing methods for the calculation of the product’s unit cost – Variable Costing and Absorption Costing (Horngren et al. 2011).
Full costing or Absorption Costing is explained by Lanen et al. (2011, p. 57)as fully absorbing the variable and fixed costs of manufacturing a product – direct materials, direct labour, and overheads; contrary to the Variable Costing that separates variable and fixed costs, and where “only variable manufacturing costs are product costs” and all others costs are recognized as
14 period costs. Blocher et al. (2012) positions Absorption Costing as being the conventional costing system since it is required by financial reporting standards.
Horngren et al. (2011, p. 309) considers absorption cost is not only a required inventory method for external reporting in a large number of countries but it is also very useful for managers to use as “a common method of inventory costing for both external and internal reporting and performance evaluation”.
2.5. Cost Allocation Methods
The allocation concept is “the process of accumulating, classifying and assigning direct materials, direct labor and plant overheads to products, services of projects (Blocher et al. (2012, p. 91). Therefore, Blocher et al. (2012) define three steps for a firm to develop its particular costing system: (1) choose the cost accumulation method – Job Costing, Process Costing or Operation Costing; (2) choose the cost measurement method – Actual, Normal or Standard Costing; and (3) choose the overhead assignment method – Volume-based or Activity-based.
For the first step, about cost accumulation, Lanen et al. (2011) state that there are two costing methods to determine the unit cost of the products: Job Costing and Process Costing. The first traces costs and revenues to an individual unit (e.g.: jobs, contracts or batches of goods), contrary to the latter that does not separate or trace costs for each unit. Examples from Hansen and Mowen (2007) can give us more insight of this difference: in a nutritional supplements company, each formula would be using different amounts of materials, labour and equipment, making it essential from a management point of view to collect costs by job; Process Costing is usually used by large manufacturing plants (such as chemical, food and tire manufacturers) as all of them have similar products that pass through identical set of processes.
Many companies use a hybrid costing system, combining Job and Process costing, called Operation Costing, when they produce goods through similar processes but with different materials usage. Nissan is a good example since it produces different cars and trucks models on a unique assembly line in one of its plants (Lanen et al., 2011). So, the product costing system differs from company to company according to the production process. Figure 3 below summarizes the types of production flows and the costing systems related to each one of them.
15
Production flow Job Shop Batch Production Continuous
flow processing
Type of product Customized
product
Different batches of products, but homogenous
within a batch
Homogeneous product Product costing
system Job costing Operation costing Process costing
Source: Adapted from Lanen et al. (2011, p. 212).
Overall, “the choice of a particular system depends on the nature of the industry and the product or service, the firm’s strategy and management information needs, and the costs and benefits of acquiring, designing, modifying, and operating a particular system” (Blocher et al. 2012, p. 91).
The second step, about cost measurement, is to determine if the measurement of the cost is their actual, normal or standard amount, as summarized in Figure 4 (Blocher et al., 2012).
Costing System
Types of Costs Used For
Direct Materials Direct Labor Plant Overhead Actual Costing Actual Cost Actual Cost Actual Cost
Normal Costing Actual Cost Actual Cost Estimated overhead cost Standard costing Standard Cost Standard Cost Standard Cost
Source: Adapted from Blocker et al. (2012, p. 92)
According to Lanen et al. (2011), a standard cost system considers budgets (standards) for labour and direct materials, and a pre-determined overhead rate estimated according to the budgeted overhead and budgeted volumes for the allocation base. Therefore, this system uses standard costs for the manufacturing costs – direct materials, direct labor and plant overhead. On the contrary, the actual costing system uses actual costs for these manufacturing costs (Blocher et al., 2012). Finally, according to Hansen and Mowen (2007), in the normal costing system the actual costs of direct materials and direct labour are assigned to products, while overhead costs are assigned to products using a pre-determined rate. Figure 3. Production Flows and Costing systems.
16 The third step, as described by Blocher et al. (2012), consists on deciding how to assign overheads, if it is based on a volume-based or activity-based system. Blocher et al. (2012) designate the volume-based product costing system as the one that uses a volume-based cost driver to allocate overheads to products or jobs. However, it is also stated that this system relies greatly on the hypothesis that each product indeed uses the same amount of overhead. Therefore, Lanen et al. (2011) highlights that this assumption may not hold, causing a big disadvantage of this system of potentially distorted costs, particularly in situations of a large number of products with low volume.
Lanen et al. (2011) describes Activity-based Costing as a “two-stage product costing method” since it first traces costs to activities and then to products (using the consumption of activities used by each product). Hansen and Mowen (2007) support this definition, and emphasize the fact that ABC costing system uses direct and driver tracing, exploiting cause-and-effect relationships, as much as possible.
2.6. Cost Benchmarking
Product costing is useful for various purposes, including cost benchmarking. “The essence of benchmarking is the process of identifying the highest standards of excellence for products, services, or processes, and then making the improvements necessary to reach those standards, commonly called ‘best practices’” (Elmuti and Kathawala, 1997, p. 229).
Based on Elmuti and Kathawala (1997) work, there are four types of benchmarking: (1) internal benchmarking, (2) competitive benchmarking, (3) industry benchmarking and (4) process benchmarking. The first type (1) is used to determine the internal performance standards of the firm, and has the benefit of transferring the best internal procedures to other parts of the organization. The second (2) is implemented to compare companies that are in the same markets and sell competing products or services. The third type (3) is used to compare results across diverse industry leaders and processes in common functional areas. Lastly, the fourth type (4) focuses mainly on the best procedures and functions of a company that could be or not from the same market.
Before starting a benchmarking process, an organization must choose which activities or functions it is going to benchmark (Elnathan and Kim, 1995). In the present case study, the focus will be in the internal benchmarking, since the case company wants to compare product costs from all of its plants located in Portugal and in other countries. As their production facilities have become geographically dispersed, it is likely that information on best practices
17 is not shared between the units (Southard and Parente, 2007). Hence, internal benchmarking can be an important tool to identify these practices and strengthen the competitive advantage of the company (Southard and Parente, 2007).
18 3. METODOLOGY
3.1. Case Study Methodology
The present study was developed with the purpose of describing and understanding how and why after a manufacturing company became a JV it changed its cost structure from being primarily based on the distinction between variable costs and fixed costs to being primarily based on the distinction between direct and indirect costs. To achieve my objective, a case study was developed considering only one multinational company that is part of a wider group and has been successfully adapting to the constant changing environment of the recent years. Hence, the case study will follow both explanatory and descriptive research models since theory will be useful to provide some explanations of the observed practices that will be described in the study (Scapens, 2004, Yin, 2014). Yin (2014, p. 5) also argues that “even a single-case study can often be used to pursue an explanatory, and not merely exploratory (or descriptive) purpose”.
The choice about the approach used in the current research was specifically related with both the subject to be explored and the need to adjust the research strategy to the object of the study. By using a qualitative method, as it was possible to establish a more personal contact with the participants, trying to more closely understand their behaviour, experiences and decisions.
According to Yin (2014), a case study research can rely on many techniques including direct observation, interviews and a full variety of evidence documents. Indeed, a mix of research techniques seem the most appropriate when the research questions are focused on “how” and “why” questions. Therefore, to develop the present case study, three interviews were conducted with top and mid-level management and the information on internal documents concerning this issue was carefully analysed.
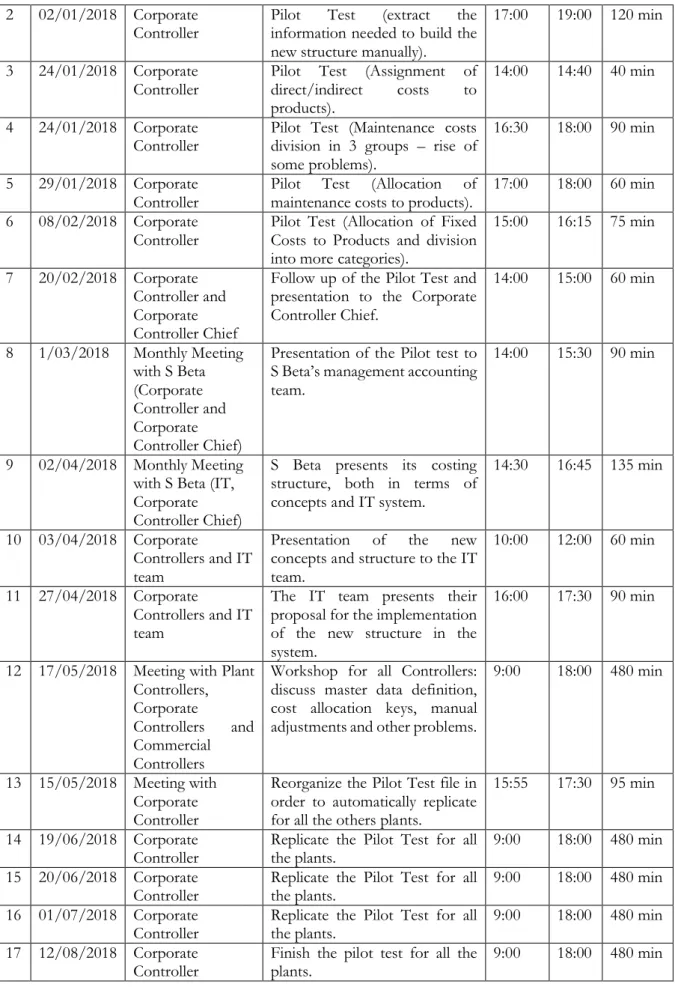
Furthermore, as part of the management accounting change team, I attended several meetings to address emerging needs. Table 1 summarizes these meetings, specifying the individual(s) involved, the subject discussed and both the date and the duration of the reunion.
Meetings
Date Department/ Function Subject From To Time
1 28/12/2017 Corporate
Controller Alignment of the project: decision to first make a pilot test for one plant.
19 2 02/01/2018 Corporate
Controller Pilot information needed to build the Test (extract the new structure manually).
17:00 19:00 120 min
3 24/01/2018 Corporate
Controller Pilot Test (Assignment of direct/indirect costs to products).
14:00 14:40 40 min
4 24/01/2018 Corporate
Controller Pilot Test (Maintenance costs division in 3 groups – rise of some problems).
16:30 18:00 90 min
5 29/01/2018 Corporate
Controller Pilot Test (Allocation of maintenance costs to products). 17:00 18:00 60 min 6 08/02/2018 Corporate
Controller Pilot Test (Allocation of Fixed Costs to Products and division into more categories).
15:00 16:15 75 min
7 20/02/2018 Corporate Controller and Corporate Controller Chief
Follow up of the Pilot Test and presentation to the Corporate Controller Chief. 14:00 15:00 60 min 8 1/03/2018 Monthly Meeting with S Beta (Corporate Controller and Corporate Controller Chief)
Presentation of the Pilot test to S Beta’s management accounting team.
14:00 15:30 90 min
9 02/04/2018 Monthly Meeting with S Beta (IT, Corporate Controller Chief)
S Beta presents its costing structure, both in terms of concepts and IT system.
14:30 16:45 135 min
10 03/04/2018 Corporate
Controllers and IT team
Presentation of the new concepts and structure to the IT team.
10:00 12:00 60 min
11 27/04/2018 Corporate
Controllers and IT team
The IT team presents their proposal for the implementation of the new structure in the system.
16:00 17:30 90 min
12 17/05/2018 Meeting with Plant Controllers, Corporate
Controllers and Commercial Controllers
Workshop for all Controllers: discuss master data definition, cost allocation keys, manual adjustments and other problems.
9:00 18:00 480 min
13 15/05/2018 Meeting with Corporate Controller
Reorganize the Pilot Test file in order to automatically replicate for all the others plants.
15:55 17:30 95 min
14 19/06/2018 Corporate
Controller Replicate the Pilot Test for all the plants. 9:00 18:00 480 min 15 20/06/2018 Corporate
Controller Replicate the Pilot Test for all the plants. 9:00 18:00 480 min 16 01/07/2018 Corporate
Controller Replicate the Pilot Test for all the plants. 9:00 18:00 480 min 17 12/08/2018 Corporate
Controller Finish the pilot test for all the plants. 9:00 18:00 480 min Table 1. Summary of the Meetings at SA.
20 Additionally, qualitative information – documents – was also collected in order to better understand the transition process of the cost structure. To begin with, information about the initial cost structure was collected and then the details about the cost structure proposal and implementation in one of the plants was registered. The objective was to understand and analyse the influences that took place, in particular the role of having become a JV and of the actors involved in the process.
3.2. Steps and Techniques for Collecting Information
The main steps in this case study research included preparation, collecting evidence, assessing actions’ outcomes and finally identifying and explaining patterns (Scapens 2004).
The preparation phase comprised the literature review that was presented in the previous section, in which it not only explained several important concepts, but also presented the research questions that are going to be addressed.
The second phase consisted in collecting evidence, mainly through documentation, direct observation, interviews and artefacts. The documents for analysis were provided by top management, which included financial reports and formal presentations from both companies – SA and S Beta. Moreover, free access to cost reports and cost information included in the Administrative Support System, SAP, was also allowed. Moreover, being part of the team responsible for the cost structure changing project, gave me complete access to the materials used in the present research. The team that worked actively in the changing process included the Controlling Director, the Corporate Controller Chief, a Corporate Controller employee and myself as a controller intern. The project took place between December 2017 and August 2018.
Direct observation, interviews and surveys were carried out mostly in the corporate sector, with the planning and controlling teams which were directly related to the cost structure changing project. Observing actions and attending meetings were an important source of evidence for the present research, mainly since I followed the implementation process that was taking place in the company with multiple meetings with several departments (including IT and the controlling team). I took notes following a coherent order and manner for subsequent analysis and reflection as recommended by Scapens (2004).A main objective was to analyse the empirical insight to evaluate the outcome of the actions along actors, a crucial step in attaining the overall research objective.
21 All the interviews were semi-structured, meaning that I had a broad framework for the questioning that was discussed with different people, always allowing sufficient flexibility to explore some of the issues more in depth and follow up the answers that were given by each one of the interviewees (Scapens, 2004). It should be recognized, however, that most interviews were short, as interviewees were all pressured to meet deadlines, preventing me from developing some topics in greater depth.
22 4. THE CASE STUDY
4.1. Introduction and Company Overview
Founded almost 60 years ago in Portugal, S Alpha was established as a small industrial company known internationally by producing simple and relatively homogeneous and undifferentiated products. The company has production facilities in several countries across the globe, but its head offices are based in Portugal. S Alpha continuously expanded its activities throughout the years by making several national and international acquisitions, pursuing the strategy to have majority or absolute control over the acquired companies. In 2016, S Alpha had approximately 2800 employees.
Recently, S Alpha established a partnership with S Beta, one of the largest world players in this market, giving rise to SA, a 50/50% joint venture.
S Beta was founded approximately 50 years ago in South America and it is today an international benchmark in terms of industrial plants, efficiency, production standards and innovation. Over the years, the company took substantial steps towards the globalization of its operations, becoming one of the largest five players in the world. Employing approximately 13,000 people, S Beta has production facilities in many countries in America. The SA joint venture emerged in a context of S Alpha’s restructuration process that began a few years before, aiming to create value for the stakeholders of both companies. The main goal of this partnership is that SA becomes more competitive in the European and South Africa markets, embrace new challenges and diversify geographically in relevant markets. However, the joint venture includes only several industrial units in Europe and South Africa, leaving out the activities that S Alpha still has in another continent - one of the most profitable units in the group – and some plants in Europe. The reason is that it is a different segment of production that S Beta does not have experience with, and so S Alpha’s were left out of the alliance. Some other plants, with relatively low size, were also excluded from the partnership. The headquarters of SA and of the remaining S Alpha are located in the same site, although in separate parts of the site, with each company having dedicated staff and infrastructures, although some structures such as the shared service centre, the IT and the human resources department are shared between the two companies.
The market in which these companies operate is currently having a great demand all over the world. Despite the economic downfall in Europe of 2008 that made S Alpha to shut down some of its plants, there has been an economic recovery in the region which is positively
23 affecting the market. Developing countries have been creating potential market opportunities during the last few years that is particularly benefiting the industry in which SA and S Beta are included.
SA is taking advantage of the sustainability trend that has gained importance over the years. The company is committed to the concept of sustainable utilization of raw materials and also the investment in sustainable buildings. The industry is optimistic about the future and predicts good business opportunities in all geographical markets.
Several individuals from S Beta were assigned to management positions and to the board of directors of SA, including the Controlling Director, who had a crucial position in the change studied in this research. Having more people from SA working at S Beta, and also the other way around, is the goal for the new few years, as the Controlling Director informed.
According to the Controlling Director, both companies organized monthly meetings with the executive committee, in order to analyse the results and for benchmarking purposes. He also added that there were several visits to plants that were not previously scheduled, but gave both companies the opportunity to discuss standardization and process improvement opportunities.
4.2. Production Process in SA
S Alpha produces several types of its basic product and respective components adapted to the customer needs, differing in a wide range of physical properties and dimensions. Given the diversity and the location of each plant, there are some differences in the production process of the same type of product – particularly regarding different input quantities or different customer demands. However, different types of machines and technology can also affect the production process of the same product. This occurs not only since some plants are newer than others but also due to the implementation of improvement processes in only some of the plants.
The production process of SA is characterized by being a combination between Make To Order (MTO) and Make To Stock (MTS). According to Baganha (1994a), the manufacturing process can be distinguished between continuous – when the company does not interrupt the manufacturing process to produce another product - or discontinuous – when the process is actually interrupted to produce a different product. Particularly in SA, it is possible to say that it is a mix of both processes since it produces both products to the warehouse to be sold later and products upon customer ordering with technical characteristics.
24 The company first receives the customer order with the specifications and registers the order in SAP2 distinguishing if the order is MTO – when the customer makes an order with particular conditions – or MTS – when the order meets the specifications of the products that the company usually produces in mass. SA strategically has finished products in stock to be more flexible and reactive to the unpredictability of the demand of its customers. If SA does not have the product available in the stock, a production order is sent to the plant planner who will gather all the orders and organize them according to the specifications. He is the one who decides when the materials will be produced and when they will be sent to the customer. There is always the other possibility that this product has never been produced before in SA and in these particular cases each plant controller has to create a technical product sheet in SAP. In this way, SAP will automatically create the needs of the product, such as the input quantities and the processes involved in the production.
The production process itself follows a linear structure, which means that all the operations are organized in a chronological order, forming a single sequence of manufacturing operations (Baganha, 1994a). And by having a variety of operations on the same sequence, it is possible to describe it as a complex production process with phase-segmentation (Baganha, 1994a). Between those phases, there are some stages where the product must rest in order to freshen, in which the only agent of production is simply time (Baganha, 1994a).
4.3. Cost Accounting Practices in SA
The main principle that underlies the current classification of costs in SA is between fixed and variable cost basis. As stated above, Baganha (1995) describes a cost as variable when its amount varies with the level of actual production; and fixed when the amount does not depend on the volume of the actual production. SA does not consider at a high level of the cost structure, a distinction between direct and indirect costs for cost classification, but the objective of the management accounting change discussed in the present case study is to implement this classification until the end of the current year, 2018.
SA uses the absorption costing system to expense all costs related to the manufacturing of each particular product, including direct materials, direct labour and both variable and fixed
2 Systems, Applications and Products in data processing (SAP) is the software that incorporates the key business
25 overheads. In this method, a portion of fixed manufacturing overhead cost is allocated to each product unit, along with the variable manufacturing costs (Noreen et al., 2007). SA’s product units are considered identical since they have some characteristics that are common and others that have additional individual characteristics – for example, two different products initially have identical production processes but then are finished using distinct procedures or characteristics. Those different products use different sets of materials but go through some of the same work stations. Because of this, it is possible to define the cost allocation method of SA as being Operation Costing – different batches, many of which are used to meet customized production orders.
The cost control practice of SA follows the standard cost approach, which means that cost elements are allocated based on an estimated overhead rate. Hence, the cost of goods sold reflects the standard costs of the product instead of the actual costs of the period. But in order to reduce the variance between the standard and the actual costs, the plant controllers are responsible for periodically updating the standard costs to bring them closer to the actual costs, usually on a monthly basis.
The cost allocation process is made in SA’s ERP3, SAP. This functionality allows the company to calculate the standard costs and, based on this, valuate inventory stocks and material movements.
In SA, the costs of every department involved have to be linked with its respective cost object – a cost centre or an internal order. Then, the costs of certain sender’s cost centres will be allocated proportionally to receiver’s cost centres.
SAP’s cost allocation method includes two processes: distribution of primary cost elements and assessment of secondary cost elements. Primary cost elements are the expenses that result from the consumption of production factors purchased from external parties and secondary cost elements are used to identify internal cost flows.
Therefore, in the allocation process, the amount is allocated from sender’s cost objects to several receiver’s cost objects based on an overhead rate defined by controllers. In order to do so, the IT team has to establish relationships between sender and receiver’s cost objects, as well as its cost allocation percentage. For example, the building rent included in the cost
3 SAP ERP is the enterprise resource planning (it is an extension of SAP). Includes several business processes
26 centre of structure costs4 (sender’s cost centre) needs to be allocated to several departments, such as Logistics, Warehouse or Quality (receiving cost centres).
After the execution of the distribution cycle carried out in the period end closing, explained above, internal SAP cost allocation must be performed. In this process, costs can be manually transferred from one cost centre into another – Plant controllers can make simple adjustments of incorrect allocations directly in SAP.
After plant controllers and the reporting team perform closing tasks in SAP – sales, stocks, accounts receivables, accounts payable and cash & banking closing – month end cycles are completed and the data is ready to be integrated in Hyperion Financial Management (HFM). HFM is an information system for financial management and reporting consolidation. The system allows controllers to quickly consolidate and report financial results while meeting global regulatory requirements5.
Then, controllers must validate the information integrated in HFM by analysing the Profit and Loss accounts (P&L) per plant and per product line. If necessary, plant controllers are able to make some adjustments to the P&L – that are labelled as journals – that must be approved by corporate controllers. Afterwards, the P&L is also validated by country controllers and the financial manager, in this order.
Once all validations are completed, the corporate controllers download the information for an excel file and send it to the CFO that will locally report the legal company P&L and the Balance Sheet.
Although the SAP cost allocation process is the same for every plant, there are differences between plants. First, some plant controllers update the standard product cost every month and the others update it quarterly, which suggests no homogeneity in the procedure.
Differences on cost allocation among plants do not end up here. The change on the cost accounting method highlighted some important procedures that were not done homogeneously in every plant. First, there was no common method for creating cost centre groups in SA, which means that every plant controller had the power to generate a cost centre if he considered to need it. A cost centre group comprises several cost centres organized according to organizational divisions and/or functional viewpoints – for example, the Direct
4 Expenses that do not suffer a change of value in case of increase or decrease of production – for example,
equipment and building rent; cleaning costs; security and surveillance.
5 See oracle’s official website for more detail
27 Sales Cost group of SA contains all costs related to transportation (air, road, rail and sea), commissions and specialized work (see Appendix IV).This problem is at the origin of the second one: almost every plant had a few cost centres that were not directly linked to the product, which inevitably created differences in cost allocation among plants as plant controllers had to correct it manually in HFM. Most of them used a fixed percentage of sales or production to allocate those costs; some of them used a predetermined overhead rate (Hour*Hour Rate per Production Line); and only a few were using statistical key figures – for example, some of the plants have electricity meters in each production line, and so they distribute total electricity costs based on the proportion of kilowatt hour (kWh) consumption. This topic will be discussed further in the barriers of change section.
4.4. Cost Reporting
SA prepares an “Industrial Volume, consumptions and Cost sheet” for each product, in each plant, for a particular period of time. This sheet includes the total sales volume for that period; the product “specific consumption” (what Baganha (1995, p. 37) called “technological cost”) and unit costs of various variable inputs (raw materials and energy sources); the direct material and direct expenses related to the manufacturing costs; direct labour; plant overhead; and the cost of production (see figure 5 below). This information is updated on a monthly basis and distributed to managers during the two weeks after the end of each month.
28
INDUSTRIAL COSTS
Product A, Factory X
Month'17 Cost Component - Total Plant
Sales Volumes (m3)
Product Z 31.654
Specific Consumption
Material A (m3/m3) 1,46
Material A (Dry Ton/m3) 0,63
Material B (kg/m3) 80,30
Material C (kWh/m3) 0,00
Material D (kWh/m3) 187,57
Material E (kWh/m3) 118,72
Cost Per Unit
Material A (€/m3) 28,90
Material A (€/Dry Ton) 67,34
Material B (€/kg) 0,37 Material C (€/mWh) Material D (€ /mWh) 14,17 Material E (€ /mWh) 43,46 Variable Costs (€ / m3) Total Material A 42,12 Total Material B 30,02
Total Material C & Material D 2,66
Total Material E 5,16
Total Material F 0,48
Total Maintenance + IMC 5,79
Other Variable Costs 0,56
Total Variable Costs 86,79
Fixed Costs (€ / m3)
Total Personnel 11,02
Total Overheads 2,29
Corporate Fees 4,69
Total Fixed Costs 18,00
Total Depreciation (€ / m3) 7,63
Total Provisions (€ / m3) 0,00
Manufacturing Cost (€ /m3) 112,42