Paranoia as a Continuum in the Population
Célia Barreto Carvalho1, José Pinto-Gouveia2, Ermelindo Peixoto3 and Carolina da Motta4 1
Department of Educational Sciences, University of Azores, Azores, Portugal CINEICC, Faculty of Psychology and Educational Sciences, University of Coimbra,
Coimbra, Portugal
Rua Mãe Deus, Ponta Delgada 9500-321 PONTA DELGADA, Apartado 1422, PT - 9501-801 (Ponta Delgada, Portugal) Email: ccarvalho {at} uac.pt
2
CINEICC, Faculty of Psychology and Educational Sciences, University of Coimbra, Coimbra, Portugal
Rua do Colégio Novo, Apartado 6153, 3001-802 (Coimbra, Portgual) 3
Department of Educational Sciences, University of Azores, Azores, Portugal
Rua Mãe Deus, Ponta Delgada 9500-321 PONTA DELGADA, Apartado 1422, PT - 9501-801 (Ponta Delgada, Portugal) 4
Department of Educational Sciences, University of Azores, Azores, Portugal CINEICC, Faculty of Psychology and Educational Sciences, University of Coimbra,
Coimbra, Portugal
Rua Mãe Deus, Ponta Delgada 9500-321 PONTA DELGADA, Apartado 1422, PT - 9501-801 (Ponta Delgada, Portugal)
____________________________________________________________________________________________ ABSTRACT— Paranoid beliefs, though key to the diagnosis of paranoid schizophrenia, are not exclusively seen in
patients suffering from this psychopathology and exist in less severe forms across different populations. Evaluating these symptoms as a continuum may be more interesting for the understanding of paranoia rather than the dichotomous approach to this kind of ideation. The main goal of the current research is to assess how paranoid beliefs are present across different populations. Using the Portuguese versions of the General Paranoia Scale and the Paranoia checklist, we compared the endorsement of paranoid beliefs in 187 subjects (64 healthy controls from the general population, 32 relatives from schizophrenia patients, 30 patients in remission and 61 patients with acute schizophrenia symptoms). The results show that paranoia is present throughout the population, from non-clinical forms to more severe clinical samples, demonstrating a continuum of increased frequency and intensity until it reaches a delusional level. Environmental factors in the endorsement of such beliefs are also discussed.
Keywords— paranoia; schizophrenia; cognitive-behavioral therapy
______________________________________________________________________________________________
1. INTRODUCTION
The diagnostic models for schizophrenia (e.g.: DSM-IV-R) tend to emphasize psychotic symptoms as “present” or “absent”[1] However, the dichotomous approach has been considered a limitation to the understanding of psychotic-like experiences and may be responsible for the exacerbation of the stigma suffered by patients and their families[2, 3, 4, 5]. Similarly to the etiological continuity of psychotic continuum regarding hallucinations and delusions [e.g., 6, 7, 8] adopting a perspective of continuity regarding paranoid experiences across clinical and non-clinical populations may favor the understanding of the etiology and maintenance of paranoid symptoms. Strong evidence support the continuity approach, as several epidemiological studies have shown over the past decade [9, 10, 11, 12, 13, 14].
Earlier studies were more narrowly focused on specific populations and assessed paranoid ideation in just a few dimensions [15,16, 17, 18, 19]. More recent studies by Freeman, et al. [22] pointed out that paranoid ideations were present in about a third of their sample drawn from a nonclinical population. According to these authors, it is possible that these ideations are as common among ordinary individuals as are the symptoms of anxiety and depression, much in the same way as proposed by Verdoux, & van Os [14]. Several authors[e.g. 20, 7, 21, 14, 32] thus, consider paranoia a rather common social and cognitive process. Freeman et al. [22] suggest that paranoid ideations are hierarchically determined and function in pyramidal fashion. Located at the base of the pyramid are the more basic ideations, denoting a concern with social scrutiny. Conversely, more rare ideations are found at the top of the pyramid, such as persecutory schemes and ideas of conspiracy, which are more serious from the clinical standpoint. In a more recent study by Freeman et al. [23], persecutory ideation was present as a spectrum in clinical and non-clinical groups and varied consistently with
Asian Journal of Humanities and Social Studies (ISSN: 2321 – 2799) Volume 02 – Issue 03, June 2014
It is then important to study paranoid symptomatology more comprehensively and across different populations to assess the continuum in paranoid experiences. In the present study, in order to clarify these symptomatic thought processes, 187 participants were divided into four groups: (1) actively psychotic patients suffering from schizophrenia, (2) stable patients (not actively psychotic), (3) relatives of these patients, and (4) unaffected controls from the general population. Regarded as a continuum, paranoid ideation is a common experience, and it is important to assess whether the paranoid thought content may be less relevant to a potentially inherited psychopathology than the delusional conviction seen in patients. The fact that paranoid beliefs are to be found in the general population, although in a less severe degrees, may indicate that these cognitive construct are not exclusively due to genetic risk factors, and are present in all individuals as a normative phenomenon (18). On the other hand, it would be possible to determine whether the increase of such beliefs in patient’s relatives, living with the patients, is related to the paranoid symptoms in schizophrenia. This relationship, if existent, may point out to the environmental factors involved in the symptomatology of schizophrenic psychosis.
The main hypothesis is that paranoid beliefs, though an important aspect to consider to the diagnosis of paranoid schizophrenia, are not exclusively seen in people suffering from this psychopathology, and exists in a less severe form in the general population, as suggested in previous studies [6, 22, 23]. It is expected that the main distinction between these four groups concerns the severity and frequency of paranoid experiences, with undiagnosed participants experiencing the less frequent and severe paranoid ideation than diagnosed participants. It is also hypothesized that (a) among the undiagnosed participants, relatives of people with schizophrenia may differ concerning the frequency, distress, and conviction in paranoid ideation in comparison to healthy controls (undiagnosed participants from the general population), considering the higher morbidity risk and paranoia-proneness presented by close relatives of patients with schizophrenia; and (b) that the actively psychotic patients present the most frequent and severe paranoid symptoms, in comparison to the other 3 groups, and (c) specific paranoid beliefs are associated with psychopathology, while some paranoid beliefs are more unspecific and found to be present across clinical and non-clinical participants.
2. METHODS
2.1. Participants and Procedures
A total of 187 subjects participated in this study. Participants with schizophrenia were contacted in Madeira and Azorean Islands after obtaining approval from ethical committee in 3 mental health institutions. Diagnosis and current condition was confirmed with the responsible psychiatric staff and by consulting the patient’s files. Only the patients that received a schizophrenia diagnose in the last 6 or more months entered the clinical samples in this study. The 91 patients that filled this criteria were then divided into 30 participants suffering from schizophrenia currently in remission, and 61 participants actively psychotic. The non-clinical samples were 64 healthy controls (drawn from the general Azorean population) and 32 undiagnosed first-degree relatives of the participants with schizophrenia. Study goals were explained to all participants, who gave their informed consent and agreed to the administration of self-report scales. Participants with schizophrenia often required assistance filling the assessment protocol, and a psychologist was present at all times to administer the scales in interview format.
2.2. Measures
General Paranoia Scale- GPS, [15, 24] The GPS is a 20-item self-report questionnaire designed to assess paranoid
ideation in non-clinical populations. Items are coded in a 5 point Likert scale and total score can range from 20 to 100, with higher scores suggesting the presence of more paranoid ideations. Items’ content relate to the belief that other people may influence one’s behavior and that may be against the individual in several ways. Such beliefs may provoke suspicion and the impression of being scrutinized by others. The GPS revealed good psychometric properties in studies by Fenigstein e Vanable (15), with internal consistency ranging from .78 to .89 in normative samples. In the current study, Cronbach’s alpha were of .92.
Paranoia Checklist- PC [24,25]. PC was designed to assess three dimensions in clinical populations: frequency of
paranoid thoughts, the degree of conviction that they are real, and the distress related to these thoughts. The PC internal consistency in all dimensions was high, both in the original studies [22] and for the sample in the current study (α > .09). The use of this measure will allow a multidimensional approach to paranoid ideation, as well as assessing paranoid ideation in its more severe aspects.
2.3. Statistical analysis
Data analysis was carried out on SPSS 20.0 (IBM, Corp, 2011). Correlation analyses was performed between results obtained on the different rating scales used in this study. Analysis of variance with post-hoc tests were used to determine differences observed between groups on the assessed variables. Finally, Chi Square tests (χ², with Fischer exact tests, when applicable) were used to assess the distributions of categorical variables.
3. RESULTS
3.1. Sample characteristics
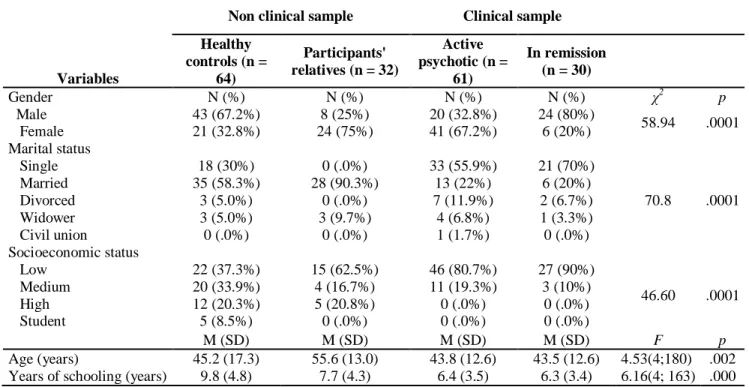
Sample characteristics are presented in Table 1. Differences between groups were found regarding sociodemographic variables, as it is expected in studies with clinical and non-clinical samples. Differences between groups were observed in marital status (χ2
=66.975; p=.000), socioeconomic status (χ2=43.789; p=.000) and years of schooling (F(3,164)=8.230; p=.000), reflecting the psychosocial difficulties and deficits presented both clinical groups when compared with the
non-clinical groups. Concerning age, a significant difference was found between groups (F(3,181) = 5.432; p = .001). Post-hoc
tests revealed that the single difference was between the relatives of participants with schizophrenia and the remaining groups, which is justified by the fact that most of the relatives of the participants with schizophrenia were their caretakers, such as their parents or older siblings (that were almost 10 years older, on average, than participants from other groups). The four groups also differed regarding gender distribution because of an unusual ratio observed in the participants in remission and relatives groups (χ2=35.070; p=.000). However, non-clinical and clinical groups together are gender-equivalent (χ2=.426;p=.560), assuring further comparability.
Table 1: Sample Characteristics (n=187)
Variables
Non clinical sample Clinical sample
Healthy controls (n = 64) Participants' relatives (n = 32) Active psychotic (n = 61) In remission (n = 30) Gender N (%) N (%) N (%) N (%) χ2 p Male 43 (67.2%) 8 (25%) 20 (32.8%) 24 (80%) 58.94 .0001 Female 21 (32.8%) 24 (75%) 41 (67.2%) 6 (20%) Marital status Single 18 (30%) 0 (.0%) 33 (55.9%) 21 (70%) 70.8 .0001 Married 35 (58.3%) 28 (90.3%) 13 (22%) 6 (20%) Divorced 3 (5.0%) 0 (.0%) 7 (11.9%) 2 (6.7%) Widower 3 (5.0%) 3 (9.7%) 4 (6.8%) 1 (3.3%) Civil union 0 (.0%) 0 (.0%) 1 (1.7%) 0 (.0%) Socioeconomic status Low 22 (37.3%) 15 (62.5%) 46 (80.7%) 27 (90%) 46.60 .0001 Medium 20 (33.9%) 4 (16.7%) 11 (19.3%) 3 (10%) High 12 (20.3%) 5 (20.8%) 0 (.0%) 0 (.0%) Student 5 (8.5%) 0 (.0%) 0 (.0%) 0 (.0%) M (SD) M (SD) M (SD) M (SD) F p Age (years) 45.2 (17.3) 55.6 (13.0) 43.8 (12.6) 43.5 (12.6) 4.53(4;180) .002
Years of schooling (years) 9.8 (4.8) 7.7 (4.3) 6.4 (3.5) 6.3 (3.4) 6.16(4; 163) .000
3.2. Paranoid ideation as a continuum
Descriptive statistics concerning the variables in this study are presented in table 2. Normality tests were carried out to assess distributions of the scores on the paranoia subscales for all groups. Results show that distributions in the GPS scores are not only continuous, but normally distributed across the four samples in this study (table 2). However, the Paranoia Checklist variables did not follow a normal distribution for most groups, except for the Distress for participants in remission.
As presented in Table 3, GPS and the PC presented significant correlations, demonstrating a convergence between the two scales that evaluate paranoid ideations.
Table 2: Descriptive Statistics and Normality Tests
Healthy controls (n = 64) Active psychotic (n = 61) In remission (n = 30) Patient's relatives (n = 32)
M SD Min Max W M SD Min Max W M SD Min Max W M SD Min Max W
Freq 25.2 11.4 18 75 .667** 52.0 20.0 18 90 .947* 36.4 19.3 18 85 .853** 23.6 10.4 18 64 .617** Con 37.1 21.7 18 90 .814** 57.7 17.5 18 86 .960* 42.5 19.4 18 86 .914* 29.4 14.4 18 90 .683**
Dis 16.9 17.1 0 58 .857** 36.2 20.1 0 72 .935* 28.9 20.2 0 67 .943 11.4 12.2 0 45 .850**
GPS 41.5 12.4 20 77 .971 57.8 15.7 20 86 .979 48.4 16.7 23 86 .962 37.2 10.2 22 63 .934
Asian Journal of Humanities and Social Studies (ISSN: 2321 – 2799) Volume 02 – Issue 03, June 2014
Table 3: Correlations between GPS and PC (n=187)
GPS PC Frequency PC Conviction PC Frequency .80** Conviction .66** .76** Distress .64** .73** .60** ** p < .001
We then proceeded to the comparisons of the four subject groups using an ANOVA with Welch correction, as a more robust method to assumptions violation [26]. Bonferroni corrections were applied to correct for multiple tests.
In summary (table 4), the GPS indicated a significant difference [F(3, 183) = 21.445, p = 0.000]. Post-hoc analyses indicated that the means of patient’s relatives on GPS scores were significantly lower than both clinical groups (patients in remission and active psychotics), but not from healthy controls. Regarding healthy controls, participants from this group did not significantly differ from patients in remission, but presented a significantly lower mean when compared to active psychotics.
Analyses with the Paranoia Checklist were carried out to allow a more multidimensional approach of paranoid ideation, in dimensions such as the frequency, the degree of conviction and the distress caused by the occurrences of paranoid beliefs. The results also indicated a significant difference in the frequency [F(3, 183) = 33.203, p = 0.000], conviction [F(3, 183) = 24.295, p = 0.000], and distress [F(3, 183) = 20.572, p = 0.000].
Post-hoc analyses indicated the patients in active phase had significantly higher scores for frequency and conviction of paranoia than the other three comparison groups. However, when assessing distress, both patients in active phase and in remission endorsed higher levels of distress and differed from both the unaffected groups on this dimension.
For both the GPS and the PC, all four groups endorsed to some extent every item measured, including distress caused by the occurrence of paranoid ideations.
Table 4: Group Comparisons for GPS (General Paranoia Scale) and PC (Paranoia Checklist)
SS df Welch p
GPS Between Groups 12178.381 3 21.445 .000
Within Groups 35794.732 183
Total 47973.112 186
Frequency Between Groups 28116.213 3 33.203 .000
Within Groups 46294.375 183
Total 74410.588 186
Conviction Between Groups 21263.472 3 24.945 .000
Within Groups 65353.030 183
Total 86616.503 186
Distress Between Groups 18079.446 3 20.572 .000
Within Groups 59326.832 183
Total 77406.278 186
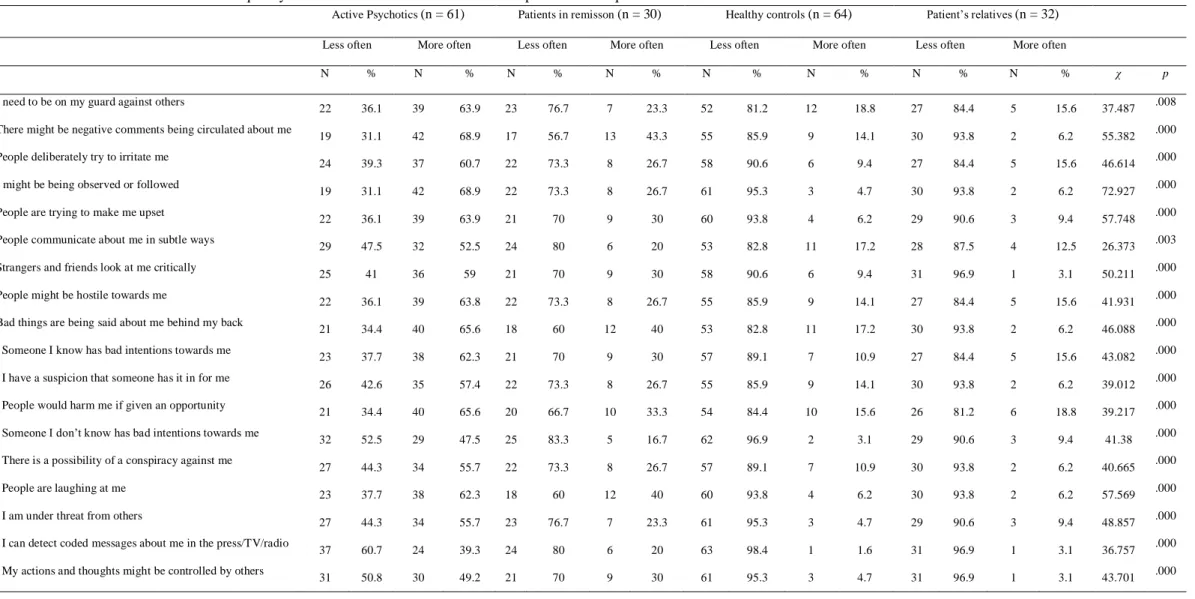
In order to assess the frequency of different paranoid ideations in each group, as assessed by the PC, items answered with “once a week”, “several times a week” and “at least once daily” were grouped together, considering that responses of “hardly ever” and “only once a month” were not indicative of the prevalence of such thoughts. This same criterion was used for analyzing the other dimensions of the PC: conviction and distress.
Chi-square analysis showed that groups differed regarding the frequency, conviction and distress of the 18 items assessed by the PC (see tables 5, 6 and 7). Items #17 and #18 were endorsed lea st often by subjects in each of the groups, being also considered least convincing and associated by participants with the least amount of distress. Conversely, items #2, #10 and #12 were most distressful for subjects in all comparison groups. Item #2 was found most convincing and was most frequently endorsed by all groups. Item #12, while frequently chosen, was not considered as convincing as the latter across all the groups. Finally, item #10 was not considered as convincing and was not as frequently chosen as the latter 2 by subjects in the four groups. However, items #4 and #5 results show a different pattern of responses, which differs by group. They are more convincing, frequently endorsed by and associated with greater distress by patients in the acti vely psychotic group as compared to subjects in all other groups, who endorse them less frequently, consider them less distressful and
Table 5: Distribution of Frequency of Paranoid Beliefs Scores Across Samples and Chi-square Tests for PC
Active Psychotics (n = 61) Patients in remisson (n = 30) Healthy controls (n = 64) Patient’s relatives (n = 32)
Less often More often Less often More often Less often More often Less often More often
N % N % N % N % N % N % N % N % χ p
1. I need to be on my guard against others
22 36.1 39 63.9 23 76.7 7 23.3 52 81.2 12 18.8 27 84.4 5 15.6 37.487 .008
2. There might be negative comments being circulated about me
19 31.1 42 68.9 17 56.7 13 43.3 55 85.9 9 14.1 30 93.8 2 6.2 55.382 .000
3. People deliberately try to irritate me
24 39.3 37 60.7 22 73.3 8 26.7 58 90.6 6 9.4 27 84.4 5 15.6 46.614 .000
4. I might be being observed or followed
19 31.1 42 68.9 22 73.3 8 26.7 61 95.3 3 4.7 30 93.8 2 6.2 72.927 .000
5. People are trying to make me upset
22 36.1 39 63.9 21 70 9 30 60 93.8 4 6.2 29 90.6 3 9.4 57.748 .000
6. People communicate about me in subtle ways
29 47.5 32 52.5 24 80 6 20 53 82.8 11 17.2 28 87.5 4 12.5 26.373 .003
7. Strangers and friends look at me critically
25 41 36 59 21 70 9 30 58 90.6 6 9.4 31 96.9 1 3.1 50.211 .000
8. People might be hostile towards me
22 36.1 39 63.8 22 73.3 8 26.7 55 85.9 9 14.1 27 84.4 5 15.6 41.931 .000
9. Bad things are being said about me behind my back
21 34.4 40 65.6 18 60 12 40 53 82.8 11 17.2 30 93.8 2 6.2 46.088 .000
10. Someone I know has bad intentions towards me
23 37.7 38 62.3 21 70 9 30 57 89.1 7 10.9 27 84.4 5 15.6 43.082 .000
11. I have a suspicion that someone has it in for me 26 42.6 35 57.4 22 73.3 8 26.7 55 85.9 9 14.1 30 93.8 2 6.2 39.012 .000
12. People would harm me if given an opportunity
21 34.4 40 65.6 20 66.7 10 33.3 54 84.4 10 15.6 26 81.2 6 18.8 39.217 .000
13. Someone I don’t know has bad intentions towards me 32 52.5 29 47.5 25 83.3 5 16.7 62 96.9 2 3.1 29 90.6 3 9.4 41.38 .000
14. There is a possibility of a conspiracy against me
27 44.3 34 55.7 22 73.3 8 26.7 57 89.1 7 10.9 30 93.8 2 6.2 40.665 .000
15. People are laughing at me
23 37.7 38 62.3 18 60 12 40 60 93.8 4 6.2 30 93.8 2 6.2 57.569 .000
16. I am under threat from others 27 44.3 34 55.7 23 76.7 7 23.3 61 95.3 3 4.7 29 90.6 3 9.4 48.857 .000
17. I can detect coded messages about me in the press/TV/radio
37 60.7 24 39.3 24 80 6 20 63 98.4 1 1.6 31 96.9 1 3.1 36.757 .000
Asian Journal of Humanities and Social Studies (ISSN: 2321 – 2799) Volume 02 – Issue 03, June 2014
Table 6: Distribution of Conviction on Paranoid Beliefs Scores across Samples and Chi-square Tests for the PC
Active Psychotics (n = 61) Patients in remisson (n = 30) Healthy controls (n = 64) Patient’s relatives (n = 32)
Less convinced More convinced Less convinced More convinced Less convinced More convinced Less convinced More connvinced
N % N % N % N % N % N % N % N % χ p
1. I need to be on my guard against others 19 31.1 42 68.9 15 50 15 50 38 59.4 26 40.6 19 59.4 13 40.6 11.922 .008
2. There might be negative comments being circulated about me
11 18 50 82 12 40 18 60 40 63 24 37.5 25 78.1 7 21.9 39.75 .000
3. People deliberately try to irritate me
17 27.9 44 72.1 16 53.3 14 46.7 45 70.3 19 29.7 23 71.9 9 28.1 27.747 .000
4. I might be being observed or followed
10 16.4 51 83.6 20 66.7 10 33.3 53 83 11 17.2 29 90.6 3 9.4 75.201 .000
5. People are trying to make me upset
13 21.3 48 78.7 20 66.7 10 33.3 50 78.1 14 21.9 28 87.5 4 12.5 57.115 .000
6. People communicate about me in subtle ways 26 42.6 35 57.4 16 53.3 14 46.7 41 64 23 35.9 26 81.2 6 18.8 14.277 .003
7. Strangers and friends look at me critically
17 27.9 44 72.1 15 50 15 50 42 66 22 34.4 29 90.6 3 9.4 37.785 .000
8. People might be hostile towards me
15 24.6 46 75.4 19 63.3 11 36.7 41 64 23 35.9 24 75 8 25 30.408 .000
9. Bad things are being said about me behind my back
13 21.3 48 78.7 13 43.3 17 56.7 37 58 27 42.2 27 84.4 5 15.6 37.093 .000
10. Someone I know has bad intentions towards me
21 34.4 40 65.6 17 56.7 13 43.3 43 67 21 32.8 27 84.4 5 15.6 25.249 .000
11. I have a suspicion that someone has it in forme
19 31.1 42 68.9 18 60 12 40 42 66 22 34.4 28 87.5 4 12.5 30.867 .000
12. People would harm me if given an opportunity
19 31.1 42 68.9 16 53.3 14 46.7 42 66 22 34.4 26 81.2 6 18.8 25.892 .000
13. Someone I don’t know has bad intentions towards me
27 44.3 34 55.7 24 80 6 20 47 73 17 26.6 26 81.2 6 18.8 20.443 .000
14. There is a possibility of a conspiracy against me
26 42.6 35 57.4 20 66.7 10 33.3 48 75 16 25 30 93.8 2 6.2 28.271 .000
15. People are laughing at me
16 26.2 45 73.8 15 50 15 50 47 73 17 26.6 29 90.6 3 9.4 46.036 .000
16. I am under threat from others
24 39.3 37 60.7 23 76.7 7 23.3 49 77 15 23.4 29 90.6 3 9.4 33.014 .000
17. I can detect coded messages about me in the press/TV/radio
34 55.7 27 44.3 24 80 60 20 52 81 12 18.8 30 93.8 2 6.2 19.732 .000
18. My actions and thoughts might be controlled by others
Table 7: Distribution of Degree of Distress on Paranoid Beliefs Scores across Samples and Chi-square Tests for PC
Active Psychotics (n = 61) Patients in remisson (n = 30) Healthy controls (n = 64) Patient’s relatives (n = 32)
Less distress More distress Less distress More distress Less distress More distress Less distress More distress
N % N % N % N % N % N % N % N % χ p
1. I need to be on my guard against others
22 36.1 39 63.9 19 63.3 11 36.7 44 68.8 20 31.2 27 84.4 5 15.6 26.640 .000
2. There might be negative comments being circulated about me
15 24.6 46 75.4 14 46.7 16 53.3 46 71.9 18 28.1 23 71.9 9 28.1 33.908 .000
3. People deliberately try to irritate me
22 36.1 39 63.9 11 36.7 19 63.3 45 70.3 19 29.7 24 75 8 25 24.087 .000
4. I might be being observed or followed
18 29.5 43 70.5 19 63.3 11 36.7 54 84 10 15.6 31 96.9 1 3.1 58.847 .000
5. People are trying to make me upset
20 32.8 41 67.2 15 50 15 50 50 78.1 14 21.9 30 93.8 2 6.2 44.442 .000
6. People communicate about me in subtle ways
35 57.4 26 42.6 20 66.7 10 33.3 49 76.6 15 23.4 28 87.5 4 12.5 10.859 .000
7. Strangers and friends look at me critically
24 39.3 37 60.7 13 43.3 17 56.7 48 75 16 25 29 90.6 3 9.4 33.027 .000
8. People might be hostile towards me
18 29.5 43 70.5 15 50 15 50 47 73.4 17 26.6 23 71.9 9 28.1 28.800 .000
9. Bad things are being said about me behind my back
22 36.1 39 63.9 10 33.3 20 66.7 43 67.2 21 32.8 25 78.1 7 21.9 24.975 .000
10. Someone I know has bad intentions towards me
22 36.1 39 63.9 12 40 18 60 40 62.5 24 37.5 26 81.2 6 18.8 21.639 .000
11. I have a suspicion that someone has it in for me 18 29.5 43 70.5 15 50 15 50 43 67.2 21 32.8 26 81.2 6 18.8 29.003 .000
12. People would harm me if given an opportunity
19 31.1 42 68.9 7 23.3 23 76.7 42 65.6 22 34.4 19 59.4 13 40.6 23.792 .000
13. Someone I don’t know has bad intentions towards me 26 42.6 35 57.4 15 50 15 50 48 75 16 25 27 84.4 5 15.6 22.953 .000
14. There is a possibility of a conspiracy against me
23 37.7 38 62.3 17 56.7 13 43.3 50 78.1 14 21.9 26 81.2 6 18.8 27.750 .000
15. People are laughing at me
21 34.4 40 65.6 11 36.7 19 63.3 53 82.8 11 17.2 26 81.2 6 18.8 43.072 .000
16. I am under threat from others 27 44.3 34 55.7 16 53.3 14 46.7 52 81.2 12 18.8 24 75 8 25 21.637 .000
17. I can detect coded messages about me in the press/TV/radio
34 55.7 27 44.3 27 90 3 10 56 87.5 8 12.5 29 90.6 3 9.4 26.538 .000
Asian Journal of Humanities and Social Studies (ISSN: 2321 – 2799) Volume 02 – Issue 03, June 2014 4. DISCUSSION
Congruous to recent findings, current findings indicate that participants in all groups (schizophrenic patients and non-affected participants) typically endorsed the occurrence of paranoid beliefs measured by the GPS and PC items. This result is consistent with suggestions to the effect that ideations of this kind are not exclusive of paranoid schizophrenic patients, being also present to some extent in the remaining population. In our perspective, this outcome provides further evidence in support of the model of continuity, as posited in the literature reviewed for this study [e.g.: 6, 13, 23, 27-29]. As noted above, it is possible to examine paranoia as a broader construct not restricted to the realm of psychotic symptomatology. We have demonstrated that it is possible to assess paranoia throughout the population in general, from non-clinical groups to clinical groups, demonstrating increased frequency (and intensity) across this population continuum, until it reaches a more delusional level, as seen in schizophrenia.
Using both the GPS and the PC scales, we have detected significantly higher frequencies, conviction, and levels of distress of paranoid ideation in patients suffering from schizophrenia. Given that persecutory and paranoid delusions are critical symptoms for the diagnosis of paranoid schizophrenia, this result was entirely expected. Patients in remission showed few differences from the unaffected groups, possibly indicating treatments’ effectiveness. Interestingly, patients in remission appeared indistinguishable from unaffected controls, but participant’s relatives actually tended to score even less on paranoid symptoms than unaffected controls. This was contrary to our initial hypothesis that relatives would score at an intermediate level, between controls and patients, due to educational factors or the presence of patients with paranoid symptomatology in their immediate environment. A possible explanation to these results is that these participants may present paranoid ideation as everybody else, but the familiarity with paranoid symptomatology of their relatives may yield to a higher tolerance or letting go of these thoughts more easily.
Present results also reveal that actively psychotic patients showed a higher incidence of rare and bizarre ideations (typical of the higher levels of the hierarchy established by Freeman et al. [25], when compared to subjects unaffected by this pathology. This suggests that the specific nature of paranoid beliefs may be more closely associated with schizophrenic disorders. It is also clear that some types of paranoid thoughts are more frequent among individuals (both clinical and non-clinical groups), even though their frequency may differ according to their current condition. However, these more common ideations are of the kind Freeman et al. [25] would classify at the base of their pyramid, since they represent concerns of social evaluation and ideas of reference.
Conviction and distress arising from paranoid beliefs follow the same pattern which defines the frequency of their endorsement. The most usual and "tolerable" paranoid thoughts, belonging to the lowest levels of the hierarchy defined by Freeman et al. [25], are accepted with greater conviction, being distressful to individuals of all groups. On the other hand, the more bizarre ideations, positioned at the top of Freeman´s hierarchy, tend to generate less conviction and distress, and this is true even among actively schizophrenic patients.
This is the first study of its kind in the Portuguese population. Considering the cross-sectional research design, and given the sizes of the groups studied, generalization of results should be regarded carefully, and the unique findings of this study would be enriched with further replication. Another limitation of the current study is the sole reliance on self-report measures. Even with the application of the protocol in interview format, active psychotic may give less reliable responses, especially when compared to their healthy counterparts. The finding that unaffected relatives of patients, though not significantly different from other unaffected, showed a trend towards lower ratings for paranoia than the population in general deserves additional study. It is possible that unaffected relatives, having experienced the societal definition of these thoughts as pathologic, developed a tendency to deny these experiences? It is also possible that they have learned better reality testing through their contact with their affected relatives?
5. CONCLUSION
It is clear that all four groups experience some degree of paranoid ideation, providing evidence that paranoid beliefs are not, per se, a dichotomous phenomenon exclusive of those diagnosed with severe mental illnesses. The frequency and conviction of such ideations, on the other hand, will clearly distinguishes these groups. In the case of more severe paranoia, the distress focuses mainly on how others wish to hurt or to control you (Ellet, Lopes, & Chadwick, 2003), clearly distinguishing this kind distress from the distress caused by common social fears and anxiety. In the latter case, the subject’s own behavior is believed to lead others into judging them negatively, which are present in a more pervasive fashion. By examining paranoid ideation across this population continuum, we verified that these dimensions are present beyond the usual context of psychosis. Taken together, these findings suggest that although paranoid beliefs may be present across different populations, the thought’s contents and the reactions to such thoughts may be a more distinctive feature. This may provide better assessment strategies relating to this construct, as a cause for distress in psychotic and non-psychotic patients, and facilitating treatment. Further, by normalizing, exploring and understanding the continuity of
these paranoid experiences, we may help reducing the stigma experienced by patients and families affected by schizophrenia.
6. ACKNOWLEDGEMENT
The authors would like to thank the cooperation from the Psychiatric Services from the Hospital Divino Espírito Santo, and the staff from Casa de Saúde Nossa Senhora da Conceição and Casa de Saúde São Mig uel. The authors would also like to thank Marina Sousa for preparing the manuscript.
7. REFERENCES
[1] American Psychiatric Association. “Diagnostic and statistical manual of mental disorders” (4th ed.) (American Psychiatric Association), Washington, DC, 1994.
[2] C. L. Bowden, L. S. Schoenfeld, & R. L. Adams. “Mental health attitudes and treatment expectations as treatment variables”, Journal of Clinical Psychology, vol. 36, no. 3, pp. 653-657, 1980. DOI: 10.1037/0735-7028.22.2.149.
[3] P. W. Corrigan. “Mental health stigma as social attribution: Implications for research methods and attitude change”, Clinical Psychology: Science and Practice, vol. 71, pp. 48-67, 2000. DOI:10.1093/clipsy/7.1.48.
[4] A. Mestdagh, & B. Hansen. “Stigma in patients with schizophrenia receiving community mental health care: a review of qualitative studies”, Social psychiatry and psychiatric epidemiology, Vol. 49, no. 1, pp. 79-87, 2014.
[5] G. Thornicroft, E. Brohan, D. Rose, N. Sartorius, & M. Leese. “Global pattern of experienced and anticipated discrimination against people with schizophrenia: a cross-sectional survey”, The Lancet, Vol. 373, no. 9661, pp. 408-415, 2009. DOI:10.1016/S0140-67360861817-6.
[6] W.W. Eaton, A. Romanoski, J. C. Anthony, & G. Nestadt. “Screening for psychosis in the general population with a self-report interview”, Journal of Nervous and Mental Disease, vol. 179, no. 11, pp. 689-93, 1991. DOI: 10.1097/00005053-199111000-00007.
[7] H. Verdoux, J. van Os, S. Maurice-Tison, B. Gay, R. Salamon, & M. Bourgeois. “Is early adulthood a critical developmental stage for psychosis proneness? A survey of delusional ideation in normal subjects”, Schizophrenia Research, Vol. 29, no. 3, pp. 247-254, 1998. DOI: 10.1016/S0920-99649700095-9.
[8] J. van Os, M. Hanssen, R. Bijl, & A. Raveli. “Strauss 1969 revisited: a psychosis continuum in the general population?”, Schizophrenia Research, Vol. 45, no. 1-2, pp. 11-20, 2000; DOI: 10.1016/S0920-99640090323-2.
[9] D. Combs, C. Michael, & D. Penn. “Paranoia and emotion perception across the continuum”, The British Journal of Clinical Psychology, Vol. 45, no. 1, 19-31, 2006. DOI: 10.1348/014466505X29099.
[10] M. Campbell, & A. Morrison. “The Subjective Experience of Paranoia: Comparing the Experiences of Patients with Psychosis and Individuals with No Psychiatric History”, Clinical Psychology and Psychotherapy, Vol 14, no. 1, pp. 63-77, 2007. DOI: 10.1002/cpp.510.
[11] S. Melo, & R. Bentall. “Coping in subclinical paranoia: A two nations study”, Psychology and Psychotherapy: Theory, Research and Practice, Vol. 83, no. 4, pp. 407-420, 2010. DOI: 10.1348/147608310X487542.
[12] B.G. Schimmelmann, C. Michel, N. Schaffner, & F. Schultze-Lutter. “What percentage of people in the general population satisfies the current clinical at-risk criteria of psychosis?”, Schizophrenia Research, Vol. 125, pp. 99-100, 2011. DOI:10.1016/j.schres.2010.09.018.
[13] J.van Os, R.J. Linscott, I. Myin-Germeys, P. Delespaul, & L. Krabbendam. “A systematic review and meta-analysis of the psychosis continuum: evidence for a psychosis proneness-persistence-impairment model of psychotic disorder”, Psychological Medicine, Vol. 39, no. 2, pp. 179-95, 2009. DOI: 10.1017/S0033291708003814.
[14] H. Verdoux, & J. van Os. “Psychotic symptoms in non-clinical populations and the continuum of psychosis”, Schizophrenia Research, Vol. 54, no. 1-2, pp. 59-65, 2002.
[15] A. Fenigstein, & P. Vanable. “Paranoia and self-consciousness”, Journal of Personality and Social Psychology, Vol. 62, no. 1, pp. 129-138, 1992. DOI: 10.1037/0022-3514.62.1.129.
[16] B. A. Alford & A.T. Beck. “The Integrative Power of Cognitive Therapy”, pp. 137-164, (Guilford Press), New York, 1997.
Asian Journal of Humanities and Social Studies (ISSN: 2321 – 2799) Volume 02 – Issue 03, June 2014
[18] T. Binbay, M. Drukker, H. Elbi, F. Aksu Tanik, F. Ozkinay, H. Onay, N. Zagli, J van Os, & -K. Alptekin. “Testing the Psychosis Continuum: Differential Impact of Genetic and Nongenetic Risk Factors and Comorbid Psychopathology across the Entire Spectrum of Psychosis”, Schizophrenia Bulletin, vol. 38, no. 5, pp. 992-1002, 2011. DOI: 10.1093/schbul/sbr003.
[19] I. Kelleher, & M. Cannon. “Psychotic-like experiences in the general population: characterizing a high-risk group for psychosis”, Psychological Medicine, Vol. 41, no. 1, pp. 1-6, 2011. DOI: 10.1017/S0033291710001005.
[20] D. Freeman, K. Pugh, & P. Garety. “Jumping to conclusions and paranoid ideation in the general population”, Schizophrenia research, Vol. 102, no. 1, pp. 254-260, 2008.
[21] E. Peters, S. A. Joseph, & P. Garety. “Measurement of delusional ideation in the normal population: Introducing the PDI”, Schizophrenia Bulletin, Vol. 25, no. 3, pp. 553–563, 1999.
[22] D. Freeman, P. Garety, E. Kuipers, S. Colbert, S. Jolley, D. Fowler, G. Dunn, & P. Bebbington. “Delusions and Decision-making style: Use of Need for Closure Scale”, Behaviour Research and Therapy, vol. 44, no. 8, pp. 263-283, 2005. DOI: 10.1016/j.brat.2005.09.00.
[23] D. Freeman, K. Pugh, N. Vorontsova, A. Antley, & M. Slater. “Testing the Continuum of Delusional Beliefs: An Experimental Study Using Virtual Reality”, Journal of Abnormal Psychology, Vol. 119, no. 1, pp. 83-92, 2010. DOI: 10.1037/a0017514.
[24] B. Lopes Paranoia e Ansiedade Social na População Não-Clínica [Dissertation]. Coimbra: University of Coimbra; 2010. 285p.
[25] D. Freeman, P. Garety, P. Bebbington, B. Smith, R. Rollinson, D. Fowler, E. Kuipers, K. Ray, & G. Dunn. “Psychological investigation of the structure of paranoia in a non-clinical population”, The British Journal of Psychiatry, vol. 186, pp. 427-435, 2005. DOI: 10.1192/bjp.186.5.427.
[26] J. Maroco. “Análise estatística com utilização do SPSS [Statistical analysis using SPSS]”, (Edições Sílabo), Lisboa, 2010.
[27] P. Garety, & D. Hemsley. “Delusions: Investigations into the psychology of delusional reasoning”, (Oxford University Press), Oxford, 1994.
[28] P. Garety, & D. Freeman. “Cognitive approaches to delusions: a critical review of theories and evidence”, British Journal of Clinical Psychology, Vol. 38, no. 2, pp. 113-154, 1999. DOI: 10.1348/014466599162700.
[29] E. Georgaca. “Talk and the Nature of Delusions: Defending Sociocultural Perspectives on Mental Illness”, Philosophy, Psychiatry & Psychology: PPP, Vol. 11, no. 1, pp. 87-94, 2004. DOI: 10.1353/ppp.2004.0038.
[30] M. L. Esterberg, & M.T. Compton. “The psychosis continuum and categorical versus dimensional diagnostic approaches”, Current Psychiatry Reports, Vol. 11, no. 3, pp. 179-84, 2009. DOI: 10.1007/s11920-009-0028-7.
[31] A.R. Yung, B. Nelson, K. Baker, J.A. Buckby, G. Baksheev, & E. M. Cosgrave. “Psychotic-like experiences in a community sample of adolescents: implications for the continuum model of psychosis and prediction of schizophrenia”, The Australian and New Zealand Journal of Psychiatry, Vol. 43, no. 2, pp. 118-28, 2009. DOI: 10.1080/00048670802607188.
[32] L. Ellett, B. Lopes, & P. Chadwick. “Paranoia in a Nonclinical Population of College Students”, Journal of Nervous and Mental Disease, vol. 191, no. 7, pp. 425–430, 2003. DOI: 10.1097/01.NMD.0000081646.33030.EF.