A Comparative Analysis of the Difference
in Female Employment Between Spain and
Portugal
Written by: Sophia Bertelsen Rodrigues Eusébio Academic Advisor: Professor Miguel Gouveia
Dissertation submitted in partial fulfillment of the requirements for the degree of MSc in Economics at Católica-Lisbon School of Business & Economics, August 2015
A Comparative Analysis of the Difference in Female Employment
Between Spain and Portugal
Sophia B. Rodrigues Eusébio
ABSTRACT
This study tries to explain why, according to official data, the female employment in Portugal is 9,4% higher when compared to Spain. Previous literature has found relevant drivers when analyzing employment gaps such as fertility and policies concerning fertility, part-time employment, inconsistency in educational attainment; and on a cross-country basis, cultural aspects such as attitudes towards the woman’s role in society. Although a substantial amount of research has been made, comparing the south with the north of Europe, there is a lack of literature on the comparison of the two Iberian countries. This study tries to fill this gap using data from the European Values Survey. It incorporates variables such as age, fertility, growing up with a working mother, education level, marital status, as well as attitudes towards female labor market activity, in a binary model in order to explain the probability of a woman working. Findings show that education, marital status, attitudes and having grown up in a household where the mother works may be important factors explaining this disparity in employment levels.
RESUMO
Este estudo tenta explicar por que, de acordo com dados oficiais, o emprego feminino em Portugal é 9,4% maior quando comparado com Espanha. Literatura precedente encontrou fatores relevantes para analisar as diferenças de emprego, como a fertilidade e as políticas relacionadas com a fertilidade, part-time emprego, inconsistência no nível de escolaridade; e em uma base cross-country, aspetos culturais, tais como atitudes em relação ao papel da mulher na sociedade. Embora uma quantidade substancial de investigação tenha sido feito comparando o sul com o norte da Europa, há uma falta de literatura sobre a comparação entre os dois países ibéricos. Este estudo tenta explicar a diferença cross-country nas taxas de emprego das mulheres entre Portugal e Espanha, utilizando dados do European Values Survey. Ele incorpora variáveis como a idade, a fertilidade, a crescer com uma mãe que trabalha, nível de educação, estado civil, bem como atitudes em relação à atividade do mercado de trabalho feminino, num modelo binário para examinar a probabilidade de uma mulher trabalhar. Os resultados mostram que o nível de educação, estado civil, atitudes e tendo crescido em uma casa onde a mãe trabalha podem ser fatores importantes para explicar esta disparidade nos níveis de emprego.
ACKNOWLEDGEMENTS
First and foremost, I would like to express sincere gratitude to my academic advisor Professor Miguel Gouveia for all the guidance, useful insights and support throughout this entire thesis process. I would also especially like to thank my academic director Professor Teresa Lloyd-Braga for all her support during these two years as a Católica-Lisbon master student.
Most of all, I am thankful to my family, and especially to my parents, who have always believed in and supported me through all my endeavors. To my chosen second Norwegian family: Carina, Maria, Martine, Jeanett and Christina. –Without you I would surely not be the person I am today.
On a broader note, I would like to thank my Lisbon and Brussels people who made this master’s degree such an unforgettable experience. A Special thanks goes out to my support crew: Martine, Agata, Valentina, Maria and Andrea. –Thanks for the laughs and the tears one is forced to experience when battling through a master’s degree. To my study buddies Vasco and João: –You indeed made some of the most unbearable parts bearable. And last, but not at all least: CarloAlberto, Markus, Paul, Francisco, Suzanne, Julian, Karoline, Nina, Marianne, Riccardo, Denis and Alena. –Thanks for all the memories created during these two hallucinating years. Ultimately, it was all worth it.
TABLE OF CONTENTS
TABLE INDEX ... 6 FIGURE INDEX ... 6 1. INTRODUCTION ... 7 2. LITERATURE REVIEW ... 10 2.1.INTRODUCTION ... 10 2.2.FERTILITY ... 12 2.2.1. Fertility Rates ... 122.2.2. Child Care Costs ... 15
2.3.LABORMARKETINSTITUTIONS ... 16
2.3.1. Unemployment ... 17 2.3.2. Part-Time Jobs ... 18 2.3.3. Parental Leave ... 19 2.4.EDUCATION ... 21 2.5.CULTURE ... 22 2.5.1. Introduction ... 22
2.5.2. Attitudes Towards Female Role ... 23
2.5.3. Family Ties ... 24
3. RESEARCH METHODOLOGY ... 25
3.1.DATA ... 25
3.2.THEMODEL ... 27
3.3.PROBITANDLOGITMODELS ... 30
3.3.1. Binary Outcome Models ... 30
3.3.2. Maximum Likelihood Estimation ... 32
3.3.3. Goodness of Fit Measures ... 34
3.3.4. Marginal Effects and Odds-Ratios: Interpretation of The Coefficients ... 34
4. RESULTS ... 37 4.1.PORTUGAL ... 38 4.2.SPAIN ... 40 4.3.CROSS-COUNTRYANALYSIS ... 41 5. CONCLUSIONS ... 44 5.1.LIMITATIONS ... 45
5.2.SUGGESTIONSFORFURTHERRESEARCH ... 46
APPENDIX ... 51
A.1.GENERALATTITUDES ... 51
A.2.STATAOUTPUTS ... 54
A.2.1. Portugal ... 54
A.2.2. Spain ... 56
A.2.3. Cross-Country ... 58
A.3.INTERACTIONEFFECTS ... 60
TABLE INDEX
TABLE 1. Historical Time Series Overview……….. 8
TABLE 2. Evolution of Fertility and Participation Rates In Europe………..… 13
TABLE 3. Fertility Rates and Benefits……….…. 15
TABLE 4. Decomposed Gender Wage Gap……… 17
TABLE 5. Part-Time and Service Sector Employed Women, 2013………... 19
TABLE 6. Maternity Leave Policies in Europe………... 20
TABLE 7. Evolution of Tertiary Educational Attainment by Gender, in 1000….………. 22
TABLE 8. Family Ties……….. 25
TABLE 9. Females 18-64, EVS 2008………... 27
TABLE 10. Correlations Portugal………. 28
TABLE 11. Correlations Spain………... 29
TABLE 12. Regression Results For Portugal………. 38
TABLE 13. Regression Results For Spain……… 41
TABLE 14. Cross-Country Regression Results………….……….……….. 43
FIGURE INDEX
FIGURE 1. Female Employment and Growth Rate Of GDP, Spain……….……... 9FIGURE 2. Number of Large Enterprises In 2010……….….. 10
FIGURE 3. Evolution of Fertility And Participation Rates (15+) In OECD………….……. 13
FIGURE 4. Unemployment Rates Versus Total Fertility Rate in Portugal……….. 18
1. INTRODUCTION
Spain and Portugal have many similarities in their history. Both countries endured long-living dictatorships that ended in the 70s, consequently sparking an evolution both socially and in the labor market, while returning to economic and political stability in the 80s (Blanchard and Jimeno, 1995, Cantó et al., 2002), and furthermore, joining the European Union in the mid-eighties (Macedo and Santos, 2013). Given these seemingly similar facts, one might be tempted to assume that they have the same female employment rates. However, despite the similarities, official data presents a 9,4% difference between the female employment in Spain and Portugal, with the former coming up short (Eurostat, 2015b). The two countries also exhibit significant differences with respect to some other important aspects. Spain is four times more populated than Portugal (Eurostat, 2015g) and much wealthier in terms of GDP per capita (Eurostat, 2015d). Moreover, the job security legislation is tighter, unemployment benefits are larger, and the collective wage bargaining is less flexible in Spain than in Portugal (Cantó et al., 2002, Bover et al., 1998). Nevertheless, the latter might be one explanation for the higher earnings inequality that can be witnessed in Portugal (Cantó et al., 2002, Bover et al., 1998).
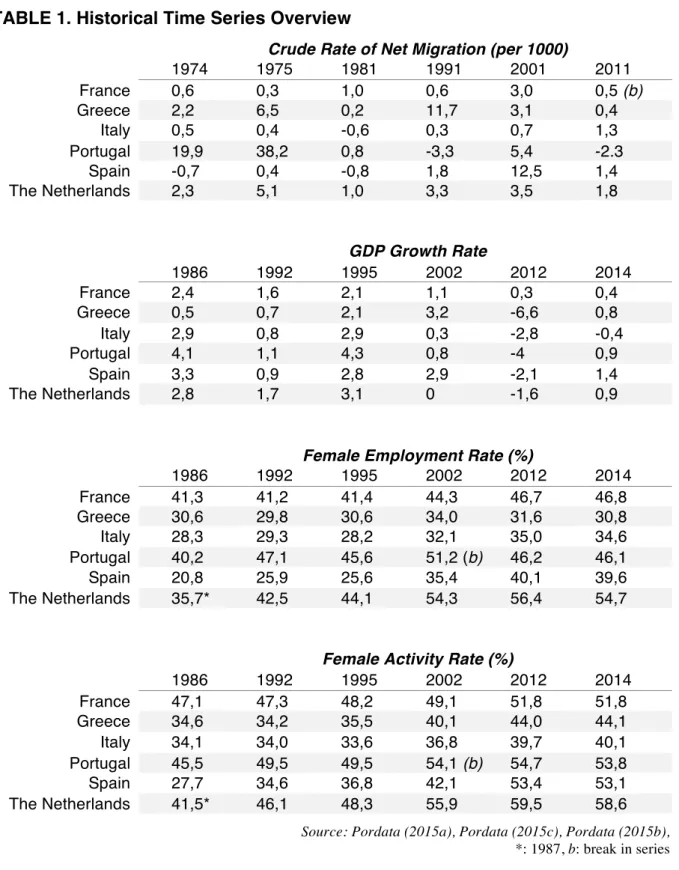
Table 1 works as an overview of the evolution of working women in a selection of European countries. We can see that the crude rate of net migration – the ratio of the net migration during the year to the average population in that year, per 1000 inhabitants – was overwhelmingly high in Portugal during the mid 70s, compared to other European countries, including Spain. Furthermore, the female employment rate – the ratio between the employed population and the population aged 15 years and over – in Portugal in the mid-80s was double the size of the Spanish, until it reached its peak in 2002, and stagnated. This can be seen in relation with the growth rate of the two economies, as the Spanish rate of GDP growth surpassed the Portuguese rates during the end of the nineties. The activity rate, – the ratio of the labor force to the population aged 15 and over, in percentages – which also includes the unemployed, of the Spanish females has in fact almost caught up with the Portuguese.
TABLE 1. Historical Time Series Overview
Crude Rate of Net Migration (per 1000)
1974 1975 1981 1991 2001 2011 France 0,6 0,3 1,0 0,6 3,0 0,5 (b) Greece 2,2 6,5 0,2 11,7 3,1 0,4 Italy 0,5 0,4 -0,6 0,3 0,7 1,3 Portugal 19,9 38,2 0,8 -3,3 5,4 -2.3 Spain -0,7 0,4 -0,8 1,8 12,5 1,4 The Netherlands 2,3 5,1 1,0 3,3 3,5 1,8 GDP Growth Rate 1986 1992 1995 2002 2012 2014 France 2,4 1,6 2,1 1,1 0,3 0,4 Greece 0,5 0,7 2,1 3,2 -6,6 0,8 Italy 2,9 0,8 2,9 0,3 -2,8 -0,4 Portugal 4,1 1,1 4,3 0,8 -4 0,9 Spain 3,3 0,9 2,8 2,9 -2,1 1,4 The Netherlands 2,8 1,7 3,1 0 -1,6 0,9
Female Employment Rate (%)
1986 1992 1995 2002 2012 2014 France 41,3 41,2 41,4 44,3 46,7 46,8 Greece 30,6 29,8 30,6 34,0 31,6 30,8 Italy 28,3 29,3 28,2 32,1 35,0 34,6 Portugal 40,2 47,1 45,6 51,2 (b) 46,2 46,1 Spain 20,8 25,9 25,6 35,4 40,1 39,6 The Netherlands 35,7* 42,5 44,1 54,3 56,4 54,7
Female Activity Rate (%)
1986 1992 1995 2002 2012 2014 France 47,1 47,3 48,2 49,1 51,8 51,8 Greece 34,6 34,2 35,5 40,1 44,0 44,1 Italy 34,1 34,0 33,6 36,8 39,7 40,1 Portugal 45,5 49,5 49,5 54,1 (b) 54,7 53,8 Spain 27,7 34,6 36,8 42,1 53,4 53,1 The Netherlands 41,5* 46,1 48,3 55,9 59,5 58,6
Source: Pordata (2015a), Pordata (2015c), Pordata (2015b),
*: 1987, b: break in series We can argue that the observed numbers of crude rate of migration in particular, might suggest that some of the difference in female employment between Spain and Portugal may be a cause of demand and not necessarily supply of female labor. The 1933 Constitution of the Portuguese authoritarian regime Estado Novo wanted to keep close control over the labor exportation, and the freedom to emigrate was only made legal when written into the 1976 Constitution that followed the Carnation Revolution (Baganha, 1998). In spite of this,
research suggests that between 1959 and 1980 more than one million Portuguese left the country illegally (Baganha, 1998). In fact, these migrants were for the most part unskilled, young adult males (Baganha, 1994), which led to a shortage of labor and consequently recruitment of female workers (Torres et al., 2011). Some sociologists and historians suggested that the outflow of Portuguese migrants in this period was due to the duality, of modern and traditional economy, of the society (Nunes, 1964), and economists for the most part emphasized factors such as international wage differences (Baganha, 1998). We do however know that there was an unknown number of emigrants leaving Portugal as a protest against the regime or to escape the mandatory military service due to the colonial wars in Africa (Baganha, 1994). In the years following the 1974 revolution more than four hundred thousand Portuguese were forced to return from the African colonies, as well as more than one hundred thousand troops (Baganha, 1998).
Summarizing, one reason for the historical difference between Spanish and Portuguese employment rates of females may be due to the fact that Portuguese men left the country, consequently leaving the women not only with greater employment opportunities, but also in need of an income to support the household. When the colonial wars ended, and the men returned to the country, it permitted large transformations in the Portuguese society (Torres et al., 2011), and it is not difficult to imagine that women were reluctant to go back to their former dependency.
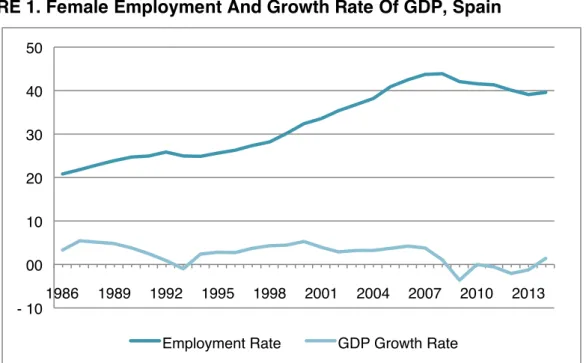
FIGURE 1. Female Employment And Growth Rate Of GDP, Spain
- 10 00 10 20 30 40 50 1986 1989 1992 1995 1998 2001 2004 2007 2010 2013 Employment Rate GDP Growth Rate
However, as previously stated, the rate of employment in Spain has increased drastically the last thirty years. Figure 1 plots the Spanish female employment rate versus the GDP growth rate. The pattern in evolution of female employment rate in Spain follows, to some extent, the growth of the economy, which might suggest that the demand for female employment in Spain is a major cause for its increase in employment levels, which is slowly catching up to Portugal.
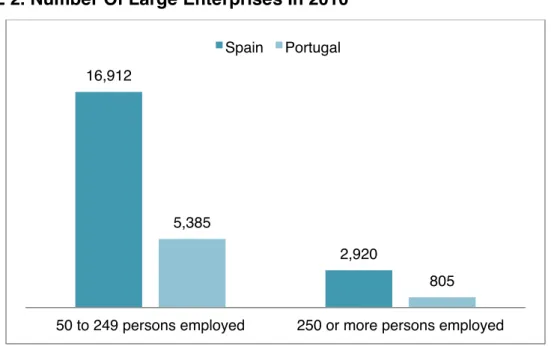
FIGURE 2. Number Of Large Enterprises In 2010
Source: Eurostat (2015a)
Furthermore, the number of large enterprises located in Spain is much greater than in Portugal. Figure 2 illustrates this difference, strengthening the argument of demand growth as a reason for the sudden growth in employment, and consequently also activity levels of women in Spain, compared to Portugal, the last decade.
2. LITERATURE REVIEW
2.1. INTRODUCTION
Many academics have tried to explain cross-country differences in female labor market participation. The traditional approach relied on pure economic variables such as the wage gap, and human capital investment. For instance, one of the founding fathers of New Home Economics, Mincer (1962), considers the female labor supply to be contingent on demographic attributes, such as male and female earnings, non-earnings income, number of
16,912
2,920 5,385
805 50 to 249 persons employed 250 or more persons employed
children, and age (Hill, 1983). In his basic model of labor economics, women allocate their time between labor market work, household work and leisure, where their decision depends on changes in the market wage relative to household productivity (Mincer, 1962, Arellano and Bover, 1995, Katz, 1997, Willis, 1973). This, provided that there exists a positive substitution effect from the higher wage, is larger than the negative income effect due to higher household income. The second co-founder of this approach to the economics of family decisions, Becker, was the first modern mainstream economist to take the production of goods and services within the household seriously (Katz, 1997, Jaumotte, 2003). The theory of New Home Economics has, however, received critique due to its failure in considering the individuals who make up the families and the power relations that affect the allocation of the resources within a given household (Katz, 1997).
In general, academics agree on the fact that the women’s age, schooling, the availability of part-time jobs and child care all have positive effects on their labor supply (Antecol, 2000, Bardasi and Gornick, 2000, Willis, 1973). A theory behind the major shift in female participation is that it is resulting from structural factors that have shifted female earnings potential, in particular from the increase in university education and the decrease in birth rates (Arellano and Bover, 1995). Nevertheless, the existence of the double burden, an expression commonly used in gender studies to describe women’s work in the labor market and their unpaid private care and housework, is also considered as limiting female participation (Macedo and Santos, 2013, Jaumotte, 2003).
During the last decades the research shifted towards tracing processes of social change, and focused more on issues such as culture and preferences with regards to intra-household and labor market decisions (Bardasi and Gornick, 2000). The behavior of the family as a complex social institution, is determined jointly by the preferences and capacities of the members, combined with the social and economic environment in which they are placed and expect to face in the future (Willis, 1973, Katz, 1997). Moreover, in cross-country comparisons, some research focuses on the unaligned stages of development of countries (Macedo and Santos, 2013), and in the manner that social and economic factors are restricted because of this, even though we can observe a decline in fertility as well as an increase in participation rates across almost all industrialized countries (Ahn and Mira, 2002).
The labor market in Spain, on the other hand exhibits the lowest female employment rates in the EU (Eurostat, 2015b), as well as one of the largest wage gaps between genders (Cebrián and Moreno, 2015). Thus, we could question if, to some extent, low female participation levels observed in the South are due to market failures and policy distortions, and if they might reach higher welfare levels by removing or correcting for these (Jaumotte, 2003). Indeed, some researchers argue that the changes in the theoretical approach to within-household decisions are especially important for economic policies, seeing that the effects of these policies are not neutral in regards to within-household resource distribution (Del Boca et al., 2003). In fact, they can lead to contrasting behaviors, depending on, for instance, if the male or the female is the main beneficiary of the policy (Del Boca et al., 2003).
2.2. FERTILITY
2.2.1. Fertility Rates
As previously touched upon, fertility and female labor market participation might still be considered as mutually exclusive events in many countries. Actually, fertility can be considered as a main determinant of participation, where an increase in participation has been associated with a decrease in fertility rates (Arellano and Bover, 1995), particularly since being a mother reduces the probability of working (Bardasi and Gornick, 2000). Today, there has been research devoted to the study of the interrelationship, although economists traditionally were hesitant to study fertility behavior because of difficulty to incorporate it in traditional consumer theory (Willis, 1973). In fact, over two centuries ago Malthus predicted a positive association between growth of the population and growth of income, based on the assumption that when incomes are higher, people marry earlier and decide to have more children (Ahn and Mira, 2002, Becker, 1960). Over the last hundred years, however, we have witnessed nations go through industrialization, and experience growth in incomes accordingly, while the rate of fertility tumbled (Ahn and Mira, 2002).
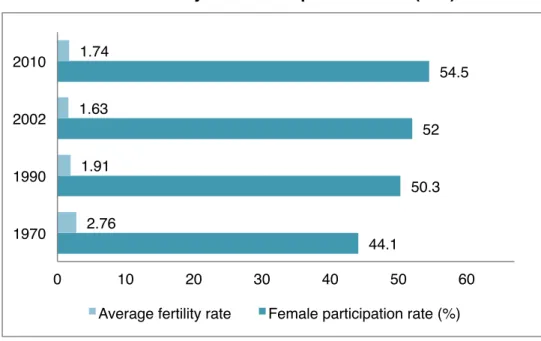
In OECD countries the participation rates of females aged 15+ have steadily increased over the last century, and Figure 3 illustrates the evolution over the last forty years. On the other hand, the fertility rates dropped substantially from the 70s, through the 90s, and reached a low point in 2002, where the average number of children per women between 15 and 49 was only 1,63. Nevertheless, the fertility rate started to increase after 2002.
FIGURE 3. Evolution Of Fertility and Participation Rates (15+) in OECD
Source: OECD (2015b), OECD (2013)
Table 2 lays out more detailed information for a selected group of European countries as well as the EU average. Female participation of females between 25 and 64 has increased in all the countries, although the numbers for Spain exhibit higher growth rates than Portugal. Furthermore, the total fertility rates have decreased in all countries, except for Sweden.
TABLE 2. Evolution of Fertility and Participation Rates In Europe
Female participation rate (25-64) (%) 1983* 2000 2014
Spain 34.7 45.0 57.2
Portugal 59.8 67.1 66.7
Italy 40.1 42.9 52.6
Sweden 78.3 76.7 80.7
EU (27) average - 58.3 65.6
Total fertility rate 1980* 2000 2013
Spain 2.20 1.23 1.27
Portugal 2.18 1.55 1.21
Italy 1.64 1.26 1.39
Sweden 1.68 1.54 1.89
EU (27) average - 1.48 1.55
Source: (*) Del Boca et al. (2003), Pordata (2015d), Eurostat (2015c)
In order to explain this detected negative relation between fertility and income, new models have been developed. Becker (1960) introduced fertility in the economic framework, emphasizing the interaction of income and fertility while distinguishing between the cost and
44.1 50.3 52 54.5 2.76 1.91 1.63 1.74 0 10 20 30 40 50 60 1970 1990 2002 2010
quality of children, claiming that the latter, rather than the former, depends on parental choice (Willis, 1973, Arellano and Bover, 1995). Additionally, he asserted that increases in incomes might lower fertility levels provided that the income elasticity of the quality of children is adequately greater than the income elasticity of the number of children (Becker and Lewis, 1974, Becker, 1960, Willis, 1973). Furthermore, Mincer moved the attention from income effects to the consequence of cost variation of having children, and showed that the opportunity cost of the women’s time, measured as her wage rate, is negatively related to fertility (Willis, 1973, Del Boca et al., 2003, Ahn and Mira, 2002). Moreover, Willis (1973) predicted with his household fertility choice model, that higher female wages and education levels motivate an increase in their labor supply and a reduction in fertility (Del Boca, 2003, Del Boca et al., 2003).
A significant amount of research in the last few decades has gone beyond the wage returns in analyzing female participation and fertility decisions. Some focus on other factors that might influence the decisions, such as individual, household, and labor market characteristics, as well as availability of child care services provided by the state (Del Boca et al., 2003). Influential, yet largely criticized research on female choices between market work and family work is the so called preference theory approach set forth by Hakim (2003). Emphasizing personal values and attitudes in decision making as the center of causal explanation on the micro-level, she criticizes previous research on fertility decisions for over-generalizing female citizens of a country, and argues that their decisions are heterogeneous across lifestyles, and not homogenous within a given country (Hakim, 2003). Furthermore, this theory also takes historical factors, such as the contraceptive revolution during the 60s, into account for explaining the sudden drop in fertility, and argues that when women are in control over decisions regarding fertility, it will be their preferences and values that react to public policies (Hakim, 2003). It was the states neglect of these types of factors that resulted in the sharp fall in fertility in what Hakim (2003) calls for familistic societies, that we can observe in for instance Spain.
There exists empirical evidence which shows that, in the south of Europe, such as Spain and Italy, it is more difficult to combine work and children than in other parts of Europe, which might explain the low levels of both fertility and participation rates, and the institutions are important to clarify the differences (Del Boca 2003). Some of the reasons can be attributed to the poor availability of child care services together with the tendency of longer working
hours, the growing unemployment rates, and the labor market regulations concerning hiring and firing (Bover et al., 1998, Del Boca et al., 2003, Ahn and Mira, 2002, Del Boca, 2003). Accordingly, women would be susceptible to continue working while having children, if more flexible employment opportunities were created (Del Boca, 2003). Correspondingly, one might also argue that the lower fertility and participation rates in Spain and Italy are due to the fact that females marry later, which again might be due to the fact that they are in general attaining higher education levels than before (Davia and Legazpe, 2014). In the Northern European countries, on the other hand, both fertility and participation rates are high, which might be due to the part-time employment opportunities available (Del Boca et al., 2003).
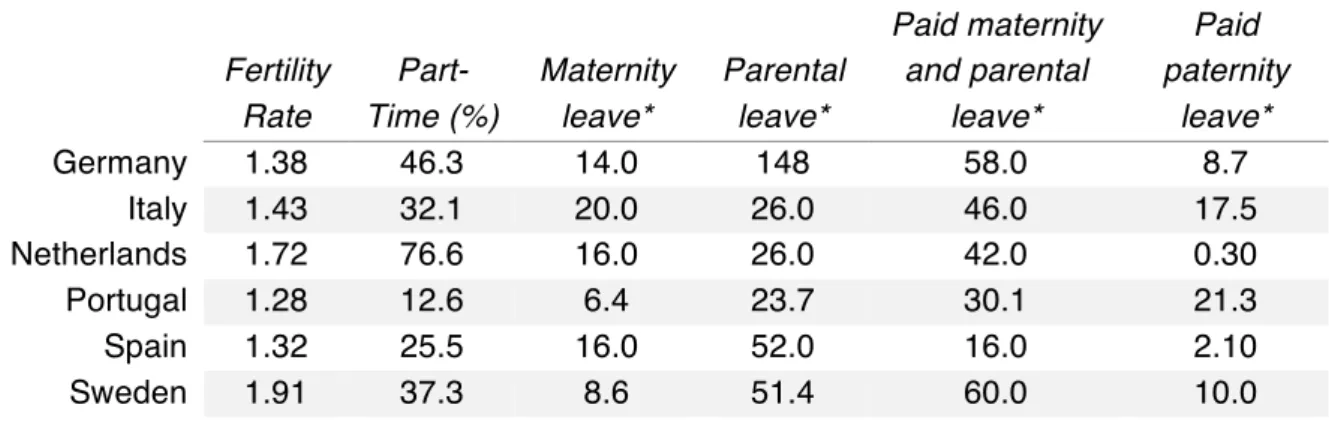
TABLE 3. Fertility Rates and Benefits
Fertility Rate Part-Time (%) Maternity leave* Parental leave* Paid maternity and parental leave* Paid paternity leave* Germany 1.38 46.3 14.0 148 58.0 8.7 Italy 1.43 32.1 20.0 26.0 46.0 17.5 Netherlands 1.72 76.6 16.0 26.0 42.0 0.30 Portugal 1.28 12.6 6.4 23.7 30.1 21.3 Spain 1.32 25.5 16.0 52.0 16.0 2.10 Sweden 1.91 37.3 8.6 51.4 60.0 10.0
Source: Pordata (2015d), Eurostat (2015f), OECD (2015e) *in weeks
2.2.2. Child Care Costs
Fertility and participation rates are positively influenced by social policies aimed at reducing the costs of having children, such as improving the provision of child care (Del Boca, 2003, Del Boca et al., 2003, Ahn and Mira, 2002). Child care subsidies have the effect of increasing the relative return of market work, by reducing the relative price of child care (Jaumotte, 2003). In the majority of the countries that exhibit high fertility rates, child care benefits are also high, while the opposite is true for the southern countries of Europe, such as both Spain and Portugal (Jaumotte, 2003). Additionally, in the south, where the child care benefits provided are not designed to accommodate both working parents, the role of the extended family as a support network, i.e. informal child care, is important for the decision to participate while having children (Del Boca, 2003). So, as people move closer to employment opportunities, and at the same time away from their immediate family ties, the demand for
provision of services will necessarily increase (Del Boca, 2003), and consequently, we can question if the women’s path to social rights depends on access to care of children (Sunström, 1999). Furthermore, empirical research shows that subsidized child care tends to encourage full-time employment, rather than part-time employment (Jaumotte, 2003). Although this may be true, some research divides women in any given country into three subgroups consisting of home-centered, adaptive and work-centered women, placing the majority of the female population in the middle group, and argue that their values and preferences are essentially different, and may consequently come into conflict with one another in matters such as publicly provided child care services (Hakim, 2003). This thought will be further elaborated later.
2.3. LABOR MARKET INSTITUTIONS
Some academics suggest that the overall increase in female participation in the last century might be due to technical changes towards non-manual labor in the production practices, resulting in a shift in the earnings potential and higher demand for skilled non-physical labor, that consequently uncovered new opportunities for women (Bover et al., 1998, Arellano and Bover, 1995, Cantó et al., 2002, Vieira et al., 2005). Albeit, as previously mentioned, there still exists a large variation across countries, which might be explained by differences in labor market institutions (Antecol, 2000). For example, in the case of Spain, where we observe a declining fertility accompanied by higher education levels, the shortfall in participation can be due to the lack of support from the Spanish institutional framework with regards to a combination of female employment and motherhood (Davia and Legazpe, 2014, Cebrián and Moreno, 2015). On the other hand, Portugal experienced a decline in unemployment levels starting in the mid-eighties until 2000, as well as a modernization and restructuring of the economy after joining the European Union, which lead to an increase in demand of skilled workers, but also increased the overall wage inequality (Vieira et al., 2005). Furthermore, it is notable that women, in for instance Portugal, suffer from both vertical and horizontal segregation, signifying that they have less possibilities to enter some industries or certain types of jobs, as well as progressing into higher positions (Macedo and Santos, 2013). Additionally, it is true that women still do not receive equal pay for equal work, with unadjusted figures for Portugal showing a 13% lower wages for female than men, and Spain showing 13.9% (Eurostat, 2015e).
TABLE 4. Decomposed Gender Wage Gap
Spain Portugal
Net daily gender wage gap (%) 13.09 23,8
Unexplained by attributes 89,35% 64%
Explained by attributes 10,65% 36%
Source: Cebrián and Moreno (2015), González et al. (2005)
Table 4 illustrates research results (the numbers for Portugal are taken from a research paper by González et al. (2005) based on data from the Personnel Records (Quadros de Pessoal) for the period 1985-2000) for the adjusted wage gap in Spain and Portugal, where the percentage of the gender wage gap that is unexplained by differences in attributes between males and females, i.e. the level of discrimination, is 89,35% and 64% in Spain and Portugal respectively. Consequently, because of these formal, as well as informal barriers related to the traditional male breadwinner mentality of, especially, the south of Europe, female’s possibilities and positions in the labor market are weaker (Macedo and Santos, 2013), the policies need to be adapted accordingly (Cebrián and Moreno, 2015, Hakim, 2003).
2.3.1. Unemployment
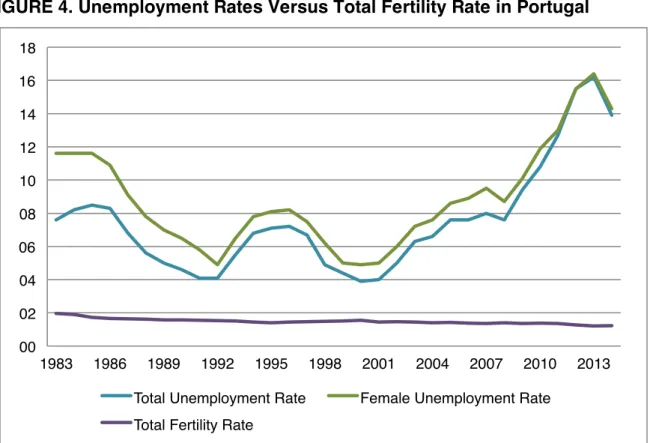
Some research detects that the total fertility rate is pro-cyclical, meaning that it responds negatively to unemployment rates along the business cycles (Arellano and Bover, 1995), and deem the dramatic decline in fertility through the 80s and 90s in countries such as Spain and Italy to be partly caused by the high unemployment rates during this period (Ahn and Mira, 2002). By applying this thought to data on unemployment rates and total fertility rates in Portugal, from 1983 until the newest available data, we find that there is, in fact, a negative correlation (-0.45) between unemployment rates and the total fertility rates in the economy. The result is plotted in Figure 4. Furthermore, previous research show that in countries where wages and female participation rates are lower, the incidence of unemployment is also higher (Ahn and Mira, 2002, Jaumotte, 2003). In fact, studies reveal that Spanish women living in areas where employment prospects are good, are indeed more probable to participate in the labor market, regardless of being married or having children (Davia and Legazpe, 2014), implying that low participation rates of females might be due to lack of demand, rather than supply. Correspondingly, female participation may in fact be indirectly affected by labor market policies aimed at reducing the unemployment rates (Jaumotte, 2003).
FIGURE 4. Unemployment Rates Versus Total Fertility Rate in Portugal
Source: (Pordata, 2015e, Pordata, 2015d)
The intuition is that, in a bad economy wives will wish to work to secure household incomes in case of shocks to the husband’s wage or employment, and thus insecurity leads to lower
fertility (Del Boca et al., 2003, Ahn and Mira, 2002) and at the same time larger incentives for
female participation (Jaumotte, 2003). Moreover, women will refrain from quitting their job in order to have children in periods of high unemployment rates, because this might weaken their future employment prospects (Ahn and Mira, 2002, Del Boca, 2003, Willis, 1973). When comparing women and men between the ages of 20 and 40, results show that women are more inclined to experience employment interruptions due to motherhood, resulting in lower experience gains and therefore also lower wages (Cebrián and Moreno, 2015, Cebrián and Moreno, 2013). The same research, however, finds that when staying in the same job for more than two years, women tend to have a greater wage increase than men. In effect, the wage gap could theoretically vanish if women could work without interruptions (Cebrián and Moreno, 2015).
2.3.2. Part-Time Jobs
Considering the labor market, what are the options available for the agents that are not participating, participating part-time and participating full-time? Since having children decreases the possibility of working, notably in full-time positions, part-time work is heavily
00 02 04 06 08 10 12 14 16 18 1983 1986 1989 1992 1995 1998 2001 2004 2007 2010 2013 Total Unemployment Rate Female Unemployment Rate
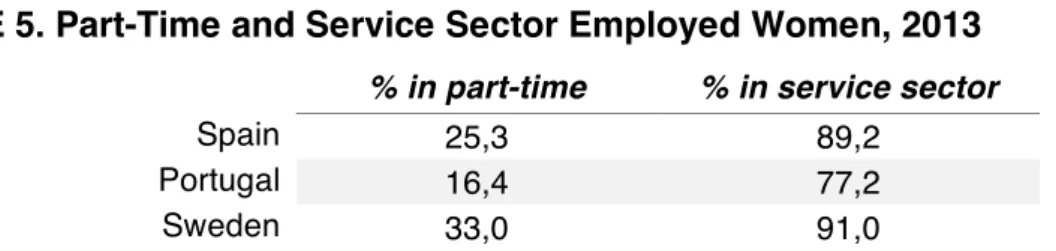
female dominated (Bardasi and Gornick, 2000, Sunström, 1999), and thus, the existence of this sort of employment opportunities increases the probability of female participation all across European countries (Bardasi and Gornick, 2000, Davia and Legazpe, 2014, Buddelmeyer et al., 2004), especially where preferences favor it (Jaumotte, 2003). In the presence of part-time employment opportunities, the choices available increase and therefore attracts workers who were previously unable or unwilling to work full-time (Buddelmeyer et al., 2004). However, this type of employment is more established in the northern part of the continent, which is illustrated in Table 5, where it is also true that a big share of the active women work in the service sector (Del Boca, 2003, Bardasi and Gornick, 2000). Based on this argument, some research suggests that one reason for the limited presence of part-time jobs in the south, such as in Spain and Portugal, may be that the service sector is less developed (Del Boca, 2003, Jaumotte, 2003).
TABLE 5. Part-Time and Service Sector Employed Women, 2013 % in part-time % in service sector
Spain 25,3 89,2
Portugal 16,4 77,2
Sweden 33,0 91,0
Source: OECD (2015d), OECD (2015a)
Firms often hire part-time workers to handle regular and predictable demand peaks or in order to extend opening hours in the evenings and in weekends, which would go beyond the working hours of a full-time employee (Buddelmeyer et al., 2004). Yet, there is a general concern in some countries that part-time work may marginalize women in the labor market, due to the fact these jobs often are characterized by lower wages, fewer fringe benefits, less job tenure and training availability (Jaumotte, 2003, Buddelmeyer et al., 2004). All the aforementioned factors could potentially result in lower chances of promotions, and higher risks of dropping out of the labor market (Jaumotte, 2003).
2.3.3. Parental Leave
Economic theory proposes that parental leave policies, which help women reconcile market and household labor (Jaumotte, 2003), result in more women staying active in the labor market, since they do not have to completely leave employment in order to give birth (Del Boca et al., 2003). This might strengthen their attachment to the labor market, through an increased sense of job security (Jaumotte, 2003). However, in an impact analysis of changes
made to maternity leave policies in Germany during the 70s, there was strong evidence that each expansion induced women to delay their return to work, and furthermore, that they had little effect on mother’s labor force participation rates, and in fact, that they even failed to increase employment continuity of mothers after childbirth (Schönberg and Ludsteck, 2007).
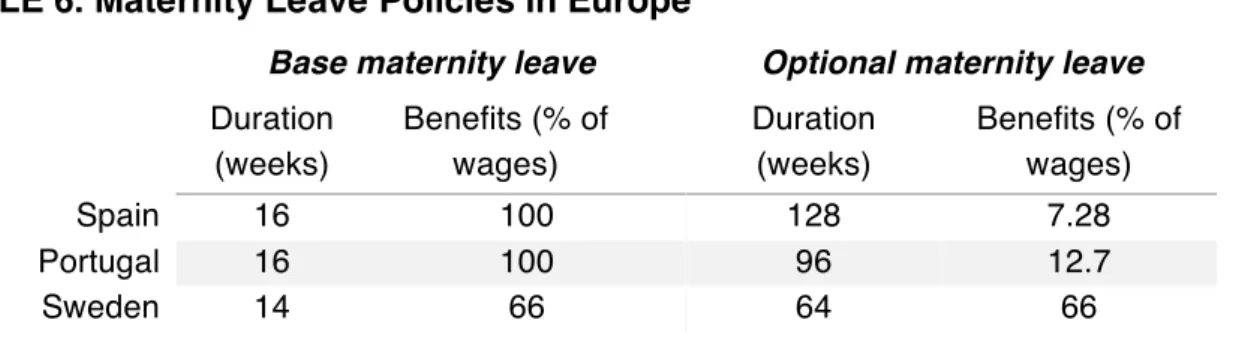
Some, however, argue that it is possible to see a relationship between the generosity of child-related policies (including maternal leave) concerning employment and women’s employment profiles, and assert that where the policies seem to be more generous, as in the Northern European countries, the participation levels of women are higher as well (Del Boca, 2003). Table 6 is an overview of maternity leave policies and their benefits in some European countries, which strengthens this argument.
TABLE 6. Maternity Leave Policies in Europe
Base maternity leave Optional maternity leave Duration (weeks) Benefits (% of wages) Duration (weeks) Benefits (% of wages) Spain 16 100 128 7.28 Portugal 16 100 96 12.7 Sweden 14 66 64 66
Source: Based on data from 2001, Del Boca et al. (2003)
Nevertheless, we can expect the effect stemming from the duration of the offered leave to be negative, because the longer a woman is absent from the workplace, the greater the loss of opportunities of advancement and the greater the skill deterioration (Del Boca, 2003, Jaumotte, 2003), which in turn affects her wage (Schönberg and Ludsteck, 2007). However, on the other hand, a longer leave gives mothers more time to recover from childbirth, while at the same time not having to worry about job security, and therefore, both length and generosity of the benefits are positively related to fertility (Del Boca, 2003).
Furthermore, one might argue that in countries such as Portugal, where firms tend to be smaller (see Figure 2), the opportunity to take out parental leave may result in discrimination from the employer’s side. The intuition is that hiring females could potentially result in higher costs for small firms, since each person’s contribution to the company has bigger impact, and therefore female workers might be more difficult to substitute during potential periods of maternity leave.
2.4. EDUCATION
Education can to some extent be considered a simultaneous decision jointly with participation, because investments in human capital often are done in order to participate in the labor market, and therefore it might be desirable to use education variables as indicators of female earnings potential, instead of their average wage (Arellano and Bover, 1995). The increase in returns to knowledge, through a raise in productivity, and demand of skilled labor can be important determinants of the growth in female education levels (Arellano and Bover, 1995, Cebrián and Moreno, 2015). Albeit it is still true that even when women invest the same amount, or even more, in human capital than men, they are, on average, still paid less (Cebrián and Moreno, 2015), which was previously discussed in relation to Table 4.
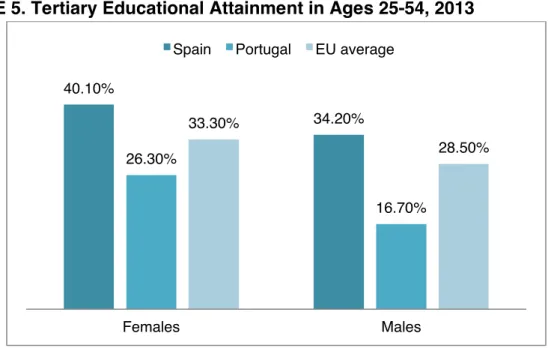
The percentage of females and males between the ages 25-54 in Spain and Portugal that have completed tertiary education is illustrated in Figure 5, comparing it to the EU average. In both cases, we can see that Spain, in fact, has a larger share of population with a university diploma than Portugal, which might be a reason for its increase in female participation levels. Furthermore, and maybe more interesting, we see that in all three clusters, females are more educated than men.
FIGURE 5. Tertiary Educational Attainment in Ages 25-54, 2013
Source: Eurostat (2015h)
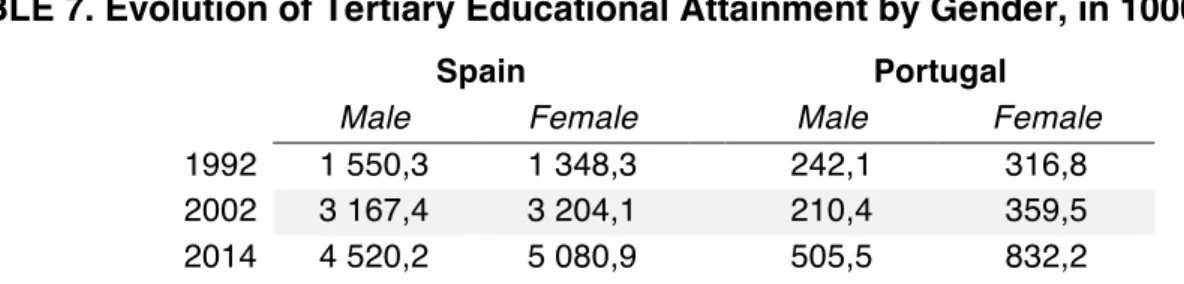
More specifically, Table 7 shows the evolution of tertiary educational attainments in Spain and Portugal since the beginning of the 90s. The number of females investing in tertiary education has increased substantially the last few decades. In fact, since 1992, females have
40.10% 34.20% 26.30% 16.70% 33.30% 28.50% Females Males Spain Portugal EU average
surpassed males. These figures may indeed alter the female positioning in the labor market in the future, since eventually there will be more skilled females than males in the labor market.
TABLE 7. Evolution of Tertiary Educational Attainment by Gender, in 1000
Spain Portugal
Male Female Male Female
1992 1 550,3 1 348,3 242,1 316,8
2002 3 167,4 3 204,1 210,4 359,5
2014 4 520,2 5 080,9 505,5 832,2
Source: (Eurostat, 2015i)
On a slightly different note, there has been research on the role of education in shaping the labor market, as well as the fertility decision, which proposes that highly educated women postpone fertility and have a higher labor market attachment (Bratti, 2003, Del Boca et al., 2003, Del Boca, 2003). Actually, one of the “stylized facts” that we commonly observe in developed countries is the correlation between women’s education, labor force participation and fertility. However, when looking at data for countries with low average years of education for the female population, such as Spain, Italy and Portugal, it also reveals low total fertility rates (Bratti, 2003). In fact, empirical research also reveals that young and highly educated Spanish women are more likely to work and to be inclined to create stable employment careers, thus delaying fertility and consequently having fewer children (Davia and Legazpe, 2014).
2.5. CULTURE
2.5.1. Introduction
During the last few decades researchers have shifted their attention towards other determinants for the variations in female participation which the traditional measurement of human capital does not capture, but might be just as important to explain the probability of female participation (Antecol, 2003). In attempting to assess the effects of cultural factors on gender gaps in the participation rates Antecol (2000) examined ethnic groups within the US, and her results show that culture is significant to explain it. One reason that this type of study is interesting, is because the observed differences are “free” of institutional influence (Antecol, 2000). Particularly, it is possible to find reasons behind the gap in participation that are not attributed to cross-country differences in public institutions. Additionally, we can
consider that culture shapes the utility function of an agent, and thereupon modifies its behavior by influencing the allocation of time between market and home labor (Reimers, 1985). Furthermore, a large amount of papers have studied how culture and preferences towards participation reflect the rates across different countries (Willis, 1973). Some find that women are indeed more prone to work whenever men in their country are positive towards the idea (Antecol, 2003), while others asserts that cultural factors may in fact indirectly affect married women’s participation levels by acting through other factors, such as their education, experience, and fertility choices (Reimers, 1985).
However, some argue that it is not possible to anticipate whether there is a connection between conservative values and lower labor market participation (Davia and Legazpe, 2014). Over the last fourty years, Spain has undergone major political, social and economic transformations, through educational expansion and at the same time changes in preferences and values with regards to work and family (Davia and Legazpe, 2014). It has been rather difficult, however, to unwind whether lower fertility rates are a response to constraints due to lower attatchement to the labor market, or if they are due to preferences (Davia and Legazpe, 2014).
2.5.2. Attitudes Towards Female Role
As a continuum of cultural effects, one might also consider attitudes towards the sexual division of household labor and formal labor participation, and how they influence women’s decision to enter the labor market (Bardasi and Gornick, 2000, Antecol, 2000). The cross-country difference in participation of women depends to a large extent on the male attitudes towards family and sex roles, and in particular if the males are in favor of the women working (Sunström, 1999). Specifically, if male attitudes are supportive of female employment, and if the women had working mothers, then it tends to be stronger (Antecol, 2003). Furthermore, the husband’s contribution to housework has a positive effect on participation and fertility (Del Boca, 2003).
In Portugal, women are the main contributers of household production, with the responsibility of housework, as well as caretaking of elderly, the ill, people with disabilities and children (Macedo and Santos, 2013). Furthermore, home production has traditionally been regarded as a better option to market labor, especially for women (Jaumotte, 2003). One might blame the lagging change of gender relations on this type of gender conflict inside the household, but
also on the lack of incentives created by governments (Sunström, 1999). Under these circumstances, women are sometimes forced to accept a black or grey labor market, as a result of social and labor market policies, as well as geographic and economic disadvantages (Sunström, 1999). Consequently, although it may offer a sensation of economic and personal achievement, they are in a sense cheated of social rights they would otherwise be entitled to in the formal labor market (Sunström, 1999, Macedo and Santos, 2013). The institutional conditions of a country are structured to suit a specific national context, which in turn is determined by historical, economic and social preconditions, and the policies of a country are indeed affected by normative influences (Sunström, 1999). Actually we can perceive policies as to shape, and at the same time are shaped by the actual possibilities available for paid and unpaid work (Sunström, 1999).
2.5.3. Family Ties
As a contribution to the literature on the importance of culture for economic outcomes, and the transmission of cultural traits across generations and their interaction with institutions, the importance of family values has been emphasized, acknowledging family ties as one of the most relevant cultural traits (Alesina and Giuliano, 2010). Focusing on Western Europe, and following the terminology of Reher (1998), we can divide countries between societies of “weak family ties” (the Scandinavian European countries) and “strong family ties” (the Mediterranean group). Strong family tie societies, which include both Spain and Portugal, are based on the “male-breadwinner hypothesis” in which the man works full-time and the woman dedicates herself to housework (Alesina and Giuliano, 2010). Results from the analysis show that strong family ties imply more home production of goods and services (such as child care and other housework) and less participation in market activities especially for women (Alesina and Giuliano, 2010). In the presence of strong family ties, in countries such as Portugal, the family is perceived as the main backbone of economic and social security, and thus there might be negative attitudes towards governmental intervention in the private sphere (Sunström, 1999, Alesina and Giuliano, 2010, Aboim and Wall, 2002). Consequently, seeing that women still have the main responsibility for the domestic and care work, then lack of social services provided by the government essentially becomes a female problem (Sunström, 1999). Table 8 summarizes some findings of a study done by Alesina and Giuliano (2010) analyzing the importance of family on economic behavior. The measure of
family ties is based on answers from the World Value Survey that the researchers argue
TABLE 8. Family Ties
Increase in one standard deviation for family ties
Effect on female labor force participation -0.02*
Effect on the belief that men should work when jobs are scarce 0.02**
Effect on home production 11.6***
*about 4% of the sample mean, **almost 5% of the sample mean, ***14% of the sample mean
Source: Family values in 81 countries, Alesina and Giuliano (2010)
Moreover, this more “traditional” role for women and a higher fraction of young adults living at home, could account for the notable reduction in fertility in the south of Europe (Alesina
and Giuliano, 2010, Davia and Legazpe, 2014). Furthermore, in the presence of what Bardasi
and Gornick (2000) call adult dependents (elderly), the non-wage-earning adults living in the household, further reduces the probability of women working fulltime. Additionally, recent research has in fact expressed the need for an analysis of women’s decisions which are not only based on societal or individual factors, but also on the characteristics, preferences and values of the spouses with whom they share a household (Davia and Legazpe, 2014).
As proven, a substantial amount of research has been done in order to explain employment gaps in countries as well as across countries. Yet, there is a lack of research made on the curious difference in employment rates between the Iberian countries. Therefore, this study aims to explore the female participation levels in Spain and Portugal, and more importantly the difference between them, on the basis of the literature in this chapter.
3. RESEARCH METHODOLOGY
This study uses the probit and logit binary outcome models to analyze female participation levels in Spain and in Portugal, as well as the differences between the levels of the two countries. The following section will cover the research methodology used for the study. First part describes the data; second part defines the variables and the model used; and the last part explains the econometric theory behind probit and logit models.
3.1. DATA
The data used for this study of the cross-country difference between female employment levels in Spain and Portugal is gathered from the 2008 edition of the European Values
Survey. This extensive survey has come in four waves with nine-year gaps, beginning in 1981 covering 19 countries, until 2008 covering 47 countries in Europe, and ranges in topics from moral, religious, societal, political, work, and family values of Europeans. Because of this, it is possible to base the analysis not only on typical economic variables such as earnings and human capital investment, but also on sociological variables such as culture and values, which more recent research suggests might also be important to explain the differences in female employment levels. The representative countries’ samples were drawn from the population of citizens over 18 years of age and the survey was carried out with face-to-face interviews. The data includes both individual demographic characteristics (age, gender, income, etc.) as well as human capital characteristics (education, labor market status, etc.) and our sample for Spain and Portugal combined is 1223 individuals. Since the statutory retirement age in Spain and Portugal was 65 when the survey was carried out, the sample for this study is limited to women aged between 18 and 64 in order to cover the ages where active labor market participation occurs. Moreover, in order to focus only on the employment of the population, the respondents who claim to be students have not been included in the analysis.
In the Portuguese sample there are 606 individuals meeting our inclusion criteria, where 61,7% are working, but only 8% part-time, and on average with 10 years of schooling. Furthermore, the mean age of the female respondents is 44,5 years and on average the working age women in the sample have 1,56 children each. Moreover, 70,5% of the female population in this sample grew up with a working mother, and 62% are married. The Spanish sample contains 617 individuals, where 61,85% are working, 12,6% part-time, on average with 10,9 years of schooling. The mean age of the Spanish women is 40,85 years and on average they have 1,31 children each. Lastly, as much as 77,13% of the Spanish sample grew up with a working mother, while 55,7% were married at the time of the survey.
Looking at the number of children and education in relation to employment in Table 9, we see that almost half of the employed Spaniards do not have children, compared to only one third of the Portuguese. Furthermore, we observe that a significantly larger share of the working female population in Spain have invested in higher education levels.
TABLE 9. Females 18-64, EVS 2008
ARE YOU EMPLOYED?
YE
S
NUMBER OF CHILDREN EDUCATION LEVEL
Portugal Spain Portugal Spain
0 27% 46% Pre- or primary 42% 15%
1 29% 20% Lower and upper secondary 40% 40%
2 32% 25% Higher education 18% 45%
3 7% 5%
4+ 5% 3%
NO
NUMBER OF CHILDREN EDUCATION LEVEL
Portugal Spain Portugal Spain
0 22% 31% Pre- or primary 64% 37%
1 22% 17% Lower and upper secondary 29% 38%
2 34% 28% Higher education 7% 25%
3 13% 18%
4+ 9% 6%
3.2. THE MODEL
The first model that is studyed in this paper is
female working = f(children, working mother, married, attitudes, years of schooling, age, age2)
The variable age and age2 is centered, by subtracting the mean in order to avoid multicollinearity. This problem often occurs when adding the raw square of a variable in the regression. Moreover, age2 is included in the model because we typically assume that the effect of age on the probability of a woman working wears off as she gets older. One reason for this may be health problems that arise with age which forces individuals to exit the labor force before reaching the retirement age.
The dependent variable female working is women between 18-64 years old that are actively participating in the labor market. Furthermore, the model contains four dummy variables:
children, working mother, attitudes and married. The variable children is equal to 1 if the
woman has children, and 0 otherwise; the variable working mother is 1 if the woman grew up with a working mother, and 0 otherwise; the variable married is 1 if the woman is married,
and 0 otherwise; and lastly, the variable attitudes is 1 if the attitudes towards working women are negative, and 0 otherwise. The dummy variable attitudes is measured by combining two value statements from the survey (i) “A pre-school child is likely to suffer if his or her mother
works” and (ii) “Being a housewife is just as fulfilling as working for pay”, where the
registered answers ranges from strongly agree to strongly disagree. Therefore, the dummy variable attitudes is 1 if the individual answered strongly agree or agree, and 0 otherwise. Lastly, the model includes the variable years of schooling, which ranges from no education
attainment to tertiary education attainment. For the Portuguese sample the basic schooling is
nine years, while ten for the Spanish; secondary education is three years in Portugal, and two in Spain; both countries have a four year Licenciatura, which is equivalent to a Bachelor degree ever since the Bologna Process of 1999; and lastly two or more years of education for Master and PhD. The objective is to test whether these factors are significant in explaining the probability of a woman working.
TABLE 10. Correlations Portugal age age2 married
years of
schooling children working mother attitudes
age 1.0000 age2 -0.1118* 1.0000 married 0.1724* -0.1705* 1.0000 years of schooling -0.3391* -0.0877* -0.0844* 1.0000 children 0.3416* -0.2704* 0.3841* -0.2385* 1.0000 working mother -0.0269 -0.0278 0.0355 0.0283 -0.0580 1.0000 attitudes 0.0383 0.0292 0.0471 -0.1334* 0.0481 0.0225 1.0000 *p<0.05
Before carrying on with the individual country regressions, it might be interesting to observe some correlations between the variables in the model. Most interesting in the Portuguese case (Table 10) might be that having children is negatively correlated with years of schooling, implying that the more education a woman has, the less likely she is to have children. Moreover, to some extent surprisingly, there is a negative, yet weak, correlation between growing up with a working mother and having children. This could be surprising because one might consider that an individual, who grew up with a mother that handled the combination of
children and working, would be positive towards the idea. Lastly, there is a strong positive relationship between being married and having children, which implies that most of the mothers in the sample are indeed married.
We observe similar results for the correlations in the Spanish sample (Table 11). However, there is a weak, yet negative, correlation between conservative attitudes towards gender roles and growing up with a working mother. This relationship is anticipated, since we would expect females who grew up in an environment with a working mother to be affirmative of changing gender roles. Furthermore, contrary to the Portuguese sample, growing up with a working mother is positively, although weakly correlated with having children, which is something to be expected.
TABLE 11. Correlations Spain age age2 married
years of schooling children working mother attitudes age 1.0000 age2 0.1523* 1.0000 married 0.2561* -0.0918* 1.0000 years of schooling -0.3811* -0.2886* -0.1122* 1.0000 children 0.4452* -0.0946* 0.5019* -0.2289* 1.0000 working mother -0.0021 -0.0739** 0.0493 0.0832* 0.0039 1.0000 attitudes 0.0470 0.0726** 0.1277* -0.1559* 0.1590* -0.0868* 1.0000 *p<0.05; **p<0.1
In the second part of the study, we will analyze the cross-country difference in female employment levels, and in order to do so, the following model is applied
female working = f(children, working mother, married, attitudes, years of schooling, country, country×education, country×working mother, country×married age, age2)
The additional dummy variable in the model, country, is 1 if the individual is Portuguese, and 0 otherwise. This dummy is also introduced as three interactions in the model,
country×education, country×working mother and country×married. Interaction terms are
the dependent variable is determined by the magnitude of another independent variable (Norton et al., 2004). In this particular study country×education is included in order to deduce how women in the two countries act depending on education level. The second interaction term, country×working mother, measures the effect of growing up with a working mother on the female employment difference between the two countries. And lastly, country×married is introduced to test to which degree being married affects the female employment in the two countries. The objective of this model is to test whether these variables are significant in explaining the cross-country differences between Spain and Portugal in female employment levels.
3.3. PROBIT AND LOGIT MODELS
In this study there are two probable outcomes of the dependent variable: working or not
working. In order to explain the relationship between the dependent and independent
variables, the binary choice models probit and logit are applied to the data (Dougherty, 2001). 3.3.1. Binary Outcome Models
Binary choice models, are models where the outcome is assigned a value of 1 if the event occurs and 0 if it does not occur (Stock and Watson, 2011). In these types of models, the binary dependent variable, also referred to as a Bernoulli variable, female working, 𝑦, is a random variable that represents the propensity to participate in the labor force. In other words the model estimates the probability, through the expectation of 𝑦, that 𝑦 = 1 as a function of the independent variables (Liao, 1994)
𝐸 𝑦 𝑋 = 𝑝𝑟(𝑦 = 1|𝑋) with use of the response probability
𝑝 = 𝑝𝑟 𝑦 = 1 𝑋 = 𝐹 𝑋’𝛽 = 𝑝(𝑋)
where 𝑋 is a 1×𝐾 vector of explanatory variables in our sample, and 𝛽 is a 𝐾×1 matrix (Wooldridge, 2010). There are several types of functional forms that can be used with three types of models depending on the functional form of 𝐹(𝑋’𝛽) being the most often used: the linear probability model; the logit model; and the probit model.
The regression model, also called the linear probability model, looks like 𝐹(𝑋’𝛽) = 𝑋’𝛽
and in this case, the probability of 𝑦 = 1 is assumed to be a linear function of a set of explanatory variables
𝑝 = 𝑝𝑟[𝑦 = 1|𝑋] = 𝑋’𝛽
where 𝛽 is the change in the probability of success, i.e. 𝑦 = 1, given a one-unit increase in 𝑋. For every 𝑋 the distance between the two outcomes and the regression line changes, and thus the error term is not independent of 𝑋 (Dougherty, 2001). Therefore, because of the binary nature of the dependent variable, the error term is heteroscedastic (Stock and Watson, 2011), and the estimates by ordinary least squares are inefficient (Liao, 1994). Nevertheless, the major issue with this regression is that the predicted probabilities will not be limited between 0 and 1 for extreme values of 𝑋, since there is no restriction on 𝑋’𝛽 to be between 0 and 1 (Stock and Watson, 2011, Liao, 1994). Therefore, an increase in 𝑋 is predicted to change the probability of 𝑦 = 1, regardless of the initial value of 𝑋 (Wooldridge, 2010). For this reason, the linear probability model is not usually used when dealing with binary outcomes. In fact, when working with Bernoulli dependent variables we require a nonlinear functional form for the probability, such as in the logit or probit regression models (Stock and Watson, 2011). Both of the aforementioned models use cumulative probability distribution functions, producing probabilities between 0 and 1, and the main difference between them is the assumption on the distribution of the error terms (Wooldridge, 2010). The estimation results of the models are similar, and historically, the main motivation for choosing one rather than the other was that the logit model could be computed faster. However, with the use of computers, the choice has become a decision based on preferences and tastes of the researcher.
The logit model uses a cumulative logistic distribution function
𝐹 𝑋’𝛽 = Λ 𝑋’𝛽 = 1
1 + 𝑒!(!!!)
𝑓′ 𝑋’𝛽 = 𝑒!(!
!!)
(1 + 𝑒!(!!!))!
and therefore the predicted probability is
Pr(𝑦 = 1| 𝑋) = 1
1 + 𝑒!(!!!)
which is limited between 0 and 1. As 𝑋’𝛽 tends to infinity, 𝑒!!!! tends to 0 and 𝑝 has an
upper limit of 1 (Dougherty, 2001). Conversely, as 𝑋’𝛽 tends to minus infinity, 𝑒!!!!
infinity, so 𝑝 has a lower limit of 0.
The probit model, however, uses a standard normal cumulative distribution function 𝐹 𝑋!𝛽 = Φ 𝑋!𝛽 = !!!Φ 𝑡 d𝑡
!!
𝑓′ 𝑋!𝛽 = 2𝜋 !!/!e(!(!!!!)!)
where Φ is the standard normal cumulative distribution function. The predicted probability therefore becomes
Pr(𝑦 = 1| 𝑋) = Φ(𝑋’𝛽)
being limited between 0 and 1. The coefficient 𝛽 in both models represents the change in the z-value associated with a unit change in 𝑋. That means that if the change is positive it increases the probability that 𝑦 = 1 (Stock and Watson, 2011). The standard normal cumulative and the cumulative logistic distribution function are quite similar, except in the tails, and therefore their predicted probabilities are almost identical (Liao, 1994, Greene, 2011).
3.3.2. Maximum Likelihood Estimation
Binary choice models are fitted using maximum likelihood estimation (Liao, 1994), which produces efficient, i.e. minimum variance, estimators that are consistent and normally distributed in large samples (Stock and Watson, 2011). The likelihood function is the joint probability distribution of the data, treated as a function of the unknown coefficients (Stock and Watson, 2011). The maximum likelihood estimator (MLE) of the unknown coefficients, is therefore estimated by the values of the coefficients that maximize the likelihood function (Stock and Watson, 2011). This is indeed the joint probability distribution, and consequently the MLE chooses the values that maximize the probability of drawing the data that are actually observed. Because of this, we can say that the MLEs are the values that most likely produced the data (Stock and Watson, 2011).
If we consider 𝑦 as a Bernoulli random variable, either equal to 0 or 1, the only unknown parameter that needs to be estimated is the probability that 𝑦 = 1, which naturally is the mean of 𝑦 (Stock and Watson, 2011). In order to obtain the MLE, it is necessary to have an expression for the likelihood function, which in turn requires an expression for the joint probability distribution of the data. The joint probability distribution of the two observations
of 𝑦 is
𝑝𝑟 𝑦! = 0, 𝑦! = 1 = 𝑝𝑟 𝑦! = 0 𝑝𝑟(𝑦! = 1)
The Bernoulli distribution is summarized in the formula 𝑝𝑟 𝑌 = 𝑦 = 𝑝! 1 − 𝑝 !!!
so, for 𝑦 = 0, the probability is
𝑝𝑟 𝑦 = 0 = 𝑝! 1 − 𝑝 !!! = 1 − 𝑝
and similarly for 𝑦 = 1
𝑝𝑟 𝑦 = 1 = 𝑝! 1 − 𝑝 !!!= 𝑝
Thus, the joint probability distribution of 𝑦! and 𝑦! is
𝑝𝑟 𝑦! = 0, 𝑦! = 1 = 𝑝! 1 − 𝑝 !!! × 𝑝! 1 − 𝑝 !!!
= 𝑝!!! 1 − 𝑝 !!!!!
= 𝑝(1 − 𝑝) hence, the likelihood function is
𝑓 𝑝; 𝑦!, 𝑦! = 𝑝(1 − 𝑝)
As previously stated, the MLE of 𝑝 is the value of 𝑝 that maximizes this function. The MLE 𝑝 of the Bernoulli probability 𝑝 is the sample average, in other words 𝑝 = 𝑦 (Stock and Watson, 2011).
For the probit model, where the probability of 𝑦 = 1 is Pr(𝑦 = 1| 𝑋) = Φ(𝑋’𝛽), the joint probability distribution is
𝑝𝑟 𝑦 = 0,1|𝑋 = 𝑝! 1 − 𝑝 !!!
It is common to consider the logarithm of the likelihood. The log-likelihood function is therefore ln 𝑓!"#$%& 𝛽; 𝑦 𝑥 = 𝑦𝑙𝑛 Φ 𝑋’𝛽 + ! !!! (1 − 𝑦)𝑙𝑛 1 − Φ 𝑋’𝛽 ! !!!
and the MLE for the probit model maximizes this function.
Equivalently the MLE for the logit model is calculated by maximizing the log-likelihood function ln 𝑓!"#$% 𝛽; 𝑦 𝑥 = 𝑦𝑙𝑛 (1 + 𝑒!(!!!))!! + ! !!! (1 − 𝑦)𝑙𝑛 1 − (1 + 𝑒!(!!!))!! ! !!!