Equity Valuation
Rolls-Royce PLC
Dissertation submitted in partial fulfillment of requirements for the degree
of MSc in Finance, at the Universidade Católica Portuguesa, March 10
th2014.
Mafalda Filipa Sousa Fonseca
152412012
Advisor: Professor José Carlos Tudela Martins
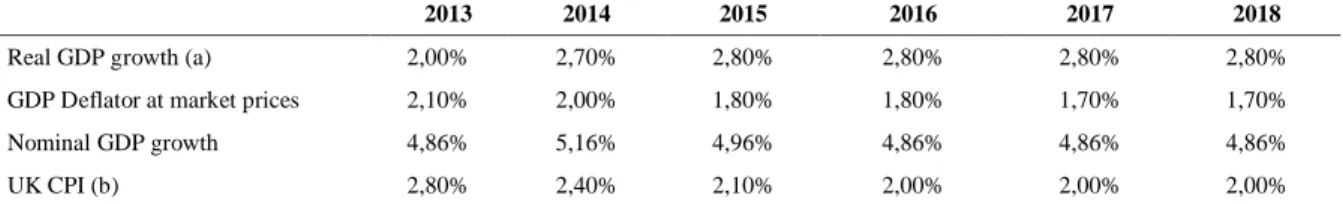
2 -0,1 -0,05 0 0,05 0,1 0,15 0 4 /0 1 /2 0 1 0 0 4 /0 3 /2 0 1 0 0 4 /0 5 /2 0 1 0 0 4 /0 7 /2 0 1 0 0 4 /0 9 /2 0 1 0 0 4 /1 1 /2 0 1 0 04 /0 1 /2 0 11 0 4 /0 3 /2 0 1 1 0 4 /0 5 /2 0 1 1 0 4 /0 7 /2 0 1 1 04 /0 9 /2 0 11 0 4 /1 1 /2 0 1 1 0 4 /0 1 /2 0 1 2 0 4 /0 3 /2 0 1 2 04 /0 5 /2 0 12 0 4 /0 7 /2 0 1 2 0 4 /0 9 /2 0 1 2 0 4 /1 1 /2 0 1 2 0 4 /0 1 /2 0 1 3 0 4 /0 3 /2 0 1 3 0 4 /0 5 /2 0 1 3 0 4 /0 7 /2 0 1 3 04 /0 9 /2 0 13 RR/ LN Equity UKX Index Recommendation:
BUY
Target price:1369
(p)
Company Information: Equity Value (mn): 25.739,93 Debt Value (mn): 3.096.41 # Shares (mn): 1880,278076 Target price: 1369 (p) Price: 1112 (p) – 30th September 2013 JPM Valuation Target: Target Price: 1420 (p) 52 week range: 1177-778 (p) # Shares (mn): 1851 Credit Rating: S&P: AExecutive Summary – Rolls Royce PLC
Rolls-Royce PLC is a top competitor worldwide in the Aerospace & Defense sector.
Despite the current economic crisis that has affected several businesses, the civil aerospace sector where RR operates is expected to thrive. Given the macroeconomic environment where the company operates, it is expected that the civil sector will continue to expand and be the one that drives revenue growth within the company. The defense sector is facing some difficulties mainly due to the defense budget cuts that major strategic players in this sector are imposing – the USA and the EU. Despite this fact, it is expected that its position within this market will continue strong.
One can anticipate that RR will be able to take advantage of the opportunities that will arise, as the company is planning to honor its investment plan contemplating investment in R&D.
In order to reinforce its position within the A&D market, it is expected that R&D investment will reach 5% of the revenues. Moreover, the company is engaged in new projects, namely in the nuclear and energy sector, where it is expected to boost domestic oil production in Abu Dhabi, as well as, in light of a new contract, strengthen China’s energy infrastructure.
Although revenues are expected to continue increasing, rendering the ability of RR to strengthen its position in the market where it operates and, despite the fact that it has established cost reduction as a goal, this report considers that, as costs depend on revenues, they are also expected to increase.
In conclusion, RR continues to be a very stable company with a positive outlook and an A credit rating by S&P thus, being able to finance itself very easily in the markets. The confidence and stability of RR in the markets where it operates and its ability and commitment to grow, innovate and prosper comes as an asset, reinforcing a buying opportunity for investors.
Price Performance
3
Abstract
The purpose of this thesis is to evaluate Rolls-Royce PLC. In order to do so, two valuation methodologies will be presented.
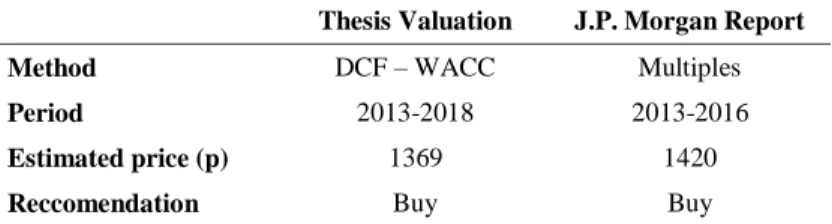
The first one regards the Discount Cash Flow – WACC methodology, where each sector of the company is valued. By doing so, it is possible to reach a price per share of 1369 pence. Therefore, when using this methodology, the company is presented as a buying opportunity (the market yields a price of 1112 pence.)
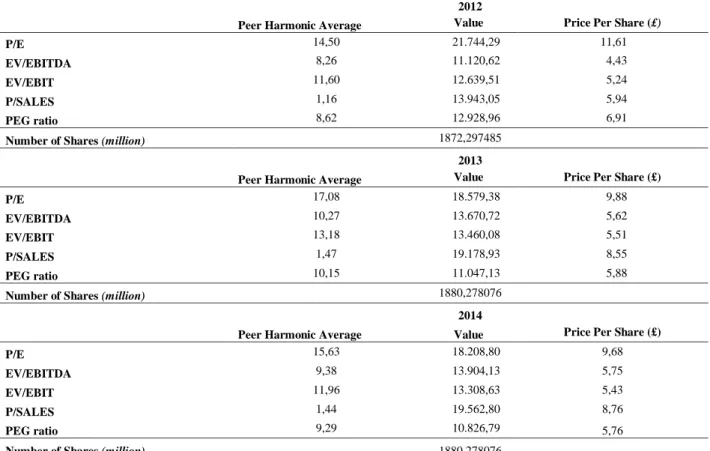
The second valuation presented and which is introduced as a second stage valuation is the multiples one. By using the price to earnings ratio, it is possible to value RR at 988 pence. With this methodology, the company is presented as a selling opportunity.
Finally, when comparing the valuation introduced in this thesis to the one performed by J.P.Morgan, it is possible to conclude that this valuation is more conservative than the one presented by the investment bank (J.P.Morgan presents a price of 1420 pence). The differences in the assumptions will be further analyzed in this report.
4
Acknowledgements
This thesis was an opportunity to further enhance my knowledge in the field of Equity Valuation.
Firstly, I would like to express my gratitude to Professor José Carlos Tudela Martins for his support, continuous guidance and valuable insights throughout this process.
I would like to express my gratefulness to the Rolls-Royce’s Investor Relations Director, Sir Simon Goodson for the promptitude in answering to all my questions regarding the company being studied.
I would also like to thank Sara, Rustam, Maria, Carolina, Sofia and João for the companionship during this period. I would like to thank Catarina and her father for the valuable comments regarding some problems that arose during this process.
Lastly, I would like to thank my parents and my sister for the support and valuable advice trough all these years.
5
Table of Contents
Cover………...………i Executive Summary……….ii Abstract………..…………..iii Acknowledgements………..………iv 1. Introduction ...8 2. Literature Review ...8 2.1. Multiples ...92.2. The peer group ...11
2.3. The Discounted Cash Flow method ...11
2.4. The discount rate ...13
2.5. The Adjusted Present Value ...14
2.6. The Dividend Discount Model (DDM) ...15
2.7. The Economic Value Added (EVA) ...16
2.8. The Terminal Value ...17
2.9. The Present Value of Interest Tax Shield ...18
2.10. The Market Risk Premium ...19
2.11. Emerging Markets ...20
2.12. The risk free rate ...21
2.13. The levered beta ...22
2.14. Option Theory ...23
2.15. Research and Development Expenses ...23
3. Industry Overview... 24
3.1. The aerospace sector ...25
3.2. The defense sector ...26
3.3. The marine sector ...28
4. Rolls-Royce PLC ... 30
4.1. Company Presentation ... 30
4.2. Looking ahead into the future of Rolls-Royce ...31
4.3. Rolls-Royce Dividend Policy and UK Taxation Process ...32
4.4. The Peer Group Selection ...34
5. The Weighted Average Cost of Capital ... 36
5.1. Cost of debt ...36
5.2. The risk free rate and the market risk premium ...37
5.3. The cost of equity ...38
6
6. Valuation Overview ... 39
6.1. Revenue estimation...39
6.2. The Civil Aerospace Sector ...40
6.3. The defense sector ...40
6.4. The marine sector ...41
6.5. The energy sector ...41
6.6 The estimation of the Cost of Sales...42
6.7. Commercial and Administrative Costs ...43
6.8. Research and development costs ...44
6.9. Share results of joint ventures ...44
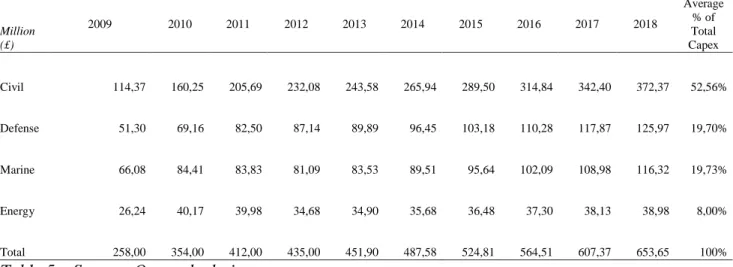
6.10. Capital Expenditure ...44
6.11. Depreciation and Amortization ...45
6.12. The Net working Capital ...46
6.13. Provisions ...47
7. The Discounted Cash Flow Method ... 48
7.1. The Free Cash Flow to the Firm ...48
7.2. The Terminal Value ...48
7.3. Civil Aerospace ...49
7.3.1. Civil Aerospace – Sensitivity analysis ... 49
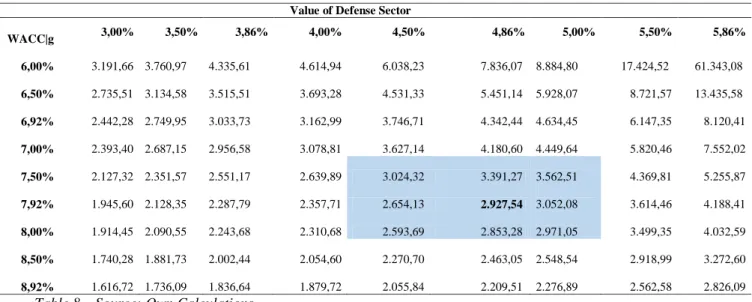
7.4. Defense Aerospace ...51
7.4.1. Defense Aerospace – Sensitivity analysis ... 51
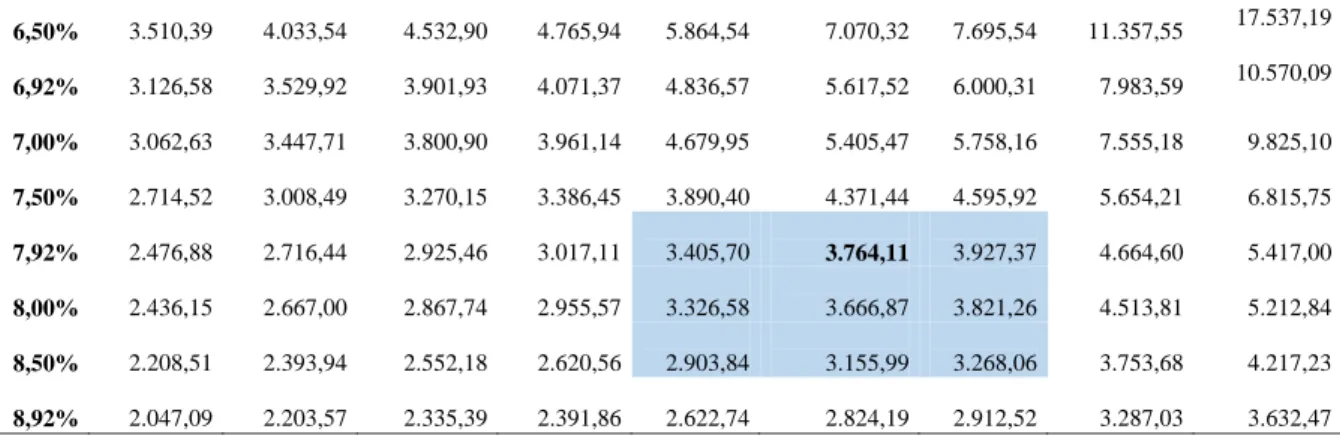
7.5. Marine Sector ...52
7.5.1. Marine Sector – Sensitivity analysis... 52
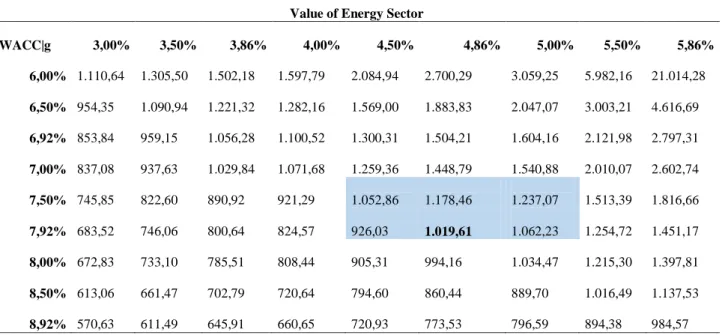
7.6. The Energy Sector ...53
7.6.1. Energy Sector – Sensitivity analysis ... 54
7.7. Roll-Royce’s Value ... 55
8. Multiples Valuation ... 55
9. The Value at Risk ... 58
10. Valuation Comparison: J.P. Morgan ... 59
10.1. Financial indicators estimations’ comparison ...60
11. Conclusion ... 61
12. Annex ... 62
Annex 1 - The peer group selection. ...62
Annex 2 – Roll’s Royce’s Income Statement for 2004-2012. ...63
Annex 3– Rolls Royce’s Income Statement for 2013-2014y...64
7
Annex 6 – The cost of sales. Source: Own calculations and RR’s Financial Reports. ...65
Annex 7 –Commercial Costs...66
Annex 8 –Joint Ventures ...67
Annex 9 – Property, Plant and Equipment, Depreciation & Amortization ...68
Annex 10 – Working capital ...68
Annex 11– Provisions ...69
Annex 12– DCF Valuation: Civil Sector ...70
Annex 13– DCF Valuation: Defense Sector ...70
Annex 14– DCF Valuation: Marine Sector ...71
Annex 15– DCF Valuation: Energy Sector ...71
Annex 16– Total Valuation ...71
Annex 17 – Peer group Multiples ...72
13. Acronyms List ... 73 14. Bibliography ... 74 14.1 - Books ...74 14.2 – Articles ...74 14.3. Other Research ...75 14.4. Seminar Material ...76 14.5. Websites ...76
8
1. Introduction
The aim of this thesis is to evaluate a public listed company and therefore the valuation of Rolls-Royce PLC will be conducted.
In order to do so, a discussion on the several valuation methods and the advantages and disadvantages of each of them will be introduced. This aims at understanding which method better applies to RR.
Then, RR will be valued according to both the Discounted Cash Flow Methodology (WACC) and the Multiples Valuation. After reaching a target value, the price estimated, in this thesis, for RR will be compared to the one that is yielded by the market on 30th September, 2013 (date on which this thesis is based).
Finally, a comparison between the valuation conducted in this thesis and the one presented by J.P.Morgan will be made. The purpose of this comparison is to identify the reasoning behind the differences in price and the consequent assumptions made.
2. Literature Review
The purpose of this section is to get a better understanding of the several methods that are available in order to properly valuate a company. Luehrman (1997) indicates that valuation is the “financial analytical skill”1 that managers want to master.
According to Young et al (1999), “different approaches make different aspects of the valuation problem clear at the expense of obscuring other aspects”2. This is why it is important to understand the methods that can be considered and what are the company’s characteristics that they will privilege. Young et al (1999) further refer that even though there are some similarities among the different valuation approaches, it is necessary that the assumptions made are consistent across the models and even though different valuation methods may yield different final values, it should be possible to compare them and understand why these differences arise.
One should keep in mind that different analysts will evaluate a company in different ways and a final common value will not be reached. Different assumptions will be made and the accuracy of those will define whether a valuation method is valid or not.
As Booth (2002) states, there are many methods that are considered “correct” to perform valuation. This study will introduce the discounted cash flow based ones, the
1 Luehrman, Timothy A.1997. “What’s it worth? - A General Manager’s Guide to Valuation”. Harvard Business Review, pp.132-142
2 Young, M., Sullivan, P., Nokhasteh, A., Holt, W., .1999. “All Roads Lead To Rome – An Integrated Approach to Valuation Models”. Goldman Sachs Investment Research, pp.1-32.
9 multiples approach, options and other methodologies and variables that may be considered relevant for the valuation purpose.
2.1. Multiples
Multiples are considered to be an intuitive tool for valuation and therefore easy to be presented to customers and investors.
According to Damodaran (2012), the main goal of the relative valuation is to value assets, based on similar assets, currently priced in the market. Nonetheless, using the multiples valuation can also be misleading.
One should take into consideration that multiples should be used as a second stage valuation, Fernández (2002), that is, after performing the valuation using another method.
Using multiples as a valuation method allows for the simplification of the underlying assumptions, when compared, for example, to the DCF approach (Damodaran, 2012). Moreover, when computed properly, the multiples can be a useful tool to stress-test the expected cash flows and to understand the position of the company regarding its value creation opportunities (Goedhart et al, 2005).
However, when developing a valuation using multiples, some important factors such as risk, growth or cash flow potential may be ignored, leading to an inconsistent valuation (Damodaran, 2012). Therefore, it is very important that one understands the basic drivers of multiples.
First and foremost, one should start by defining the comparable group that will be used to conduct the valuation. According to Damodaran, a comparable firm is one that presents cash flows, potential growth and risk similar to the company that is being studied. Other criteria such as the size of the comparable firm could also be applied. Moreover, firms that can be identified as peers should compete in the same markets and be subject to the same macroeconomic events (Foushee et al, 2012).
However the aforementioned approaches only translate themselves into relative criteria, therefore, Damodaran suggests a different approach which states that all firms in the market should be considered comparable and so one should control for differences across firms, using multiples regressions, for example. This approach is followed by Bhojraj and Lee (2001). They argue that the regression estimation allows the control of several variables that can influence the independent variable (multiple), by attributing weights to each explanatory variable.
10 When computing multiples, according to Damodaran, one should considerer the basic principles that will lead to a more accurate valuation. The first one is related to the fact that the computation should be consistent, that is, “if the numerator for a multiple is an equity value, then the denominator should also be an equity value. If the numerator is a firm value, then the denominator should also be a firm value”3.
However, it is stated that some analysts do not agree with the previous criteria, arguing that consistency does not matter, as long as the multiple is computed in the same way across firms. Furthermore, a multiple computed for the valuated company, should also be computed for its peers.
Finally, one should understand the basics of a given multiple and how they affect it. For instance, the price to earnings ratio is strongly affected by capital structures and it can be misleading, given that it is based on earnings that may be affected by onetime events such as restructuring charges and write-offs (Goedhart et al, 2005).
An alternative for this multiple is given by Enterprise Value over EBITA, which is less sensible to changes in capital structures but easily manipulated by changes in the cost of capital.
By making a careful interpretation of each multiple, it is possible to understand that some multiples are more accurate for some firms than others.
Regarding this subject, there is a common agreement among professionals that forward looking multiples perform better relatively to others. In what this subject is concerned, Liu et al (2002), examined the performance of a certain group of multiples when explaining stock prices.
They concluded that the forward earnings measures are the ones that perform better, followed by the historical earnings measures, the cash flow measures and the book value of equity and finally the sales. The previous results are explained by the fact that forecasted earnings yield the lowest pricing errors, given that “future cash flows should reflect future probability better than historical”.4
The reason behind the poor performance of the sales is explained by the fact that they do not reflect profitability until the expenses have been considered. This last set of multiples should be used when earnings are negative. Finally, following the line of
3 Damodaran, Aswath.2012.”Chapter 17 – Fundamental Principles of Relative Valuation”. In Investment
Valuation – Tools and Techniques for Determining the Value of Any Asset, ed. John Wiley & Sons, Inc,
453-468. New Jersey
4 Liu, J., Nissim, D., Thomas, J.,.2001. “Equity Valuation Using Multiples”. Journal of Accounting Research, 40(1):153
11 research of Baker and Ruback (1999), Liu et al (2002), state that computing multiples using the harmonic mean will yield better results when mean or median are used.
In conclusion, even though multiples should be used as a second stage valuation, there is still a final remark that should be made. Despite the fact that several approaches can be followed in order to evaluate a company, such as discounted cash flows and multiples, one cannot expect that the same value will be reached. A stock may be overvalued on a discount cash flow basis but undervalued on a relative basis (Damodaran, 2012). The analyst needs to be sensible to the presented remarks in order to reach an accurate valuation.
2.2. The peer group
As already mentioned, there are several ways to compute a company’s peer group, either more analytical or more theoretical ones.
The approach that will be followed in this study to compute the most accurate peer group is the cluster analysis. This approach will lead to a more coherent computation of the peer group and it is based on the minimization of the distance to the centroids. The first step consists in defining the number of centroids. This will be done further ahead in the study. Then, the variables chosen need to be standardized so as to minimize the distance to the centroid. After that, the new centroid will be the mean values for the observations of each cluster. New clusters will be attributed to the observations and the process will be repeated until the point in which the centroids are stabilized is reached.
2.3. The Discounted Cash Flow method
There are several approaches used to estimate the value of a company. One of the most popular approaches among analysts is the discounted cash flow method. This method has been considered a standard one for the past 20 years (Luehrman, 1997). The main goal of the discounted cash flow method (DCF) is to forecast the expected future cash flows and then discount them to the present ones at their opportunity cost, that is, at a rate that reflects their level of risk.
The theoretical methodology behind the DCF seems easy to follow, however, in practice it may turn out differently (Gilbert, 1990).
The first step that should be taken is to forecast the expected cash flow. This should be done for a period of 5 to 10 years. According to Gilbert (1990), the cash flow that should be used is the so called free cash flow. The Free Cash Flow to the Firm (FCFF)
12 is computed by adding the after tax income, the depreciations and the amortizations, subtracting the capital expenditures and the working capital increases. In short, what is being taken into account is the sum of all the sources of cash, discounting all the expenditures.
Furthermore, it is also relevant to mention that the Discounted Cash Flow Method can also be computed using the Free Cash Flow for the Equity (FCFE), that is, the cash flow that is available to stockholders. It is the cash flow from operations, minus the capital expenditures, minus the payments to debt holders (Pinto et al, 2010). The stream of cash flows yielded should be discounted to the cost of equity.
Nonetheless, these two types of cash flow, despite being calculated differently and at different rates (FCFF is discounted to the weighted average cost and FCFE is discounted to the cost of equity), if the same set of assumptions is made, they should yield the same valuation result. The relation between these two types of cash flow is given as follows:
𝐹𝐶𝐹𝐸 = 𝐹𝐶𝐹𝐹 − 𝐼𝑛𝑡𝑒𝑟𝑒𝑠𝑡 ∗ (1 − 𝑡) + 𝑁𝑒𝑡 𝑑𝑒𝑏𝑡 𝑣𝑎𝑟𝑖𝑎𝑡𝑖𝑜𝑛
According to Pinto et al (2010), these two types of cash flow (FCFF and FCFE) are the preferred type of cash flow since they can be used directly in the valuation of the firm or the equity. For instance, cash flows computed from EBITDA are not accurate, since they do not take into consideration taxes and the capital structure. Moreover, EBITDA based cash flows do not take into account the investment made by the company in working capital, in order to maintain the long-term value of the company.
The question that now arises is related to which cash flow should then be used. According to Pinto et al (2010), the FCFF should be used when, firstly, the company is levered and the FCFE is negative; secondly, the company is levered with a changing capital structure. This is justified by the fact that the cost of equity may be more sensitive to changes in capital structure, than the Weighted Average Cost of Capital (WACC).
Given the aforementioned analysis, in this study, the cash flow used in the DCF valuation method for Rolls-Royce will be the FCFF.
With the distinction made between the set of different cash flows, the issue that now arises is related to the estimation of the future cash flows.
As it was mentioned before, the analyst should estimate five to ten years of expected cash flows. However, as one tries to further predict each future year, the process becomes more difficult and the quality of the predictions decreases. In order to
13 overcome this issue, the future cash flows, after the estimation period, should be computed using the terminal value. This concept will be analyzed later in this study. Therefore, the DCF formula is presented as follows:
𝑉𝑎𝑙𝑢𝑒 = 𝐶𝐹1 (1 + 𝑖)1+ 𝐶𝐹2 (1 + 𝑖)2+ ⋯ + 𝑇𝑉𝑡 (𝑖 + 𝑖)𝑡
Moreover, one should keep in mind that the DCF is fallible. For companies that are subject to the economic cycles, the DCF does not prove to be an appropriate method since the cash flow will be different over time (sometimes they will be up, other times down). Furthermore, DCF does not work properly when valuing financial distressed companies or companies which are going under major changes in their capital structure. Nonetheless, the Adjusted Present Value comes as an alternative to these situations and will be presented onwards.
The issue that is relevant to discuss is how to identify and compute the proper discount rate.
2.4. The discount rate
Professionals have been using the Weighted Average Cost of Capital as the preferred discount rate to be used in the discount cash flows valuation. The reasoning behind this choice is, according to Luehrman (1997), the easiness in calculations that WACC yields. The formula is given as follows:
𝑊𝐴𝐶𝐶 = 𝐷 𝐷 + 𝐸 + 𝑃∗ 𝑟𝑑∗ (1 − 𝑡) + 𝐸 𝐷 + 𝐸 + 𝑃∗ 𝑟𝑒+ 𝑃 𝐷 + 𝐸 + 𝑃∗ 𝑟𝑝
As one can infer, the WACC computation takes into account the capital structure of the company being evaluated and it is able to capture the tax advantage that is derived from corporate borrowing (Luehrman, 1997). The cost of debt and equity are also considered in the computations.
However, despite being one of the most used methods, the WACC is considered an obsolete tool (Luehrman, 1997). According to Luehrman, the WACC is a proper discount rate, only when the company which is being evaluated, presents a simple capital structure. For a more complex capital structure, the WACC should be adjusted to tax shields, issue costs, subsidies, exotic debt securities and changing capital structures. Nonetheless, when professionals use the WACC as a discount rate, they usually assume it to be constant. Booth (2002) indicates two sets of reasoning for the WACC to be constant – either debt financing has no impact on WACC or debt ratio and financial risk
14 is constant through time. These are very limited assumptions and in case either of one fails, WACC should be adjusted. These adjustments “should be made period by period within the project” (Luehrman, 1997)5. Moreover, as mentioned before, WACC tends to be poor when the company presents exotic debt structures. It is the case of high yield debt, floating rate debt or convertible debt. Luehrman (1997) states that in these cases, WACC can easily misevaluate the interest tax shield and the future cash flows. Given the aforementioned discussion on the weakness of the Discounted Cash Flow methodology, the Adjusted Present Value (APV) is introduced in the next section as a feasible solution that is commonly accepted in the literary world.
2.5. The Adjusted Present Value
The Adjusted Present Value (APV) appears as a new alternative to the DCF valuation method. Luehrman states that the APV can yield correct valuations just as the DCF does, but also when the latest does not provide correct valuations. Furthermore, the APV does not require an extensive set of assumptions and is less sensitive to mistakes when compared to the WACC approach (Luehrman, 1997).
The calculation of the APV method seems easy at a first glance, however, in reality, it may not be as simple as it seems. The first step towards a valuation using APV is to compute the set of expected cash flows. In comparison to the WACC methodology, this step is exactly the same for both methods. Nonetheless, from the second step onwards, the valuation using APV becomes slightly different.
The purpose is to estimate the value of the company as if it had no leverage. In order to do so, both cash flows and terminal value will be discounted to the cost of equity. The third step is related to the calculation of the additional funding that comes from side financing effects. The main goal here is to calculate the tax advantages that derive from financing operations. Thus, it is expected that the analyst will be able to identify the interest tax shield that the company is earning and discount it to the present at the cost of debt. In order to do so, it is necessary to know the optimal amount of debt (Booth, 2002).
Furthermore, the bankruptcy costs should also be taken into consideration when making the valuation of a certain company, otherwise the final valuation will not be correct.
5 Luehrman, Timothy A.1997. “What’s it worth? - A General Manager’s Guide to Valuation”. Harvard Business Review, pp.132-142
15 However, computing bankruptcy costs is not a straightforward task and thus it introduces one of the major problems that come with the APV method.
In order to correctly evaluate the company, as mentioned before, the expected bankruptcy costs (EBC) should be computed as follows:
𝐸𝐵𝐶 = 𝑃𝑟𝑜𝑏𝑎𝑏𝑖𝑙𝑖𝑡𝑦 𝑜𝑓 𝑑𝑒𝑓𝑎𝑢𝑙𝑡 ∗ 𝐵𝑎𝑛𝑘𝑟𝑢𝑝𝑡𝑐𝑦 𝐶𝑜𝑠𝑡
In order to calculate the probability of default, there is no standard approach that can be followed, but in this section the bond rating of the firm is going to be presented as a proxy (Damodaran). In order to calculate the rating for the company, Damodaran provides a table that allocates the interest coverage ratio, to the corresponding rating. A larger problem is then related to the computations of the bankruptcy costs. The direct ones (for example lawyer fees) are easy to estimate, however, the indirect costs are more difficult to predict (it is the case of lost sales, profits or the ability and easiness of a company to finance itself in the market).
Concerning this problem, Altman (1984) indicates that even though indirect bankruptcy costs have been identified as relevant, they have never been measured. Altman comes up with an empirical study that defines the indirect costs as unexpected losses. The first method the author uses to compute them is based on a regression method and the second one measures the indirect costs based on the “analyst’s expectations of earnings vs. actual earnings”. Altman concludes that the bankruptcy costs reached “11% to 17% of the firm value three years prior to bankruptcy.”6
In the end, the value of the levered company will be given, by the APV method, as follows:
𝑉𝐿 = 𝑉𝑈+ 𝑃𝑉𝐼𝑇𝑆 − 𝐸𝐵𝐶
Nonetheless, despite the problems in calculating the expected bankruptcy costs, the APV comes as a great advantage, which is related to the fact that by using APV, it is possible for managers to identify where value is being generated (Luehrman, 1997).
2.6. The Dividend Discount Model (DDM)
Another valuation technique that can be used is the Dividend Discount Model. Its main roots rely on the fact that the value per share of a stock is given by the present value of the dividends paid (per share), discounted to the cost of equity. However, the model can be divided into two “sub-models”.
6 Altman, E.I.1984. “A Further Empirical Investigation of the Bankruptcy Costs”. The Journal of Finance, 39(4):1067-1089
16 The first and simpler version of the DDM is the Gordon Model. This model assumes that the value of the stock is given by the dividends per share in the next period, discounted to the cost of equity and, assuming that dividends grow at a constant rate, in perpetuity (Damodaran, 2012). The formula is given as follows.
𝑉𝑎𝑙𝑢𝑒 𝑜𝑓 𝑆𝑡𝑜𝑐𝑘 = 𝐷𝑃𝑆1 𝑟𝑒− 𝑔
Despite the fact that this is a very simple model and that it is very easy to compute, its main limitation is related to the fact that it can only be used for firms that are expected to grow at a stable rate. Notice that, if not used properly, the model can yield misleading results or even unreasonable ones (the case when the growth rate converges to the cost of equity).
The second sub-model of the DDM is the two stage dividend discount model. The first stage of the model is related to the period when the company does not grow at a stable rate and, the second stage reflects the period when the company reaches the steady state and so its growth rate is constant and remains constant, in the long run.
Regarding the limitations of the two stage dividend discount model, Damodaran indicates two that should be worth mentioning. The first one is related to the fact that it is difficult to indicate the length of time during which the company will be growing at non stable rates. The second limitation is related to the fact that the transition between the first stage and the second stage occurs abruptly, meaning that, the transformations in the growth rate happen suddenly and not smoothly as one would expect.
Finally, in relation to the DDM as a whole, Damodaran (2012) also points out a significant criticism. Because the valuation is conducted using dividends, mistakes can be made. For instance, if the company accumulates cash and so pays out a small amount of dividends, by using the DDM the company will be undervalued. In Rolls-Royce case, the Dividend Discount Model is not the most accurate model to apply, since Rolls-Royce pays its dividends in a different form, which will be analyzed onwards in the study.
2.7. The Economic Value Added (EVA)
Damodaran (2013) defines the Economic Value Added (EVA) as a measure of surplus created by an investment. The definition of this measure is presented as follows:
17 According to Damodaran (2013), the capital invested in projects is used to capture the capital invested in assets in place (projects that are already being developed). However, it is stated that there is a disagreement about what this measure should include.
Some defend that the invested capital should be measured by market value. However, Damodaran (2013) states that the market value includes the expected growth (besides assets in place) and so it may not be an accurate measure. Another possible proxy that is indicated is the book value, but this measure may not always translate market value and so some adjustments need to be made.
Regarding the two other components of EVA, the return on capital and the cost of capital, Damodaran also indicates their limitations. The return on capital should measure return on investments already in place and the cost of capital should measure the market value of the cost of capital. Professionals sometimes compute EVA using book values, which, once again, Damodaran states is not the correct approach.
Moreover, one should take into consideration that companies with the highest EVA may not be the best ones to invest in. According to Damodaran (2013), investors should put their money on companies whose EVA has increased more than it was expected, since expectations are the driver of the stock price.
Finally, when using EVA as a valuation tool, it is possible to derive a relationship between Enterprise Value and EVA. Damodaran (2013) states that the value of a given “company can be given by the capital invested in assets in place plus the present value of EVA from assets in place plus the present value of EVA from all future projects.” 7
2.8. The Terminal Value
The terminal value is one of the most important components when developing a Discounted Cash Flow Valuation, since this variable is the one that yields most part of the final value. As one can imagine, it is not possible to estimate cash flows indefinitely and forever so, the terminal value comes as a solution to this situation. Damodaran defines the terminal value as the value of the firm at future timet, that is, when one stops predicting cash flows at timet, the terminal value computes the value of the firm at that point in time.
In order to compute the terminal value of the firm, Damodaran indicates three possible valuation methods.
7 Damodaran, Aswath.2013.”Chapter 10 – Value Enhancement and Cash-Driven Valuation Models”. In
18 The first one indicated is the liquidation method. This method assumes that at some point in time, the company will cease its operations, sell all its assets and the value that will arise is the liquidation value. One way to estimate this liquidation value is to base it on the book value of assets, however, Damodaran indicates that this does not translate the earning power of assets and so it is not a good measure. It should also be noticed that the debt outstanding in the terminal year should be discounted from the liquidation value, in order to get the final value to equity holders. Since there is no evidence that Rolls-Royce will cease its operations in the years to come, this methodology will not be taken into consideration.
The second methodology that is suggested is the multiples approach. As the name indicates, the terminal value will be computed by multiplying the expected revenues or earnings in the terminal year by the respective multiple (for instance, value to sales multiple, price to earnings ratio). However, Damodaran states that this method can be misleading since it will no longer be just a discounted cash flow valuation, but a mix between the first and the relative valuation.
The final approach to compute the terminal value is the stable growth model. Instead of assuming that the firm will slowly cease its activities, it is possible to assume that the firm will continue to invest in new assets and so continue to operate beyond the terminal year. Therefore, in order to compute the terminal value, it is possible to assume that the firm will be in steady state and grow at a constant rate indefinitely. Following Damodaran approach, the terminal value will be computed as follows:
𝑇𝑒𝑟𝑚𝑖𝑛𝑎𝑙 𝑉𝑎𝑙𝑢𝑒𝑡 =
𝐶𝑎𝑠ℎ 𝐹𝑙𝑜𝑤𝑡−1 𝑟 − 𝑔
Furthermore, some attention should be drawn to the limitations of the growth rate. Damodaran states that a company is not able to grow at a higher rate than the economy where it operates. Since Rolls-Royce is an international company, the growth rate in the global economy should be used as a limit to the growth rate that can be used when computing the terminal value. Furthermore, the growth rate should be on the same terms as the valuation, meaning that if the valuation is being made in nominal terms, so should the growth rate be.
2.9. The Present Value of Interest Tax Shield
When considering a firm that is all equity financed, the value that is being created will be divided between the shareholders and the government. However, most firms are also
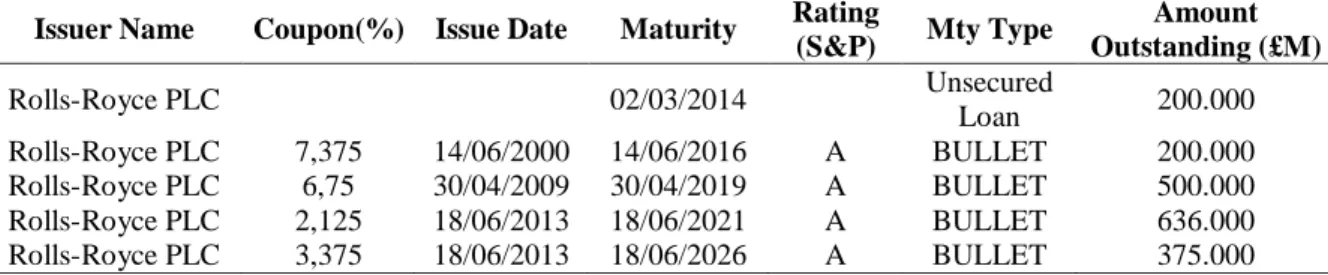
19 debt financed and so it is possible to gain from this type of financing. Since debt is deductible, it is possible for a firm to reduce the share that is being allocated to the government. Therefore, debt holders will be paid first and so shareholders will receive what is left and also the tax savings that come from financing with debt (Graham, 2011).
Nonetheless, one should have into consideration that financing with debt is not always advantageous. Debt financing involves certain costs (for example, distress costs) and so, it is only optimal to finance with debt up to the point where the benefit of the tax shields are higher than the costs that are being generated. Consequently, the firm should decide which level of debt it should take. For instance, according to Graham (2011), firms with greater liquidity (which is the case of Rolls-Royce), should have lower borrowing costs and so be able to hold more debt.
Notice that the Present Value of the Interest Tax Shield (PVITS) is one of the main components of the Adjusted Present Value and can be computed (according to Myers) as follows:
𝑃𝑉𝐼𝑇𝑆𝑡 =𝐷 ∗ 𝑟(1 + 𝑟𝑑∗ 𝑇
𝑑)𝑡
The reasoning behind the formula is that the risk of tax saving is the same as the risk of debt. However, there is not a consensus on the computation of the PVITS. Fernández (2004) states that this is only acceptable if the company does not increase its debt levels. However, if the company expects to increase its debt levels, Fernández (2004) indicates that the right formula to be used is the following:
𝑃𝑉𝐼𝑇𝑆𝑡= 𝐷 ∗ 𝑟𝑢∗ 𝑇 (1 + 𝑟𝑢)𝑡
On the other hand, Damodaran indicates that the present value of interest tax shield is given by 𝐷 ∗ 𝑇 ∗ 𝑟𝑢− 𝐷(𝑟𝑑 − 𝑟𝑓) ∗ (1 − 𝑇), discounted to the cost of equity. Again, this is a formula that Fernández (2006) considers to be wrong, since the formula above takes into account that the return of debt is uncorrelated with the return of assets, which Fernández believes is difficult to justify.
2.10. The Market Risk Premium
The market risk premium (MRP) is a vital component that is used in order to estimate both the cost of capital and the cost of equity. Therefore, it is important to understand how it should be computed.
20 The market risk premium is defined as the difference between the actual returns on stocks and the actual returns of the default free government bond.
As it is stated by Damodaran, one of the most popular methods to compute the forward looking market risk premium is by estimating the historical premium. However, different market premiums can be computed as there is no consensus, for example, regarding which average to use. Damodaran indicates that some defend the usage of the arithmetic average, since it yields the best unbiased premium, given that annual returns should be uncorrelated. However, others defend the usage of the geometric average, since empirical studies reveal that returns are negatively correlated and so, “the arithmetic average is likely to over state the premium.”8
Furthermore, more drawbacks have been attributed to the historical approach to compute the risk premium. The first is related to the fact that for markets with short and volatile industries, the historical market risk premium computed may not be accurate or reliable. Damodaran states that this is true not only for emerging markets, but also for the European ones.
2.11. Emerging Markets
There is still little agreement on how to conduct valuations in emerging markets. These markets are subject to extra levels of risk that should be taken into consideration, such as high levels of inflation, macroeconomic volatility, political changes and corruption. The question that now arises is on how to incorporate the extra amount of risk. According to James and Koller (2000) there are two ways that can be used to take into account the extra risk. The first one is to include the risk in the cash flow and the second one is to incorporate the risk premium in the cost of capital. In what the last method is concerned, according to Goedhart and Haden (2003), adding the risk premium to the cost of capital can lead to a misleading valuation since cash flows already include the probability of distress and so the risk is being accounted for twice.
Therefore, James and Koller (2000) defend an approach in which the extra risk that emerging markets carry should be accounted using a cash flow probability weighted scenario, which they believe, “provides both a more solid analytical foundation and a more robust understanding of how value might (or might not) be created”.9
8 Damodaran, A., 2012,”Equity Risk Premiums”, Stern School of Business
21 Nonetheless, despite the extra levels of risk that emerging markets present, Goedhart and Haden (2003) argue that even though the risk is high, if portfolios are well diversified, for instance, across countries, those portfolios can be stable. Since this is not a concern in the Rolls-Royce structure, no further analysis will be made.
2.12. The risk free rate
The risk free rate arises as one of the building blocks used to compute both the cost of capital and the cost of equity. As one may think, the risk free rate is not easy to calculate and so there are several variables that should be considered before using a risk free rate that, in the end, may not be as risk free as one might think. For example, Fernández (2004) indicates that using the historical average of the risk free rate as the actual risk free rate is a serious mistake that should be avoided. He explains that the risk free rate should be the one that is computed now (when the cost of equity is calculated) when buying government bonds. Another mistake that can be made is to use the risk free rate as the short term government bond.
In order to correctly estimate the risk free rate to be used in the valuation, there are certain aspects that should be considered.
According to Damodaran (2008), the currency can be an important variable. For instance, if one accepts that the ten year bond rate is the risk free one, then a final different value can be reached, depending on the currency that is being used. Notice that when calculating the risk free rate, it is of course necessary to use a currency that is considered default free. In the case of the euro, Damodaran states that in order to get the risk free rate, the lowest of the 10-year government euro bond should be used, usually the German Bund. In the case of Rolls-Royce, the pound should be the currency used and the UK sovereign rating is considered by Standard and Poor’s to be AAA.
Moreover, one should remember that the currency is affected by the inflation rate and so, currencies that are subject to high levels of inflation will yield higher risk free rates than low inflation currencies (Damodaran, 2008).
Furthermore, one detail that should be taken into consideration is that the risk free rate should be computed according to the estimated cash flows, that is, the expected cash flows are computed in nominal terms, and so should be the risk free rate. The same happens if cash flows are presented in real terms. Consistency is needed in order to get the most accurate risk free rate.
22 2.13. The levered beta
The beta is a measure of market risk, that is, for a given asset, the beta measures a stock’s contribution to the variance of the market portfolio.
However, computing beta may not be very straight forward. One way possible to compute the beta of a company, according to Damodaran, is by regressing the returns of the asset on the returns of the market portfolio, in this case, it is the index that will be used as a proxy for the market portfolio. It will then be possible to establish the relationship between the assets returns and the market portfolio:
𝑟𝑖 = ∝ + 𝛽 𝑟𝑚
However, there are some problems related to this approach.
The first one involves the definition of the market index that will be used as a proxy for the market portfolio. Damodaran indicates that the market weighted indexes (each stock is weighted according to its market capitalization) should yield better results. The second issue is related to the time period that should be used to regress beta – a larger time frame allows for a larger number of observations but the firm’s characteristics may have changed over time.
Finally, another concern is related to the return intervals that should be used. Once again, smaller returns may yield a higher number of observations but this can create a bias. According to Damodaran, for firms listed for more than 3 years (which is the case of Rolls-Royce), monthly data should be enough to estimate the beta. Moreover, because there is empirical evidence that returns are negatively correlated, weekly or monthly returns may be better than the daily ones.
In order to estimate the cost of equity, one of the most well known approaches is the Capital Asset Pricing Model that gives the following relation:
𝑟𝑒 = 𝑟𝑓+ 𝛽𝐿∗ (𝐸(𝑟𝑚)− 𝑟𝑓) + 𝑒
However, once again there is not a common agreement on how to compute the levered beta. According to Fernández, if the company is expected to increase its level of debt then 𝛽𝐿 = 𝛽𝑢 + (𝛽𝑢 − 𝛽𝑑)𝐷(1 − 𝑡)/𝐸. Fernández also draws attention to the fact that computing betas using historical industry beta or the average of betas for similar companies may not be the most correct decision.
23 2.14. Option Theory
APV has already been introduced and it is important to refer again that it does not perform well on projects that are option based (Luehrman, 1997). For companies whose main activity is related to the exploitation of commodities, options are considered to be the most accurate method for valuation.
The option traduces the “right to buy or sell something at a specific time in the future” (Luehrman, 1997)10, that is, at a specific time in the future, a specific quantity of the underlying asset will be sold or bought at a specific price, previously determined. In order to proceed with the valuation using options, the two most popular methods that can be used are the Binomial Model and the Black-Scholes Model. However, Damodaran states that the last one can only be used if the distribution is assumed to be normal and so “prices are continuous and there are no jumps in asset prices.”
Moreover, there are some issues that need to be taken into consideration when using the option theory. Fernández (2002) first outlines that the basics behind the option theory is that it is possible to create and replicate any portfolio that will yield the same return as the option that is being valued and so, it is possible to avoid arbitrage. Furthermore, he indicates two concerns regarding the applicability of the Black Scholes Model.
The first one is related to the fact that the expected cash flow models are discounted to the risk free rate. Fernández indicates that this is done implicitly by the Black-Scholes formula but it is not correct. Even though the option will be exercised (or not) “when a future uncertainty is settled”, this does not mean that the project is risk free.
Another mistake that is stated by Fernández (2002) is that the value of options increases when the interest rate increases. He explains that the negative effect caused by the increase in interest rates on the present value of cash flows is higher than the positive effect that arises from the reduction of the present value of the exercise price.
2.15. Research and Development Expenses
According to Damodaran, company expenses can be divided into three types – operating expenses (that occur in the current period), finance expenses (the case of interest expenses) and also capital expenses (those that will bring about future benefits, for instance, building a plant). One should notice that both operating and capital
10 Luehrman, Timothy A.1997. “What’s it worth? - A General Manager’s Guide to Valuation”. Harvard Business Review, pp.132-142
24 expenses are tax deductible while capital expenses should be accounted over the useful life of the investment as depreciation or amortization.
Traditionally, R&D is accounted as operating expenses, however, Damodaran proposes a new approach to this situation. He draws attention to the fact that accounting R&D expenses as operating ones, will make them tax deductible and so it will reduce the value of the net income. Given that capital expenditures will create long term benefit and so do R&D expenses, Damodaran proposes that they should be reclassified and considered capital expenses.
Nonetheless, since it is stated in the 2012 Rolls-Royce’s financial report that the company’s goal regarding R&D expenses is that they will reach 4% to 5% of Rolls-Royce’s underlying revenues, the approach considered by Damodaran of using R&D as capital expenses will not be addressed.
3. Industry Overview
Rolls-Royce PLC is established in the Aerospace and Defense Sector and also operates in the marine and energy sector, even though the last two contribute less to the overall revenues of the company.
Regarding the civil sector, in the product segment, RR produces large, small and helicopter aircraft engines. In the same sector, but in the services segment, RR follows the maintenance and management of its engines through their life cycle. Furthermore, it also provides customer training regarding its engines.
In the defense sector, RR produces engines for combat jets, helicopters, transporters, trainers and tactical aircraft. In the services segment, they also provide training and help maintaining the engines.
In the marine sector, RR produces engines, propulsors, deck machinery, bearings and seals and power electric systems. Moreover, it offers ship designs comprising offshore vessels (platform supply vessels, anchor handling/tug/supply vessels), coastguard vessels, fishing vessels, merchant vessels and specialized vessels, such as, coastal patrol, drilling storage and production. In the services segment, they offer customer training and work on upgrade designs so that customers can optimize the performance of their equipment.
Finally, in the energy sector, RR provides gas engines, gas turbine engines, gas compression, diesel engines and fuel cells (which generate electricity from continuously supplied streams of fuel and oxidant). Furthermore, in the services sector they offer
25 technical support and customer training. In the nuclear sector RR is a leader in nuclear submarine systems and it provides plans that support the building of nuclear power stations.
The analysis of the market outlook will now be introduced.
According to KPMG’s 2013 Global Aerospace and Defense Outlook, the sector has gone through major changes.
The defense sector is facing some difficulties as governments are now cutting down on budgets in this sector. According to Deloitte’s 2013 Global aerospace and defense industry outlook, the commercial aircraft sector is expected to reach new levels of revenue in 2013.
Globally, according to KPMG’s report, the Aerospace and Defense sector companies are expected to grow only 2% in the next two years as can be observed in graph 1.
Graph 1 - Source: KPKG 2013 Global and Aerospace and Defense outlook.
Notice that even though this is the market tendency, Rolls-Royce is expected to continue growing and thus outperforming the market.
The two sectors, that represent more than 50% of Rolls-Royce’s revenues, will now be analyzed separately.
3.1. The aerospace sector
As already mentioned, the aerospace sector is expected to continue to expand and thus beneficiating Rolls-Royce’s core business.
26 In 2012, the global aerospace sector registered an increase in revenue of about 5,9%. This growth is, according to Deloitte’s report, verified by increases in production by both Boeing and Airbus.
Furthermore, the continuous growth in passenger travelling demand in Asia and the Middle East is also contributing to the expansion of this sector.
Moreover, it is also expected that, in the next twenty years, between 27.350 and 34.000 commercial aircraft will be produced.
In parallel, RR revenue growth for this year was of about 8,10% and thus beating the market.
Graph 2 - Source: Deloitte 2013 Global Aerospace and Defense Outlook.
Graph 2, presented above, translates the historical and the forecast for 2013 of production and orders of large commercial aircraft from 1981 to 2013. The seven year moving average indicates the expectation of growth in this sector, reaching a value of almost 1000 aircraft by 2013.
The continuous growth expected in this sector translates the need for RR to invest in this segment and so to keep up with the good results it has been achieving so far. The opportunities in this sector continue to be advantageous and give room for Rolls-Royce to grow and to continue to invest in technological innovation.
3.2. The defense sector
As mentioned above, according to Deloitte’s report the defense sector is expected to face some continued declines in revenue for the third consecutive year.
One of the main reasons to justify this outlook is related to the fact that governments are currently cutting down on defense budgets. This is the case of the USA, one of the main
27 clients of RR. The USA estimates a reduction in their defense budget of about US$487 billion over the next ten years as a result of the Budget Control Act of 2011.
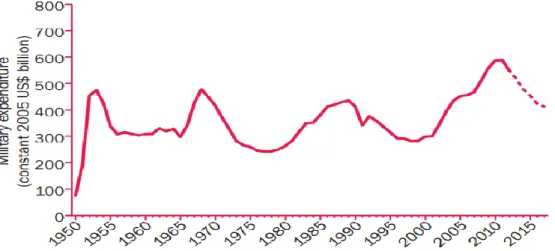
In graph 3 it is possible to observe the US military spending from 1950 until 2017 (at 2005 constant prices). The graph translates, as already mentioned, the goal of reducing military expenditures for the next years.
Graph 3 - Source: SIPRI Yearbook 2013, Armaments, Disarmament and International Security.
Along with the USA cost reduction policy, these military cuts are also being faced in the UK and the rest of Europe.
On the other hand, the aggregate expenditure in the defense sector in countries like China, Russia, India, Saudi Arabia, the United Arab Emirates and Brazil has been increasing.
In table 1 it is possible to observe the figures for the world military spending in 2012.
28 As it can be concluded, regarding the USA, the spending has decreased 5,5% in real terms, translating the policy of cost reduction adopted by this county. In Western and Central Europe, these costs have also been felt, with a reduction of 1,6%.
In conclusion, this macroeconomic outlook translates the ongoing difficulties that this sector has been facing and is expected to continue facing in the future.
This scenario may reflect some difficulties for Rolls-Royce on what this sector is concerned.
In conclusion, according to Deloitte’s 2013 Aerospace and Defense outlook, despite the fact that the defense sector is facing some drawbacks, these are compensated by the increase in revenue that comes from the commercial side of the business. Even though some countries and companies are engaging in cost saving, the aerospace sector allows for further business opportunities.
The market share of the aerospace sector has been increasing within this segment. If in the past, defense represented two thirds of the Aerospace and Defense sector, the reverse process is now being registered. Civil aerospace sector continues to improve and so it currently represents more than 45% of the total revenues in the sector, in 2012.
3.3. The marine sector
This sector represents almost 20% of RR business and the company is established as a top competitor.
RR has several important customers in this sector such as the Royal Navy, the US and it is now developing business in countries like China.
According to the UK Industries Alliance, growth opportunities, namely in renewable energy, global trade will drive merchant ship market and also the increase in demand from coastal economies for naval platform and equipment will stimulate this market. Further, it is also indicated that the increase in global GDP will lead to greater commercial shipping.
The table below (2) introduces the markets that are considered to be the best providing opportunities regarding the naval, commercial, leisure and offshore renewable sectors. H stands for high importance and M for medium.
29
Table 2 – Source: UK Marine Industries Alliance – A strategy for growth for the UK Marine Industries.
This table draws attention to the increase in importance of the BRIC countries.
Moreover, regarding the UK, there are significant opportunities related to offshore renewable energies. These opportunities are supported by the government and its leadership in licensing offshore wind, wave and tidal energy generation and research leadership. There is also expected growth in new middle classes in developing countries which creates new opportunities for the UK. In this country RR is “playing at home” and so has a competitive advantage in exploiting all these opportunities and being able to attract all the main contracts.
Regarding the U.S., The Congressional Budget Office expects a decrease in inventory in all sectors, for instance, missile submarines, ballistic submarines and warfare ships. The graph below illustrates the navy’s estimates for new ship construction from 2014 to 2023. As it is possible to observe, there is not a constant trend. Nonetheless, this still indicates that RR can take advantage of the opportunities in this sector.
Graph 4 – Source: Congressional Budget Office based on data from the Department of the Navy.
Finally, as already mentioned, the marine market is also growing in developing countries and eastern powers. RR has recently celebrated a contract to design and
30 integrate equipment packages for two platform supply vessels in China and has also celebrated a contract to supply thrusters and deck machinery for two semi-submersible drilling rigs, in Korea.
4.
Rolls-Royce PLC
4.1. Company Presentation
Trusted to deliver excellence
Rolls-Royce PLC is one of the most popular names and brands in the entire world and in the aerospace and defense sector, where it operates. The primacy for technological advance makes Rolls-Royce one of the pioneers and top competitors in the world. Rolls-Royce was first created by Henry Royce and Charles Rolls, in 1884. The business took off with the production of cars that were known by their standard quality, in London.
With the outburst of the First World War and to respond to the military needs of the country, Rolls-Royce produced its first aero engine.
This allowed RR to grow as a company, but it was with the Second World War that RR made the transition from a small business company to a major competitor in the aero sector.
Later in the business process (2003), BMW took over the responsibility of Rolls-Royce’s cars.
Rolls-Royce is today a symbol of integrity and innovation. Rolls-Royce’s stocks are currently traded at the FTSE 100 and its first public offering occurred in 1993 with the issue of 242,74 million shares with a value of 1,30£. Two years later, a follow-on offering was made, with an issue of 227,30 million shares at 1,54£.
Nowadays, RR operates in four different sectors that differently contribute to the business.
First and foremost, RR operates in the civil aero sector. This represented in 2012 more than 50% of Rolls-Royce revenues. In this sector, RR is established as a market leader, with its engines being classified as the “launch engine for the airframe it was created”. Also, RR is considered to be the market leader that “powers the fastest, the longest-range, and the largest business jets”.
31 0 1000 2000 3000 4000 5000 6000 2004 2005 2006 2007 2008 2009 2010 2011 2012 Rev en u e (mi lli o n £ )
Civil Aerospace (Engines) Defence Aerospace (Engines) Marine (Propulsion Systems & Services) Energy (Power Systems)
In the defense sector, RR comes as the second largest provider of defense aero-engine products for several military sectors, for example, transport, combat, patrol and helicopters.
The third largest sector, where RR operates is the marine one. Again, Rolls-Royce comes as the market leader. Within this sector, the primary focus is directed to power and propulsion systems.
Last but not least, RR operates in the energy sector. The company powers oil platforms and also transports oil and gas through the pipelines they create. Furthermore, since 2011, RR has been developing its business in the nuclear sector.
Graph 5 below shows the behavior of revenues, allocated to each of the four sectors, since 2004 and gives an understanding of the position of each sector within the company. It is also shown the percentage of each sector, within the total revenues for the year of 2012.
Graph 5 – Source: Rolls-Royce’s 2012 Financial Report
Looking into the future, the group will keep up with its investment behavior and expects a demand of US$3 trillion for the next 20 years. One should notice that the size of these sectors is related to the world GDP growth.
In conclusion, Rolls-Royce intends to keep its promise to deliver excellence and continue to be seen as a state of the art company in the fields of technological innovation.
4.2. Looking ahead into the future of Rolls-Royce
In the last decade, RR has been engaged in a successful strategy of continuous growth and profit. During this period, RR has more than doubled its revenues and profit has
32 increased more than five times. The prospects for the future are promising and RR expects to continue with these good results.
For the past ten years, RR was awarded with Britain’s most admired company in the field of engineering, for the aerospace and defense sector and, 2013 was no exception. It is expected that RR’s order book will continue to increase and so the company is able to explore cash flow margins.
Moreover, the investor’s relations director underlines the importance of further cost reduction in order to improve profit margins. Nonetheless, no specific goals were established.
Furthermore, the positive outlook already described for the airline and marine sector, as well as, the positive outlook for the energy sector, indicates that RR has several opportunities that it can explore, in the several business areas. According to the investor’s relations director, the nuclear sector is the business for the future.
In the current year, RR has celebrated a large number of contracts that reinforce its position in the global market as a top leader. For instance, just at the end of 2013, RR is going to collaborate with Turkey to support its plans for a civil nuclear power station. Furthermore, it has celebrated a $57,1 million dollar contract to support the US Marine Corps and the Air Force aircraft engines. Further contracts were celebrated in China, Kuwait, Malasia, Brazil, Dubai and Qatar. This represents only a short list. Further contracts will be mentioned in this study, when necessary. In order to answer the demands in the record order book by RR, a new plant was built in Singapore, which allows RR to double its production capacity.
The industry where RR operates is highly technological and so RR assures that its competitive advantage comes from the company’s highly qualified headcount.
In conclusion, in order to continue strong, a final goal from the investor relations is set – the company intends to keep its investment grade stable so that it can continue to have access to the global debt market.
4.3. Rolls-Royce Dividend Policy and UK Taxation Process
For the purpose of the dividend payment policy, Rolls-Royce does not adopt the standard policy of paying cash dividends to its shareholders, as many listed companies do. Instead, Rolls-Royce prefers to issue redeemable C shares as an alternative to paying a cash dividend. Therefore, according to the Rolls-Royce’s 2012 Annual Report, the C shares of a given year are issued in the following year.
33 Nonetheless, as already mentioned, these C shares are redeemable and so the shareholder is presented with three options.
The first available option is to redeem all C shares for cash. In order to do so, the shareholder has to complete a payment instruction form, expressing his/her wish to do so.
The second available option to the shareholder is to redeem all C shares and use them to purchase additional ordinary shares. This comes with an advantage to the shareholder, since there is no minimum charge and so this operation becomes cheaper when compared to the one performed by the broker.
Finally, shareholders have the option of keeping all C shares. One should notice that these C shares are not listed in the London Stock Exchange and so it is not possible to sell them in the market.
Moreover, according to the Rolls-Royce’s 2012 shareholder’s guide, each C share has a nominal and redemption price of 0.1 pence, meaning that for instance, a thousand C shares are worth one pound.
Furthermore, C shares will yield a small dividend to Rolls-Royce’s shareholders. This dividend is paid twice a year and it is fixed at 75% of Libor.
Rolls-Royce has a fixed position regarding its dividend payment policy and it is not expected that it will change in the near future. According to Rolls-Royce, this policy allows them to make payments to its shareholders without increasing its Advance Corporation Taxation (ACT) surplus.
The ACT was a former tax that was imposed on corporations when they were about to distribute dividends. This tax policy was abolished in 1999. At the time, companies were taxed at a rate of 33% on their profits. The tax was then paid in two installments. The first referred to the ACT and was paid after the company had paid its dividends and it was related to the amount that was distributed, the second installment was paid nine months after the end of the company’s accounting period.
In order to understand Rolls-Royce’s choice not to distribute dividends, there is a need to understand that the company has a surplus ACT. According Freeman et al (1993), a surplus occurred when a company pays out a dividend that exceeds its taxable profits, or it has not paid enough UK tax on its profits to be able to offset the ACT11. According
to Bond et al (1996), a company could end up with a surplus if it paid dividends out of