Chemistry Studies on
Biological Systems
Anna Bondarenko
Mestrado em Química
Departmento de Química e Bioquímica 2014
Orientadora
Maria João Ramos, Professora Catedrática, Faculdade da Ciências, Universidade do Porto
Coorientadores
Pedro A. Fernandes, Professor Associado, Faculdade da Ciências, Universidade do Porto
Natércia F.Brás, Investigadora, Faculdade da Ciências, Universidade do Porto
Jasper Knoester, Professor, Faculty of Mathematics and Natural Sciences, University of Groningen
Thomas la Cour Jansen, Assistant Professor, Faculty of Mathematics and Natural Sciences, University of Groningen
O Presidente do Júri,
ACKNOWLEDGEMENTS
This research project would not have been possible without the support of many people. I am gratefully thankful to all the people who was abundantly helpful and offered invaluable assistance, support and guidance.
First and foremost, I would like to give special thanks to the Erasmus Mundus programme of the European Union, with the support of which is done the project. I am thankful for the opportunity to receive the international European master degree in Theoretical Chemistry and Computational Modelling, to have the experience of doing the project in two countries.
I wish to express my acknowledges for ability to carry this project at the research group of Theoretical Chemistry, Department of Chemistry, Faculty of Science, University of Porto, Porto. In particular, my deepest gratitude is to my supervisors Maria João Ramos, Pedro Alexandrino Fernandes and Natércia Bras.
I gratefully acknowledge to another research group, for opportunity to carry the part of the research project – the group of Theory of Condensed Matter of Zernike Institute for Advanced Materials, Faculty of Mathematics and Natural Sciences, University of Groningen, Groningen. I am highly thankful to the coordinators of the project – Thomas la Cour Jansen and Jasper Knoester.
I would like to give thanks to the experimental groups for providing the experimental data. Marcel Jaspars are deeply acknowledged for providing X-ray structures of enzymes. Andrei Tokmakoff and Carlos Baiz are gratefully acknowledged for providing the experimental FTIR and two-dimensional infrared spectra data for proteins.
Finally, I wish to express my heartfelt thanks to my beloved family, supporting and encouraging me through the duration of my studies, my friends for their help and wishes for the successful completion of this project.
ABSTRACT
The current research project was developed in two lines within the main framework of the application of computational chemistry approaches on studies of biological systems. The first line, carried in the group of Theoretical Chemistry of the University of Porto, is related to the area of drug design and includes two parts of the project. The first part aimed at providing insights for the design of novel drugs for treatment of hypertension. Here, the model of the target angiotensin II receptor type 1 (AT1) receptor, which is involved in the renin-angiotensin-aldosterone-system (RAAS) cascade, was modelled by homology modelling approach. The binding poses of the natural substrate Angiotensin II, peptide hormone that causes vasoconstriction, to the created model of the target were identified by molecular docking study. The molecular docking protocol was also employed to dock several AT1 antagonists to the modelled target. The second part aimed to perform preparation of the enzyme macrocyclase PatG (PatGmac) system for the study of its catalytic mechanism. The system was created on the base of X-ray structure and fully optimised by the hybrid QM/MM ONIOM method. In future, it would be useful for production of potential anticancer molecules "patellamides”, linear peptides cyclised by this enzyme.
The second line of the project, carried in the group of Theory of Condensed Matter of the University of Groningen, is related to the study of protein conformational changes by means of two-dimensional infrared spectroscopy (2DIR). Theoretical methods capable of detailed simulation of two-dimensional spectra of full proteins from molecular dynamics trajectories have been applied for the proteins to test the method on big biological systems.
Key words: Drug Design, hypertension, RAAS, AT1 receptor, angiotensin II,
AT1 antagonists, homology modelling, molecular docking, PatGmac, patellamides, ONIOM QM/MM, 2DIR spectroscopy, Molecular Dynamics
RESUMO
O presente projeto de investigação foi desenvolvido em duas linhas, tendo por base abordagens de química teórica e computacional em estudos de sistemas biológicos. A primeira componente, realizada no grupo de Química Teórica da Universidade do Porto, está relacionada com um estudo de desenho de fármacos e divide-se em duas partes deste projeto. Na primeira parte pretendeu-se a aquisição de conhecimentos para a concepção de novos fármacos para o tratamento da hipertensão. Inicialmente modelou-se o receptor transmembranar da angiotensina II, subtipo 1 (AT1), o qual está envolvido na cascata sistema-renina-angiotensina-aldosterona (RAAS), utilizando o método de modelação por homologia. Utilizou-se o método de atracagem molecular para se identificaram as diferentes conformações de ligação do substrato natural angiotensina II, hormona peptídica que provoca vasoconstrição, ao modelo do receptor AT1 criado por modelação por homologia. O mesmo protocolo de atracagem molecular foi posteriormente utilizado para atracar vários antagonistas do receptor AT1 (comercialmente utilizados) ao alvo modelado.
Na segunda parte realizou-se a preparação do sistema da enzima macrociclase PatG (PatGmac) para o futuro estudo do seu mecanismo catalítico. O sistema foi criado a partir da estrutura de cristalografia de raio-X, e de seguida foi optimizado pelo método híbrido QM/MM ONIOM. Este procedimento é necessário para o estudo do mecanismo catalítico, o qual será muito útil para a produção de moléculas "patelamidas", péptidos cíclicos produzidos por esta enzima, que actuem como potenciais fármacos anti-cancerígenos.
A segunda linha do projeto, realizado no grupo de Teoria da Matéria Condensada da Universidade de Groningen, está relacionada com o estudo de mudanças conformacionais de proteínas por meio de espectroscopia de infravermelho bidimensional (2DIR). Foram aplicados métodos teóricos capazes de simular detalhadamente os espectros bidimensionais de proteínas completas através trajectórias de dinâmica molecular. O método foi testado em proteínas pertencentes a grandes sistemas biológicos.
Palavras-chave: Desenho de fármacos, Hipertensão, RAAS, Receptor AT1,
Angiotensina II, Antagonistas do AT1, Modelação por Homologia, Atracagem Molecular, PatGmac, Patelamidas, ONIOM QM/MM, 2DIR Espectroscopia, Dinâmica Molecular
TABLE OF CONTENTS
Acknowledgements……….………..i Abstract……….……….ii Resumo……….………iii Table of Contents……….………...iv List of Tables………vi List of Figures………..………vii Abbreviations………ixI. INSIGHTS FOR THE DESIGN OF NOVEL DRUGS FOR HYPERTENSION….. 1
1. Introduction……….………...……… 1
2. Renin-angiotensin-aldosterone-system (RAAS) in hypertension…….…..……….. 2
2.1 GPCR receptors………...…………...……….. 2
2.2. AT1 receptor………..………...…… 3
2.3. Angiotensin II receptor blockers (ARBs)…….………. 4
3. Modelling the AT1 receptor……….……….... 6
3.1. Homology modelling methodology……….…...… 6
3.2. Homology modelling of the AT1 receptor……….……….. 11
4. Molecular Docking……….. 19
4.1. Protein-Ligand Docking methodology……….… 19
4.2. Docking of the angiotensin II to the model of the AT1 receptor……….…… 21
4.3. Docking of the known inhibitors to the model of the AT1 receptor……..….. 25
5. Prospective for the future………..…… 31
II. THE MODELLING OF THE ENZYME PATGMAC SYSTEM……….. 33
1. Introduction………..……… 33
2. Biosynthesis of patellamides……… 34
3. Proposed mechanism for macrocyclization……… 35
4. Modelling of the system……….……… 35
5. QM/MM optimisation……….………. 37
6. Prospective for the future………..……… 38
III.
IDENTIFYING
PROTEIN
STRUCTURE
WITH
INFRARED
SPECTROSCOPY………... 39
1. Introduction……….……… 39
3. Procedure……… 42
4. Computational details……… 45
5. Results, analyses and discussions……….……… 47
5.1 Obtained linear spectra……….……… 47
5.2. Obtained 2DIR spectra……….……… 50
6. Conclusions and outlook………...……… 53
References……….……… 55
LIST OF TABLES
Table 1 – Structures of AT1 receptor nonpeptidic antagonists……… 6
Table 2 – Available target templates………..……… 14
Table 3 – The percentage of the sequence identity for each template protein…..….…… 14
Table 4 – The summary of the successfully produced models………..……… 17
Table 5 – Solutions of the docking of Ang-II to the model of the AT1 receptor, with corresponding energy scores, and dissociation constants………….……… 23
Table 6 – Ranking of the inhibitors by their Gibbs energy values.……… 31
Table 7 – Shift of the peak positions………..……… 48
Table 8 – Frequency site distribution of the protein………..………..……… 49
Table 9 – RMSD analysis between theoretical and experimental spectra…..……… 49
LIST OF FIGURES
Fig. 1 – Schematic representation of the class A GPCR topology. This picture shows an “activated” GPCR embedded in a lipid bilayer. The C-terminus of the receptor is associating with the G-protein trimer……… 3 Fig. 2 – A diagram illustrating the RAAS cascade, beginning with angiotensinogen and ending with the binding of angiotensin-II to the AT1 receptor……….……….………… 3 Fig. 3 – Bovine rhodopsin receptor: a) 1F88, b) 1HZX, c) 1GZM, d) 1L9H, e) 1U19….… 12 Fig. 4 – Human kappa opioid receptor: a) 4DJH; human β2-adrenergic receptor: b) 2RH1,
c) 3NY9; CXCR4 receptor: d) 3ODU, e) 3OE0, f) 3OE9………...….………… 12 Fig. 5. Multiple sequence alignment between the target receptor AT1 and the template receptors, performed in CLUSTAL 2.1 [55].……….………… 15 Fig. 6. – Ramachandran plot: a) model 1; b) model 2.……… 17 Fig. 7 – Force-field minimization in AMBER: a) AT1 receptor in the water box; b) modelled AT1 receptor with the conserved disulphide bond Cys101-Cys180 (magenta and yellow)……….… 18 Fig. 8 – Representation of the Protein-Ligand Molecular Docking…………..………. 20 Fig. 9 – Representation with the box of the docking area of the AT1 receptor (blue), and docked Ang-II (yellow)……….. 22 Fig. 10 – Representation of the predicted binding site of Ang-II (licorice) in the AT1 receptor (NewCartoon magenta). Residues Lys199, Arg167, and His256 of AT1 receptor are represented in CPK. The distance unit is specified in angstroms……….………. 24 Fig. 11 – Representation of the Phe8 of Ang-II (yellow) in the hydrophobic pocket formed by residues Ala104, Val108, Phe77, Leu81, Trp253, Leu112, Tyr292, Phe182, Trp84, Met284, Ile288 of the AT1 receptor………..………. 24 Fig. 12 – Representation of the interaction between Tyr4 and Ile5 of Ang-II and Asp281 of the AT1 receptor, and the interaction between Arg2 of Ang-II and Asp263 of the AT1 receptor. The distance unit is specified in angstroms……….……… 25 Fig. 13 – Representation of the predicted binding site of losartan in the AT1 receptor. The distance unit is specified in angstroms……….. 26 Fig. 14 – Representation of predicted binding site of candesartan in the AT1 receptor. The distance unit is specified in angstroms……….………. 26 Fig. 15 – Representation of predicted binding site of olmesartan in the AT1 receptor. The distance unit is specified in angstroms……….. 27
Fig. 16 – Representation of predicted binding site of eprosartan in the AT1 receptor. The distance unit is specified in angstroms……….…. 28 Fig. 17 – Representation of predicted binding site of irbesartan in the AT1 receptor. The distance unit is specified in angstroms……….. 28 Fig. 18 – Representation of predicted binding site of telmisartan in the AT1 receptor. The distance unit is specified in angstroms……….…. 29 Fig. 19 – Representation of predicted binding site of valsartan in the AT1 receptor. The distance unit is specified in angstroms……….…. 29 Fig. 20 – Representation of predicted binding site of azilsartan in the AT1 receptor. The distance unit is specified in angstroms……….…. 30 Fig. 21 – Structures of the known patellamides isolated from L. patella and their peptide sequences [83]……….. 33 Fig. 22 – Scheme of suggested biosynthetic pathway for patellamide [81]……….... 34 Fig. 23 – Proposed mechanism for macrocyclization [82]……….……. 35 Fig. 24 – The representation of: a) the X-ray structure of the substrate-enzyme complex; b) the corrected structure of the substrate-enzyme complex……….…… 36 Fig. 25 – ONIOM model of the system……….. 37 Fig. 26 – The representation of substrate in the active site of the enzyme after the optimisation………...……. 38 Fig. 27 – Pulse sequences for FTIR and 2D IR spectroscopy [100]………..…….. 40 Fig. 28 – Schematic representation of the excitonic Hamiltonian matrix and energy levels for a 2-oscillator system [100]………...…….. 43 Fig. 29 – A diagram for the procedure of simulating linear absorption and 2D IR spectra………..……….. 44 Fig. 30 – The structures (in ribbon representation) of the four proteins under the study……… 45 Fig. 31 – Experimental FTIR spectra of the proteins………..…. 47 Fig. 32 – Predicted FTIR spectra for the proteins simulated using Jansen, Skinner and Tokmakoff maps. Simulated spectra are shifted to the peak position of experimental spectra……… 48 Fig. 33 – Diagram of overlapping between simulated FTIR spectra and experimental ones for each protein. Upper limit is the highest overlapping between experimental spectra of proteins. Lower limit is the lowest overlapping between experimental spectra of proteins………...……… 50 Fig. 34 – Experimental 2DIR spectra for the proteins………...……….. 51 Fig. 35 – Experimental and simulated spectra for the proteins……….… 52 Fig. 36 – Diagram of overlapping between simulated and experimental 2D IR spectra… 53
ABBREVIATIONS
2DIR Two-dimensional infrared spectroscopy
7TM seven-transmembrane domain
ACE angiotensin-converting enzyme
Ang-I angiotensin I
Ang-II angiotensin II
ARB Angiotensin II receptor blocker
AT1 angiotensin II receptor type 1
bRh bovine Rhodopsin
Con A Concanavalin A
DOPE Discrete Optimized Protein Energy
E-value Expected value
FTIR Fourier Transformed Infraredspectroscopy GA Genetic Algorithm
GLDP glycin dipeptide
GPCR G protein-coupled receptor
HM homology modelling
LGA Lamarckian Genetic Algorithm
Lys Lysozyme
Mb Myoglobin
NMA N-methyl acetamide
NMR Nuclear Magnetic Resonance
pat A patellamide A pat B patellamide B pat C patellamide C pat D patellamide D pat E patellamide E pat G patellamide G
PatGmac macrocyclase PatG
PDB Protein Database
RAAS renin-angiotensin-aldosterone system
RMSD root-mean square deviation
RNse A Ribonuclease A
SA Monte Carlo Simulated Annealing
Sar sarcosine
TCC transition charge coupling
TDC transition dipole coupling
I. INSIGHTS FOR THE DESIGN OF NOVEL
DRUGS FOR HYPERTENSION
1. INTRODUCTION
Hypertension, or high blood pressure, is a chronic condition recognized as one of the leading causes for human morbidity and mortality worldwide through its effects on target organs like heart, brain and kidneys. It is a major risk factor for myocardial infarction, congestive heart failure, stroke, and end-stage renal disease all of which convey risk of significant morbidity and mortality [1].
Despite the huge problem of the disease and the existence of several different classes of antihypertensive pharmacological drugs, the incidence of hypertension and related cardiovascular diseases remains steadily on the rise, and relatively few patients achieve the targeted blood pressure level. Moreover, majority of available pharmacological agents for hypertension present severe side effects to the organism.
The renin-angiotensin-aldosterone system (RAAS) plays an important role not only in the control of blood pressure, but in the pathogenesis of diabetes and kidney diseases. While it has been difficult to demonstrate in vivo activation of the RAAS in early or established hypertension in humans, there is no doubt that inhibition of the RAAS is effective in lowering blood pressure in patients with primary hypertension. The results of multiple clinical trials demonstrate that blocking the RAAS through the targets of angiotensin-converting enzyme (ACE) or angiotensin II receptor type 1 (AT1), which are parts of the proteolytic cascade of the RAAS, with the corresponding inhibitors not only lower blood pressure, but also reduces cardiovascular events and total morbidity and mortality [1, 2]. Thus, it makes the study of this system highly important, and design of new blocking agents to this cascade is an attractive therapeutic strategy.
The aim of the project was to provide insights for the design of novel drugs for hypertension involving theoretical and computational calculations. The study has been performed focusing on creating a model of the AT1 receptor, identifying the binding poses of Angiotensin II and several AT1 antagonists. Homology modelling, force-field minimization, and molecular docking calculations were used during the study.
2. RENIN-ANGIOTENSIN-ALDOSTERONE-SYSTEM (RAAS) IN HYPERTENSION
2.1 GPCR receptors
G protein-coupled receptors (or GPCRs), also known as seven-transmembrane domain receptors (7TM receptors), are integral membrane proteins that contain seven membrane-spanning helices. As the name suggests they are coupled to heterotrimeric G proteins on the intracellular side of the membrane. Upon ligand binding, the GPCR undergoes a conformational change that is transmitted to the G protein causing activation. Further signal transduction depends on the type of G protein.
GPCRs are the largest and most diverse group of membrane receptors in eukaryotes. They are activated by a wide variety of ligands, olfactory stimulants, peptides, hormones, neurotransmitters and light. They are grouped into 6 classes based on sequence homology and functional similarity:
Class A (or 1) (Rhodopsin-like);
Class B (or 2) (Secretin receptor family);
Class C (or 3) (Metabotropic glutamate/pheromone); Class D (or 4) (Fungal mating pheromone receptors); Class E (or 5) (Cyclic AMP receptors);
Class F (or 6) (Frizzled/Smoothened).
GPCRs are the target of around half of all modern medicinal drugs. Their expression on the cell surface makes them readily accessible to hydrophilic drugs and their non-uniform expression provides selectivity in activating or blocking physiological events. Agonists and antagonists of GPCRs are used in the treatment of disease in every organ system.
GPCRs are the targets of almost 50% of all drugs currently available on the market [3]. Class A GPCRs (or Rhodopsin-like) share the same basic topology of seven transmembrane helices connected by three extracellular and three intracellular loops. The receptor is capped with an extracellular amino terminus and intracellular carboxyl terminus (Fig. 1).
Fig. 1 – Schematic representation of the class A GPCR topology. This picture shows an “activated” GPCR embedded in a lipid bilayer. The C-terminus of the receptor is associating with the G-protein trimer.
2.2. AT1 receptor
The angiotensin II type I (AT1) receptor is a class A GPCR (Fig. 1) and is involved in the RAAS (Fig. 2).
Fig. 2 – A diagram illustrating the RAAS cascade, beginning with angiotensinogen and ending with the binding of angiotensin-II to the AT1 receptor.
The RAAS plays a key role in blood pressure regulation and electrolyte homeostasis, and it is involved in the pathogenesis of hypertension and renal diseases. The RAAS system is a proteolytic cascade that starts with the release of the enzyme renin by the juxtaglomerular cells located in the kidney. Renin binds a plasma protein named angiotensinogen (452 amino acids) and hydrolyses the peptidic bond between the 10th
and 11thpositions, releasing a decapeptide known as angiotensin I (Ang-I). Ang-I remains
biologically inactive until it is further cleaved into the octapeptide angiotensin II (Ang-II) by the metalloprotease angiotensin-converting enzyme (ACE) [4]. Ang-II is the main effector
hormone of the RAAS. Ang-II subsequently binds and activates a transmembrane receptor AT1 located in the cardiovascular, neuronal, endocrine and hepatic cells [5]. AT1 activation – the last binding of Ang-II to AT1 receptor – induces cardiovascular events such as vasoconstriction, inflammatory response, aldosterone release and salt retention [6, 7]. Many antagonists have been designed to block this interaction in order to treat clinical cases of hypertension [8].
The AT1 receptor, a 359-aminoacid protein, is widespread in organs and tissues, but is found predominately in vascular and myocardial tissue, the liver, the adrenal cortex and some areas of the brain [9, 10]. The design and development of AT1 blockers could be useful as specific remedies for many pathologies like hypertension, heart and kidney failures. Therefore, a knowledge of the 3D structure of the AT1 receptor could be of great help in this task.
The 3D-structure of a protein is usually obtained experimentally and the main techniques for this purpose are X-ray crystallography and Nuclear Magnetic Resonance (NMR). Unfortunately, the crystallization of almost all GPCRs is still an unresolved problem [11].
Given the high-level of interest these proteins attract, it is not surprising that predictive methods to derive information about their 3D-structure are essential. An alternative approach to experimental methods is to build a molecular model of the protein through the homology modelling (HM), [12] in which the target protein is constructed starting from the experimentally known 3D-structure of related proteins.
The first high-resolution structure of a protein related to GPCRs was published for bovine rhodopsin [13], thus more reliable HM approaches for all the GPCRs begun to be affordable. Recently, some other related proteins were resolved [14, 15, 16]. Below in the section 3.2.1, all the available crystallographic structures would be reported.
2.3. Angiotensin II receptor blockers (ARBs)
The initial target for developing compounds that could inhibit the renin-angiotensin pathway was the angiotensin II octapeptide (Asp1-Arg2-Val3-Tyr4-Ile5-His6-Pro7-Phe8). Ang-II plays a key role in the regulation of cardiovascular homeostasis. Acting on both the “content” and the “container”, Ang-II regulates blood volume and vascular resistance. The wide spectrum of Ang-II target tissues includes the adrenals, kidney, brain, pituitary gland, vascular smooth muscle, and the sympathetic nervous system.
Angiotensin II receptor blocker (ARBs) are designed to displace angiotensin II from the AT1 receptor and produce their blood pressure–lowering effects by antagonizing angiotensin II–induced vasoconstriction, aldosterone release, catecholamine release, arginine vasopressin release, water intake, and hypertrophic response [17].
Efforts to develop angiotensin II receptor antagonists began in the early 1970s and focused on peptide-based analogues of the natural agonist. The prototypical compound that resulted from these studies was saralasin, an octapeptide in which the Asp1 and Phe8 residues of angiotensin II were replaced with Sar (sarcosine, N-methylglycine) and Ile, respectively. Saralasin, as well as other peptide analogues demonstrated the ability to reduce blood pressure. However, these compounds lacked oral bioavailability and has to be administered intravenously [18], and it has behaved as a partial agonist [19].
More recent efforts have used peptide mimetics to pass over these inherent problems with peptide-based antagonists. In early 1980s it was noted that a series of imidazole-5-acetic acid derivatives decreased blood pressure responses to Ang-II in rats. Two compounds, S-8307 and S-8308 [20], were later found to be highly specific and promising non-peptide Ang-II receptor antagonists, but afterwards it was seen that their structures would have to mimic more closely the pharmacopoeia of Ang-II. Structural modifications were made and the orally active, potent and selective non-peptide AT1 receptor blocker losartan was developed. As a result of these efforts in 1995, losartan first to be approved for clinical use in the United States and since then seven additional ARBs have been approved [21, 22] (Table 1).
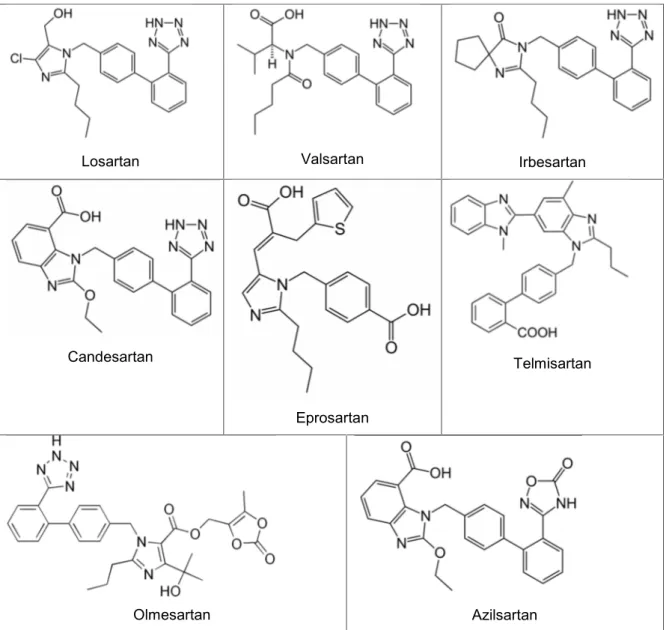
Losartan, developed to mimic a natural peptide Ang-II, shares common structural
features with it. The imidazole ring of losartan correlated with the imidazole side chain of the His6 residue, and the n-butyl group of losartan correlated with the hydrocarbon side chain of the Ile5 residue. Valsartan, irbesartan, telmisartan, candesartan, olmesartan, and azilsartan are biphenyl analogs of losartan.
Valsartan represents a nonheterocyclic AT1 receptor selective antagonist in which
the imidazole of losartan has been replaced by an acylated amino acid [23].
Irbesartan is a potent AT1 receptor antagonist that incorporates an imidazolinone
ring in which a carbonyl group functions as a hydrogen bond acceptor in place of the hydroxymethyl group of losartan [24].
The benzimidazole, candesartan cilexetil, developed at Takeda Chemical Industries, is an ester carbonate prodrug that is rapidly converted to the corresponding 7-carboxylic acid, candesartan in vivo [25]. Candesartan is a potent, long acting selective
AT1 receptor, competitive insurmountable antagonist [26]. The carboxyl group at the benzimidazole ring plays an important role in the interaction of candesartan with AT1 receptor [27].
Losartan Valsartan Irbesartan
Candesartan
Eprosartan
Telmisartan
Olmesartan Azilsartan
Table 1 – Structures of AT1 receptor nonpeptidic antagonists.
3. MODELLING THE AT1 RECEPTOR 3.1. Homology modelling methodology
Generally, the study of a protein’s function requires previous knowledge of its three-dimensional structure [28, 29], which is ultimately determined by protein sequence [30]. Protein structure determination using experimental methods, such as X-ray crystallography or NMR spectroscopy is time consuming and not successful with all proteins, especially membrane proteins [31]. The huge gap between the number of available sequences and experimentally solved protein structures could possibly be resolved by computational methods.
The homology modelling method predicts the three-dimensional structure of a given protein sequence based primarily on its sequence similarity to one or more proteins of known structures. It is also called comparative modelling or template-based modelling.
Homology modelling methods use the fact that evolutionary related proteins share a similar structure [32, 33]. A protein structure is always of great assistance in the study of interactions with ligands within pharmaceutical industry in structure-based drug discovery and drug design. Homology modelling can provide the molecular biologists and biochemists with "low-resolution" structures, which will contain sufficient information about the spatial arrangement of important residues in the protein and that may guide the design of new experiments.
The protein under the query with unknown 3D structure is called the target. Whereas, the protein or proteins with similar sequence and known 3D structure, that would be used to predict the structure of the target protein is known as template protein or proteins.
In practice, homology modelling is a multistep process that can be summarized in four steps: 1) template selection; 2) target-template alignment; 3) model construction and 4) model assessment.
Step 1. Template selection
The sequence of similarity can be searched using BLAST or Psi blast or fold recognition methods and align with the known structures in Protein Database (PDB). PDB is the largest database that contains only experimentally resolved structures. BLAST allows comparing a query sequence with a database, such as PDB and identifying the best sequence that shares a high degree of similarity. The sequence of similarity of each line is summarised with its E-value (Expected value). E-values closer to zero, have high degree of similarity. The E-value describes the number of hits one can “expect” when searching through a database of a particular size. The sequences that fall under safe zone are expected to be getting good structure than twilight zone and midnight zone.
Step 2. Target-template alignment
After identifying one or more possible template, alignment is performed. Sometimes it is difficult to align two sequences that have low percentage of identity. Such cases, one can use other sequences from homologous proteins to solve this problem. Multiple Sequence Alignment programs such as CLUSTALW [55] align sequences by insertions and deletions. Alignment correction is the critical step in Homology Modelling, otherwise which in turn creates a defective model.
Step 3. Model construction (Backbone generation) a. Backbone generation
The backbone generation from the aligned regions can be done using modelling tools such as Modeller [34]. The actual experimentally determined structures contain
manual errors due to poor electron density in the map. Therefore a good model has to be chosen with less number of errors.
Modeller is a program for comparative protein structure modelling by satisfaction of spatial restraints [35]. It can be described as “Modelling by satisfaction of restraints” uses a set of restraints derived from an alignment and the model is obtained by minimization of these restraints. These restraints can be from related protein structures or NMR experiments. User gives an alignment of sequences to be modelled with known structures. Modeller calculates a model with all heavy atoms. It also performs comparison of protein structures or sequences, clustering of proteins, searching of sequence databases.
The highest sequence identity, observed for CXCR4 Chemokine receptor (34%), is still small for basic safe homology modelling. Therefore, two more sophisticated approaches were used for modelling: iterative modelling and advanced modelling.
Iterative modelling was introduced to overcome the problem in homology
modelling caused by limitation of errors in the alignment of a modelled sequence with related proteins of known three-dimensional structure. Thus, it have been developed an automated method that optimizes both the alignment and the model implied by it [36]. This task is achieved by a genetic algorithm protocol that starts with a set of initial alignments and then iterates through re-alignment, model building and model assessment to optimize a model assessment score.
Advanced modelling, based on multiple templates, utilizes information from various
templates, and therefore “naturally” increases the accuracy of Homology Modelling, presumably since it better captures the variability and divergence of natural structures.
b. Loop modelling
In most cases, alignment between model and template sequence contain gaps. By means of insertions and deletions with some conformational changes to the backbone it can be modelled, although it rarely happens to secondary structures. Therefore, it is safe to shift the insertion and deletions of the alignment, out of helices or strands and placing them in loops or coils. But this loop conformational change is difficult to predict due to many reasons like:
1. Surface loops tend to be involved in crystal contacts, leading to a significant conformational change between template and target.
2. The interchange of the side chains can lead to change in the orientation and spatial arrangement, especially when it is an interchange between small and a bulky group.
3. Proline and glycine are an exception when a Ramachandran plot is considered. Proline has a restriction in the plot due to its 5 membered ring, whereas glycine has a
hydrogen atom as its side chain which is very difficult to predict from the plot. This makes it difficult for detect mutations that have happened to loop residue from/to either glycine or proline.
In Modeller, the loop modelling is based on the loop refinement – optimization method for loop modelling. This method relies on a scoring function and optimization schedule adapted for loop Modelling. It is used automatically to refine comparative models if one uses the command from loopmodel class rather than automodel.
c. Side chain modelling
Proteins that are structurally similar, have similar χ1–angles (i.e., the torsion about
Cα-Cβ bond. In such cases, copying conserved residues entirely from the template to the model will result in higher accuracy than copying the backbone or re-predicting side chains. Side chain conformations are partially knowledge based which uses libraries of rotamers extracted from high resolution X-ray structures. To build a position-specific rotamer library, one can take high-resolution protein structures and collects all stretches of three to seven residues (method dependant) with a given amino acid at the center. Prediction accuracy is usually quite high for residues in the hydrophobic core, it is much lower for surface residues.
There are two reasons for this:
1. Flexible side chains on the surface tend to adopt multiple conformations, which are additionally influenced by crystal contacts.
2. Energy functions used to score rotamers can easily handle hydrophobic packing in the core (Van der Waals interactions), but are not accurate enough to get complicated electrostatic interactions on the surface.
d. Model optimization
Sometimes the rotamers are predicted based on incorrect backbone or incorrect prediction. Such cases Modelling programs either restrain the atom positions and/or apply only a few hundred steps of energy minimization to get an accurate value. This accuracy can be achieved by 2 ways:
1. Quantum force field: To handle large molecules efficiently force field can be used, energies are therefore normally expressed as a function of the positions of the atomic nuclei only. Van der Waals forces are, for example, so difficult to treat, that they must often be completely omitted. While providing more accurate electrostatics, the overall precision achieved is still about the same as in the classical force fields.
2. Self-parametrizing force fields: The precision of a force field depends to a large extent on its parameters (e.g., van der Waals radii, atomic charges). These parameters are usually obtained from quantum chemical calculations on small molecules and fitting to experimental data, following elaborate rules [37]. By applying the force field to proteins,
one implicitly assumes that a peptide chain is just the sum of its individual small molecule building blocks—the amino acids.
Step 4. Model assessment
The obtained models may contain errors, which mainly depend upon two values: 1. The percentage identity between the template and the target. If the value is >90%, then accuracy can be compared to crystallography, except for a few individual side chains. In this case sequence similarities are considered accurate enough for drug discovery applications. If its value ranges between 50-90%, the root-mean square deviation (RMSD) error can be as large as 1.5 Å, with considerably more errors. Those between 25 and 50% identities can be helpful in designing of mutagenesis experiments. If the value is <25% the alignment turns out to be difficult for Homology Modelling, often leading to quite larger errors [38, 39].
2. The number of errors in the template. Errors in a model become less of a problem if they can be localized. Therefore, an essential step in the Homology Modelling process is the verification of the model. The errors can be estimated by calculating the model’s energy based on a force field. This method checks to see if the bond lengths and angles are in a normal range. However, this method cannot judge if the model is correctly folded. The 3D distribution functions can also easily identify misfolded proteins and are good indicators of local model building problems.
The prediction and assessment of protein structures can be enabled by accurate free energy function [40]. The native structure generally has the lowest free energy of all states under the native conditions. In principle, the free energy surface of a protein can be derived by thoroughly sampling the potential energy surface defined by a molecular mechanics force field [41]. However, this approach is computationally prohibitive and may be further limited by errors in potential energy functions. Instead of relying on free energy, an alternative approach is to construct a scoring function whose global minimum also corresponds to the native structure from a sample of native structures of different sequences [42] deposited in the Protein Data Bank. Due to its dependence on known protein structures, such a scoring function is often termed a knowledge-based or statistical potential. Such statistical potential was derived and implemented to the MODELLER software, and is named as Discrete Optimized Protein Energy, or DOPE [43]. The DOPE model score was designed for selecting the best structure from a collection of models built by MODELLER software. For example, when the multiple models are built, one can select the model that returns the lowest DOPE score.
Another way to assess the models is a GA341 assessment score, a score for the reliability of a model, derived from statistical potentials [44]. GA341 scores always range from 0.0 (worst) to 1.0 (native-like). A model is predicted to be reliable when the model
score is higher than a pre-specified cutoff (0.7). A reliable model has a probability of the correct fold that is larger than 95%. However GA341 is not as good as DOPE at distinguishing 'good' models from 'bad' models.
3.2. Homology modelling of the AT1 receptor
Below, the structures that are used as templates for the target, found in the PDB, are discussed.
Several attempts have been made to model the human AT1 receptor structure using bacteriorhodopsin 3D structure [45, 46, 47] as a template. Because bacteriorhodopsin is not class A GPCR, direct use of its structure to model the TM-domain structure of the AT1 receptor is limited. Recent availability of bovine Rhodopsin (bRh) ray structures made it possible to model the AT1 receptor. Below are reviewed these X-ray structures.
Family of Bovine Rhodopsin receptor
In the year 2000, Palczewsky et al. reported the first high resolution structure of bovine rhodopsin [13]. The structure with a 2.8 Å resolution can be found in the Protein Data Bank (PDB) [48] with PDB ID 1F88 (Fig. 3a). This surely was a milestone towards understanding of the structure of the other GPCRs and for the evolution of the HM procedures.
Other high-resolution models of bRh, obtained using X-ray diffraction, have been successively deposited in the PDB by Teller et al. – PDB ID 1HZX [49] (Fig. 3b), and by Li et al. – PDB ID 1GZM [50] (Fig. 3c). The structures have comparable resolution to PDB ID 1F88.
a) b) c)
d) e)
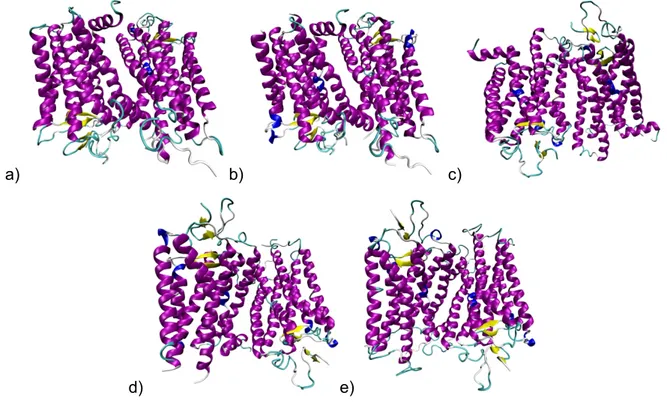
Fig. 3 – Bovine rhodopsin receptor: a) 1F88, b) 1HZX, c) 1GZM, d) 1L9H, e) 1U19
a) b) c)
d) e) f)
Fig. 4 – Human kappa opioid receptor: a) 4DJH; human β2-adrenergic receptor: b) 2RH1, c) 3NY9; CXCR4 receptor:
Similarly, another structure was crystallised and published by Okada et al. – PDB ID 1L9H [51] (Fig. 3d). This structure possesses the resolution of 2.6 Å, moreover, it shows that seven water molecules bind some of the highly conserved residues among rhodopsin-like GPCRs and are able to mediate intramolecular interactions between the seven TM domains. Therefore this 3D structure is to be considered of particular importance for the GPCR HM development.
More recently, a new structure (1U19 [52], Fig. 3e) has been available in the PDB. It was crystallised under different conditions, allowing an improvement of the quality of the HM template structure because the resolution was reduced to 2.2 Å.
Family of human kappa opioid receptor
In 2012, another structure from the family of GPCR receptors – human kappa opioid receptor (4DJH [53], Fig. 4a) has been resolved and deposited to the PDB.
Family of human β2-adrenergic receptor
The crystal structure of one of the most extensively studied receptors – human β2
-adrenergic receptor (2RH1 [14], Fig. 3f) – was reported by Cherezov et al. The structure provides a high-resolution (2.4 Å) view of a human G protein-coupled receptor bound to a diffusible ligand. More recently, another 3D structure of the same receptor in complex with two inverse agonists (3NY9 [15]) was resolved by Wacker et al.
Family of CXCR4 receptor
The branch of γ-GPCR includes available crystallographic structures. In particular, the CXCR4 receptor retains most of the common GPCR structural characteristics, whereas the fourth transmembrane domain (TM4) differs in length as it forms an extra α-helix turn near extracellular part. Wu et al. [16] reported about independent crystal structures of CXCR4 bound to an antagonist small molecule IT1t and a cyclic peptide CVX15 at 2.5 to 3.1 angstrom resolution (3ODU, 3OE0, 3OE9).
The sequences that are necessary for sequence alignment were obtained from the SwissProt Database [54].
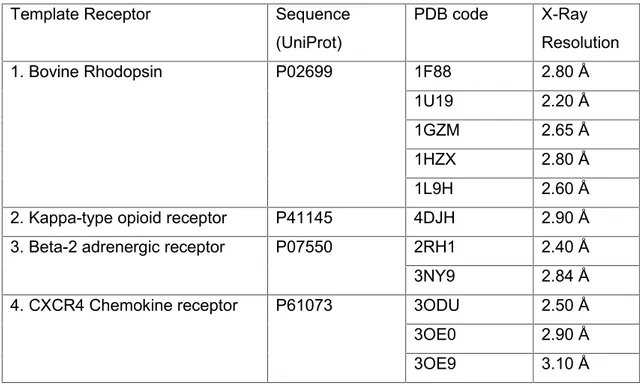
All possible templates, used in this study, are summarized below in the Table 2. The table includes the name of the receptor, PDB code, sequence identity code, and X-Ray resolution.
The initial multiple sequence alignment was performed using ClustalW as provided on the EBI webserver [55]. The program compares the query sequence to the template sequences of known structures.
Template Receptor Sequence (UniProt) PDB code X-Ray Resolution 1. Bovine Rhodopsin P02699 1F88 2.80 Å 1U19 2.20 Å 1GZM 2.65 Å 1HZX 2.80 Å 1L9H 2.60 Å 2. Kappa-type opioid receptor P41145 4DJH 2.90 Å 3. Beta-2 adrenergic receptor P07550 2RH1 2.40 Å 3NY9 2.84 Å 4. CXCR4 Chemokine receptor P61073 3ODU 2.50 Å 3OE0 2.90 Å 3OE9 3.10 Å
Table 2. Available target templates
In the Table 3 below, the results of multiple alignments are presented in the order from the highest to lowest sequence identity percentage. One is interested in the highest values – the highest similarity between the template and the target proteins. The highest sequence identity is observed for CXCR4 Chemokine receptor – 34%. This is followed by Kappa-type opioid receptor (29%), Beta-2 adrenergic receptor (21%), and Bovine Rhodopsin with 20%.
Template Receptor Sequence identity
PDB code X-Ray Resolution 1. CXCR4 Chemokine receptor 34% 3ODU 2.50 Å
3OE0 2.90 Å 3OE9 3.10 Å 2. Κ-opioid receptor 29% 4DJH 2.90 Å 3. β2adrenergic receptor 21% 2RH1 2.40 Å
3NY9 2.84 Å 4. Bovine Rhodopsin receptor 20% 1F88 2.80 Å 1U19 2.20 Å 1GZM 2.65 Å 1HZX 2.80 Å 1L9H 2.60 Å
In the Fig. 5 the multiple sequence alignment between the target receptor AT1 and the template receptors are presented. The initial alignment was manually adjusted to best satisfy the position of residues conserved throughout class A GPCR’s [56]. Any gaps were avoided in the trans-membrane helices and instead placed in the loop and termini regions.
Fig. 5. Multiple sequence alignment between the target receptor AT1 and the template receptors, performed in CLUSTAL 2.1 [55].
The Homology Modelling protocol will proceed to arrange the backbone of the target sequence according to that of the template, using the sequence alignment to decide where to position each residue. Therefore, the quality of the sequence alignment is of crucial importance. Misplaced indels (gaps representing insertions or deletions) will cause residues to be misplaced in space. Although the routine used does alignments automatically, careful inspection and manual adjustment may improve the quality of the alignment, and hence, of the homology model.
After the multiple alignments were done, it was decided to perform iterative modelling on the base of each template, and advanced modelling on the base of multiple structures of the same template. Thus, it was done four iterative modelling protocols, and three advanced modelling protocols (kappa-type opioid receptor has only one available X-ray structure; therefore it hasn’t been involved in multiple template construction).
Five models were produced from the four templates in iterative modelling, and 5 models were produced from each group of available structures from three templates in advanced modelling, so in total 35 models. The next step was to select the “best” models.
Iterative modelling Advance modelling
1. On the base of CXCR4 Chemokine
receptor template 1. On the base of 3 structures of CXCR4Chemokine receptor
Model
name DOPEscore GA341score Model name DOPEscore GA341score Model.It.1.1 -40877.5 0.95395 Model.Adv.4.1 -41308.8 0.99993 Model.It.1.2 -40389.2 0.95677 Model.Adv.4.2 -40507.5 0.99986 Model.It.1.3 -41117.5 0.98503 Model.Adv.4. 3 -41484.0 0.99999
Model.It.1.4 -41491.1 0.94713 Model.Adv.4. 4 -40401.9 0.98810
Model.It.1.5 -41117.0 0.96780 Model.Adv.4. 5 -40988.4 0.99831
2. On the base of β2adrenergic
receptor template 2. On the base of 2 structures of βadrenergic receptor 2
Model
name DOPEscore GA341score Model name DOPEscore GA341score
Model.It.3.1 -38933.3 0.29955 Model.Adv.2.1 -42005.4 0.31227
Model.It.3.2 -38603.6 0.20276 Model.Adv.2.2 -40786.3 0.40978 Model.It.3.3 -38722.4 0.26280 Model.Adv.2.3 -41166.9 0.44090
Model.It.3.4 -38693.0 0.26446 Model.Adv.2.4 -40365.5 0.30343 Model.It.3.5 -38068.8 0.17337 Model.Adv.2.5 -41142.7 0.36918
3. On the base of Bovine Rhodopsine
receptor template 3. On the base of 5 structures of BovineRhodopsin receptor
Model
name DOPEscore GA341score Model name DOPEscore GA341score
Model.It.4.1 -43537.9 0.05072 Model.Adv.3.1 -42766.7 0.11459
Model.It.4.2 -43143.4 0.12643 Model.Adv.3.2 -43578.2 0.12359
Model.It.4.3 -42829.2 0.12070 Model.Adv.3.3 -43066.8 0.07247 Model.It.4.4 -42785.0 0.18405 Model.Adv.3.4 -43180.9 0.07225 Model.It.4.5 -43119.8 0.13055 Model.Adv.3.5 -42507.0 0.09612
4. On the base of K-type opioid receptor template
Model
name DOPEscore GA341score Model.It.2.1 -37661.7 0.88938
Model.It.2.2 -37896.0 0.93322
Model.It.2.3 -37236.1 0.61869 Model.It.2.4 -37626.6 0.83868
Table 4. The summary of the successfully produced models.
After the assessment by DOPE and GA341 scores was done, and 7 best models were chosen, they were further assessed by the quality of secondary structure by calculating Ramachandran plot [57] for the whole protein. A Ramachandran plot is a way to visualize backbone dihedral angles ψ against φ of amino acid residues in protein structure. The quality of secondary structure elements was tested by using the definitions introduced by Morris et al. for the allowed and disallowed regions for φ and ψ angles of the backbone that reflects the stability of protein structure [58]. Basically, this analysis helps to say which protein model is better. The more amino acid residues fall into allowed region, the better the model. After Ramachandran-plot analysis of the chosen models, there were chosen 2 models: one from iterative modelling on the base of one chemokine receptor template – model 1, and one from advanced modelling on the base of three chemokine receptor templates – model 2. Their plots are presented on the Fig. 6. Model 1 has 93% of the residues in the allowed region, while model 2 has 94%.
Fig 6. – Ramachandran plot: a) model 1; b) model 2.
Force-field minimization in AMBER: After two models were chosen, they were
optimised with molecular mechanical level of theory in the Amber software [59]. Each of the modelled receptors was placed to the box, the faces of which are 12 Å distant from the
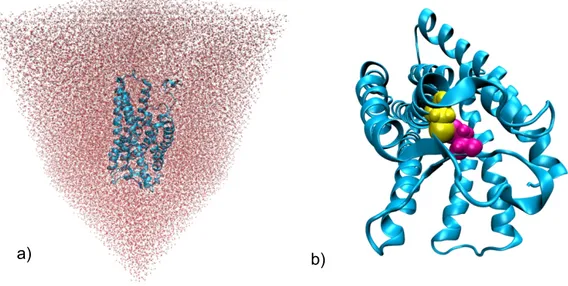
protein, and the boxed was filled with explicit water molecules (TIP3PBOX) with xleap program (Fig. 7). Chlorine or sodium counter ions were added to keep the system neutral. The relaxation was carried out in three steps. In a first phase only the geometry and position of the water molecules were minimized by keeping the rest of the system fixed. This step aims to reduce possible unfavourable interactions caused by automated placement of water molecules by xleap program. In a second step the position of the hydrogen atoms was optimized, while maintaining the other atoms fixed. At third step the position of all atoms of the model was optimized. The Force Field used was parm99SB, specifically created for proteins.
The disulfide bonds were formed between Cys101 in TM3 and Cys180 in extracellular-loop 2 by covalently bound their sulphur atoms (Fig. 7). Globally, we have performed energy minimizations with the AMBER force field to allow the protein atoms to relax and adjust.
Fig. 7 – Force-field minimization in AMBER: a) AT1 receptor in the water box; b) modelled AT1 receptor with the conserved disulphide bond Cys101-Cys180 (magenta and yellow).
After energy minimization was done, the models were visually checked. The following residues experimentally shown to be involved in Ang-II binding, Lys199, Asn111, His256, Gln257, Asn294, Asn295 and Asn298, are indeed pointing inward. The analysis of interactions would provide a clear understanding which model would be preferable in further studying after molecular docking calculations would be performed.
Now, the models are ready to proceed with the next step of study – Molecular Docking.
4. MOLECULAR DOCKING 4.1 Protein-Ligand Docking methodology
Molecular docking is a widely used computer simulation procedure to predict the structure of the intermolecular complex formed between two or more constituent molecules, and tries to distinguish, from the energy point of view, binding mode of such complex, i.e. pose that maximizes the binding energy of interaction while minimizing the total energy of the complex. The accurate prediction of the binding poses between the ligand and protein is of fundamental importance in modern structure-based drug design.
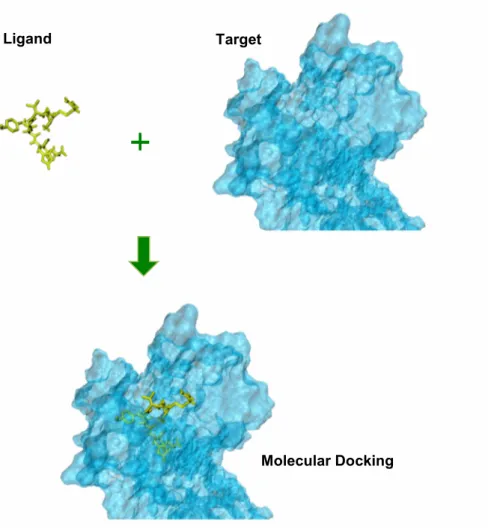
The present study is related to the protein-ligand docking. The protein-ligand docking tries to predict the position and orientation of a ligand (a small molecule) when it is bound to a protein, enzyme or receptor (macromolecule). In our study we docked the natural peptide Ang-II and known inhibitors to a modelled receptor AT1 (Fig. 9).
Modelling the interaction of two molecules is a complex and challenging problem. Many forces are involved in the intermolecular association, including hydrophobic, van der Waals, or stacking interactions between aromatic amino acids, hydrogen bonding, and electrostatic forces. Modelling the intermolecular interactions in a ligand-protein complex is difficult since there are many degrees of freedom as well as insufficient knowledge of the effect of solvent on the binding association. The process of docking a ligand to a binding site tries to mimic the natural course of interaction of the ligand and its receptor via the lowest energy pathway. There are simple methods for docking rigid ligands with rigid receptors, and flexible ligands with rigid receptors. However, methods of docking that considers conformationally flexible ligands and receptors are problematic, as well as, large time and computationally consuming. Therefore, in our study an approach to consider the ligand flexibility while assuming having a rigid protein receptor was used.
Fig. 8 – Representation of the Protein-Ligand Molecular Docking
Docking protocols can be described as a combination of a search algorithm, and the scoring functions. The search algorithm should create an optimum number of configurations that include the experimentally determined binding modes. Although a rigorous searching algorithm would go through all possible binding modes between the two molecules, this search would be impractical due to the size of the search space and amount of time it might take to complete. As a consequence, only a small amount of the total conformational space can be sampled, so a balance must be reached between the computational expense and the amount of the search space examined. On the other hand, scoring function consists of a number of mathematical methods used to predict the strength of the non-covalent interaction called the binding affinity. In all the computational methodologies, one important problem is the development of an energy scoring function that can rapidly and accurately describe the interaction between the protein and ligand. Over the course of the last years, different scoring functions have been developed that exhibit different accuracies and computational efficiencies. Some of these commonly-used functions are: force-field, empirical, knowledge-based and consensus scoring.
Ligand Target
The molecular docking study was performed using software AutoDock v.4.0 [60]. This software contains a package of automated tools that were designed to predict how small molecules, such as substrates or drug candidates, bind to a receptor with given 3D structure.
AutoDock consists of two main programs: AutoDock that performs the docking of the ligand to a set of grids describing the target protein, and AutoGrid that pre-calculates these grids. In order to optimise the creation of the input files that were required to run AutoDock and AutoGrid, the VsLab plug-in [61], which was written in the group of Theoretical Chemistry and Computational Biochemistry of the University of Porto, was used. VsLab is an easy-to-use and freely available graphical interface for the molecular docking software AutoDock that has been included into VMD as a plug-in.
AutoDock offers a variety of search algorithms to explore a given docking problem. These include Monte Carlo Simulated Annealing (SA); a Genetic Algorithm (GA); and a hybrid local search GA, also known as the Lamarckian Genetic Algorithm (LGA). In general, the LGA performs the best out of SA, GA, and LGA, in finding the lowest energy of the system. We chose LGA algorithm for our studies.
4.2 Docking of the angiotensin II to the model of the AT1 receptor
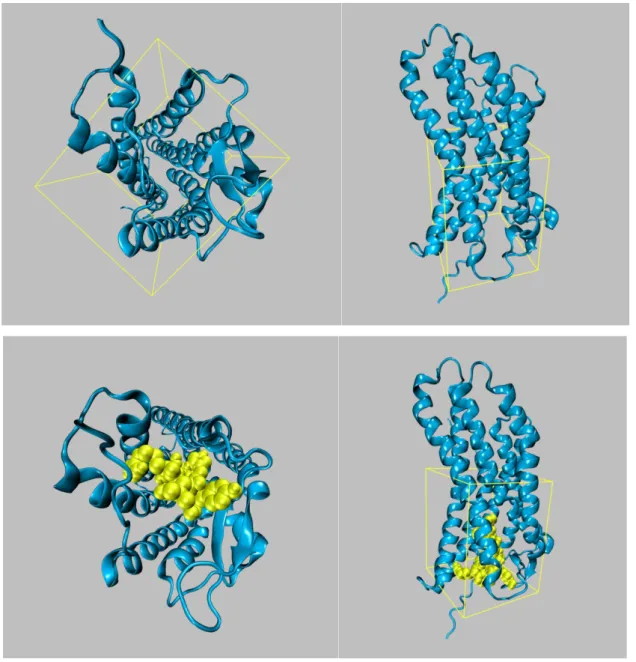
After two models of the AT1 receptor were prepared for the study of docking, Ang-II was docked to both models following the same procedure. The octapeptide Ang-Ang-II was docked to the docking area that includes the binding pocket according to known site-directed mutagenesis data [62, 63, 64, 65]. The parameters of the docked box, used in the study on the base of known interactions, were as following: width 25.87 Å; height: 26.625 Å; depth: 31.5 Å. Number of grid points at X, Y, Z: 66, 76, 89, with grid spacing of 0.375 Å (Fig. 9).
The ligand, peptide hormone, Ang-II was obtained from the PDB (PDB code 1N9V).
As can be seen from the representation of the docked Ang-II to the modelled AT1 receptor (Fig. 9), it is nestled between TM helices.
Fig. 9 – Representation with the box of the docking area of the AT1 receptor (blue), and docked Ang-II (yellow).
All the docking poses of Ang-II to the AT1 receptor were analysed for binding site to choose the best model. The results of docking showed better results for the second model (on the base of multiple structures of the chemokine receptor). The discussions of docking are presented below. This model was used in further analysis – docking of the inhibitors.
Table 5 contains solutions of the docking of the ligand with corresponded energy score that is the Gibbs energy of interaction. The lower the value the stronger ligand is bound to the receptor. The dissociation constants were calculated as well.
Ligand (S#, docking solution number) Score Ki(M) AngII-S1 -10.46 2.15·10-08 AngII-S2 -8.79 3.60·10-07 AngII-S3 -8.40 6.95·10-07 AngII-S4 -8.19 9.91·10-07 AngII-S5 -8.18 1.01·10-06 AngII-S6 -6.60 1.45·10-05 AngII-S7 -6.58 1.50·10-05 AngII-S8 -6.47 1.81·10-05 AngII-S9 -6.40 2.03·10-05 AngII-S10 -5.34 1.22·10-04
Table 5 – Solutions of the docking of Ang-II to the model of the AT1 receptor, with corresponding energy scores, and dissociation constants.
The best docked solutions were visualised thoroughly with VMD, whether they fulfilled known experimental data (mainly the interaction of the carboxyl terminal with Lys199, and Arg167). The first complex, which showed the better and most stable binding free energy value, was chosen for further investigation, and the interactions of which are described.
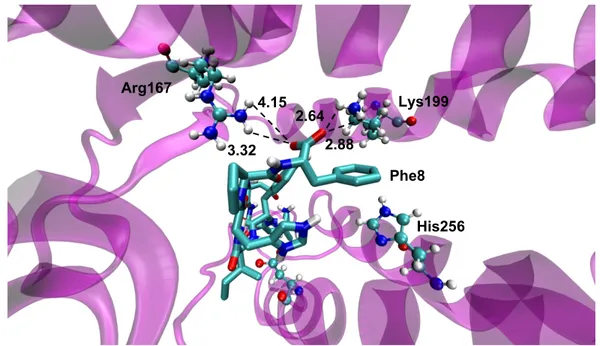
As presented on Fig. 10, the representative binding conformation of Ang-II shows a hydrogen bond interaction between Lys199 in TM5 and the carboxyl terminal of the peptide (Phe8). The distance between oxygen of the carbonyl terminal of the peptide and NH3group of Lys199 of the AT1 receptor are 2.64 Å and 2.88 Å. Another important
interaction was found between the carboxyl terminal of the peptide (Phe8) and Arg167 in TM4 of the AT1 receptor. This interaction is critical, since studies have showed an almost complete loss of Ang-II affinity when Arg167 was mutated [66, 67]. In the present homology model, Arg167 points to the binding site core (Fig. 10). And the distance between oxygen of the carboxyl terminal of the peptide (Phe8) and NH2group of Arg167
of the AT1 receptor are 3.32 Å and 4.18 Å. The interaction of His256 with Phe8 (Fig. 10) known to be critical for Ang-II activation is a stacked attraction of aromatic rings [68, 69, 70]. In the present homology model the rings are oriented parallel to each other with the distance approximately of 6.00 Å.
Fig. 10 – Representation of the predicted binding site of Ang-II (licorice) in the AT1 receptor (NewCartoon magenta). Residues Lys199, Arg167, and His256 of AT1 receptor are represented in CPK. The distance unit is specified in angstroms.
The Phe8 bulky ring of Ang-II is oriented towards the highly hydrophobic pocket formed by residues Ala104, Val108, Phe77, Leu81, Trp253, Leu112, Tyr292, Phe182, Trp84, Met284, Ile288 of the AT1 receptor (Fig. 11).
Fig. 11 – Representation of the Phe8 of Ang-II (yellow) in the hydrophobic pocket formed by residues Ala104, Val108, Phe77, Leu81, Trp253, Leu112, Tyr292, Phe182, Trp84, Met284, Ile288 of the AT1 receptor.
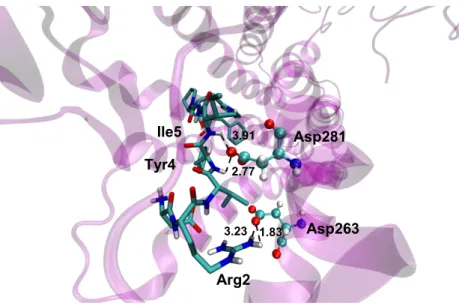
Arg2 interacts with the charged side chain of Asp263 (Fig. 12). Asp263 mutation has also been reported to almost abolish binding of the antagonistic peptide [Sar,Ile]Ang-II
4.15 3.32 2.64 2.88 His256 Arg167 Phe8 Lys199 Ala104 Val108 Phe77 Leu81 Trp253 Leu112 2 Tyr292 Phe182 Trp84 Met284 Ile288
to the AT1 receptor [71]. The distances between oxygen of Asp263 and NH2 group of
Arg2 are 1.83 Å and 3.23 Å. Asp281, which have been documented as important for full agonism of Ang-II, interacts with Tyr4 and Ile5 of Ang-II. The suggested orientation of Tyr4 and Ile5 towards TM7, by forming polar interactions with D281, has been also reported recently [72].
Fig. 12 – Representation of the interaction between Tyr4 and Ile5 of Ang-II and Asp281 of the AT1 receptor, and the interaction between Arg2 of Ang-II and Asp263 of the AT1 receptor. The distance unit is specified in angstroms.
4.3 Docking of the known inhibitors to the model of the AT1 receptor
Each of non-peptide inhibitors (Table 1) was docked to the same docking area as was used for Ang-II. The geometries of non-peptide ligands were obtained from ChemSpider database and the DrugBank database [73, 74].
The predicted binding pose of the inhibitor losartan matches very well with available site-directed mutagenesis data, and is presented on the Fig. 13. Lys199 creates a weak hydrogen bond interaction with the losartan hydroxyl group (4.01 Å), while the tetrazole ring is cradled between Tyr184 and Leu195 (3.91 Å and 2.22 Å, respectively). The central phenyl rings are stabilized by pi-stacking, one with Tyr113, and another with Phe182. Imidazole ring of losartan is stabilized with hydrogen bond with Tyr292 (3.32 Å). The important residue His256 also interacts with a hydroxyl group (2.03 Å).
Arg2 Asp263 Asp281 Ile5 Tyr4 3.23 1.83 2.77 3.91
Fig. 13 – Representation of the predicted binding site of losartan in the AT1 receptor. The distance unit is specified in angstroms.
The predicted binding site for cardesartan (Fig. 14) is similar to that one of losartan. The carboxyl group of the inhibitor creates hydrogen bonds with residues Lys199 and His256 (4.28 Å and 1.72 Å, respectively). Tetrazole ring of the inhibitor is stabilized by
Fig. 14 – Representation of predicted binding site of candesartan in the AT1 receptor. The distance unit is specified in angstroms. His256 Lys199 Ser105 Phe182 Tyr113 1.72 4.28 4.39 Tyr184 Phe182 Leu195 Lys199 Tyr113 His256 Tyr292 4.01 2.03 2.22 3.32 3.91
pi-stacking with Tyr113 (the rings are on the distance around 5.0 Å), and by the interaction with hydroxyl group of Ser105 (4.39 Å). Central ring is stabilized by pi-stacking with Phe182.
The representative binding conformation of olmesartan is depicted on Fig. 15. The predicted binding pocket is similar to the previous non-peptide inhibitors, but in this case Lys199 is not in good orientation to the carboxyl group, but still quite close on the distance of 3.90 Å to it. The same carboxyl group, again as in previous inhibitors, is stabilized by carboxyl group of His256 (2.51 Å). Tetrazole cycle is stabilized by pi-stacking with Tyr113 (the distance is around 5.50 Å), and by interaction with Ser105 (4.30 Å), while phenyl cycle is stabilized by pi-stacking with Phe182 (distance around 4.50 Å).
Fig. 15 – Representation of predicted binding site of olmesartan in the AT1 receptor. The distance unit is specified in angstroms.
The predicted binding site for eprosartan is in a good agreement with previous results. Lys199 is in good orientation and close to the carboxyl group creating an interaction with it (1.82 Å). Ser105 stabilizes the imidazole ring (4.88 Å), while His256 stabilizes carboxyl groups (3.17 Å and 2.03 Å). Phenyl cycle is stabilized by pi-stacking with Trp253 (4.50 Å), while imidazole is pi-stacked with Phe182 (4.00 Å).
Lys199 Ser105 Phe182 Tyr113 His256 2.51 3.90 4.30
Fig. 16 – Representation of predicted binding site of eprosartan in the AT1 receptor. The distance unit is specified in angstroms.
The predicted binding pose of the inhibitor irbesartan (Fig. 17) includes interaction between hydroxyl group of Tyr184 and tetrazole (2.07 Å and 2.08 Å). Imidazole ring is stabilized by hydroxyl groups of Tyr113 and Ser109 (2.23 Å and 2.67 Å). Lys199 is close but as in the case of olmesartan is not in good geometrical orientation. Phenyl cycle is stabilized by pi-stacking with Phe182 (6 Å).
Fig. 17 – Representation of predicted binding site of irbesartan in the AT1 receptor. The distance unit is specified in angstroms. Tyr184 Phe182 Tyr113 Lys199 Ser109 2.07 2.67 2.23 Phe182 1.82 Trp253 His256 Lys199 Ser105 2.03 3.17 4.88
Docking of the inhibitor telmisartan revealed the binding site similar to the previous inhibitors (Fig. 18). The carboxyl group of the inhibitor has interactions with Lys199 and His256 (5.72 Å and 2.39 Å, respectively), while imidazole cycle has interactions with hydroxyl groups of Tyr113 (2.05 Å) and Ser109 (3.16 Å). Stabilization of phenyl cycle again occurs through pi-packing with Phe182.
Fig. 18 – Representation of predicted binding site of telmisartan in the AT1 receptor. The distance unit is specified in angstroms.
The representative binding conformation of valsartan is shown in Fig. 19. Carboxyl group of the inhibitor interacts with Lys199 (3.37 Å) and His256 (2.78 Å). Imidazole cycle
Fig. 19 – Representation of predicted binding site of valsartan in the AT1 receptor. The distance unit is specified in angstroms. His256 2.39 Phe182 Ser109 Lys199 5.72 2.05 3.16 His256 2.78 Tyr113 Tyr184 Lys199 Phe182 3.37 5.23 3.59 Tyr113
is in between hydroxyl groups of Tyr113 (3.59 Å) and Tyr184 (5.23 Å). Phenyl cycle is pi-stacked with Phe182 (5.00 Å).
The predicted binding pose of the last inhibitor azilsartan has a similar pose as the inhibitors described above. The carboxyl group of azilsartan is cradled between Lys199 and His256 (3.30 Å and 3.67 Å, respectively), Asp263 creates a hydrogen bond interaction with hydrogen of imidazole heterocycle (2.29 Å), Tyr184 creates a hydrogen bond interaction with a terminal heterocycle (2.21 Å), the same ring is stabilized by pi-stacking with Phe182 (3.50 Å).
Fig. 20 – Representation of predicted binding site of azilsartan in the AT1 receptor. The distance unit is specified in angstroms.
According to the docking results, the important residues of the binding pocket that interacts with inhibitors are Lys199 and His256, creating hydrogen bonds with carboxyl groups, Phe182 that stabilizes phenyl cycles by pi-stacking, Tyr113 and Ser109 in majority of the cases show interaction with the carboxyl group. Tyr184 is often interactions with inhibitors.
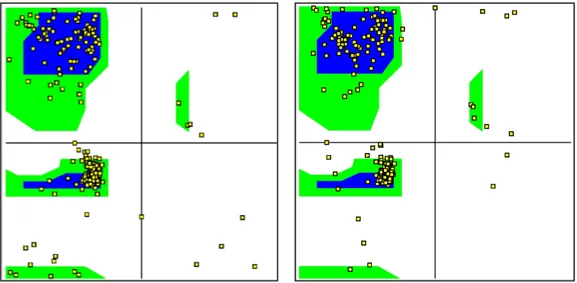
Below in the Table 6 are summarized Gibbs energies (∆G) obtained from the docking calculations, as well as experimental values found in the PubMed database [75]. The inhibitors are ranked according to the energy score. The results are reasonably in accordance with the experiment.
Asp263 3.30 Phe182 Tyr184 Lys199 His256 3.67 2.21 2.29
№ Inhibitor Calculated ∆G (kcal/mol) Experiment al ∆G (kcal/mol) 1 Telmisartan -11.20 -11.50 2 Azilsartan -9.02 -3 Irbesartan -8.63 -11.87 4 Eprosartan -8.62 -5 Olmesartan -8.19 -13.70 6 Candesartan -8.03 -11.6 7 Valsartan -7.84 -10.4 8 Losartan -7.80 -9.58
Table 6 – Ranking of the inhibitors by their Gibbs energy values.
The obtained results of the docking validate the docking protocol. And the same protocol can be used for further investigation.
Conclusions
In the current study insights for the design of novel drugs for hypertension were provided by applying computational chemistry approach. Homology Modelling was applied to create a model of the 3D structure of the AT1 receptor. The binding poses of Angiotensin II to this receptor, which is an actual cause of the high pressure in the organism, were determined using Molecular Docking. The docking protocol was validated by docking of several AT1 antagonists to the created model of the AT1 receptor. This protocol can be used in the future investigation of obtaining novel AT1 receptor blockers using Virtual Screening.
5. PROSPECTIVE FOR THE FUTURE
After the 3D structure of the target AT1 receptor was obtained through Homology Modelling technique and the protocol was validated with Molecular Docking, it is ready to be used in the next step of drug development – hit identification.
Hit identification – is a docking methodology, combined with a scoring function that can be used to quickly screen large databases of potential drugs in silico to identify molecules that could interact with a target, or have similar properties to known ligands, and become a promising hit or lead compound. Afterwards these presumed molecules can be synthesized, tested and optimized in the laboratory. These types of methodologies are commonly known as Virtual High Throughput Screening or simply Virtual Screening (VS). VS is revealed as an important tool in drug development of novel drugs. There is a wide range of methodological protocols available in screening databases for
![Fig. 5. Multiple sequence alignment between the target receptor AT1 and the template receptors, performed in CLUSTAL 2.1 [55].](https://thumb-eu.123doks.com/thumbv2/123dok_br/15237536.1022722/26.892.189.762.209.1110/multiple-sequence-alignment-receptor-template-receptors-performed-clustal.webp)