UNIVERSIDADE DE LISBOA
FACULDADE DE CIÊNCIAS
DEPARTAMENTO DE BIOLOGIA ANIMAL
Mauro Feliz da Silva
Dissertação
Mestrado em Biologia da Conservação
2012
Phylogeography and historical demography of Oceanodroma
castro and Oceanodroma monteiroi: contrasting anonymous
UNIVERSIDADE DE LISBOA
FACULDADE DE CIÊNCIAS
DEPARTAMENTO DE BIOLOGIA ANIMAL
Mauro Feliz da Silva
Dissertação orientada por Doutora Mónica Sérvulo Correia
Carneiro da Silva e Professora Doutora Maria Manuela Gomes
Coelho Noronha Trancoso
Mestrado em Biologia da Conservação
2012
Phylogeography and historical demography of Oceanodroma
castro and Oceanodroma monteiroi: contrasting anonymous
Summary
Phylogeography has proved to be a powerful tool for understanding the origin, dispersal and geographic structure of taxa over time and space based on the evolutionary genetic footprints left by historical processes.
Taking advantage of recent coalescent based methods, the phylogeography and historical demography of two Procellariiformes species, Oceanodroma castro (sampled from the Azores, Madeira, Galapagos and Japan) and Oceanodroma monteiroi (sampled from Azores), are studied using a multi-locus approach based on 12 nuclear anonymous loci and a previously surveyed mitochondrial locus (Control Region).
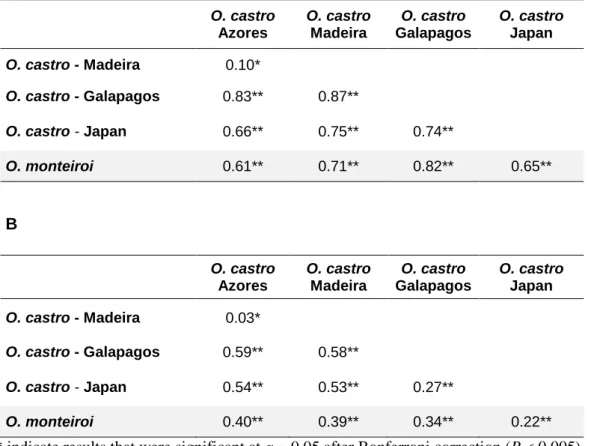
Despite lower structuring levels of the anonymous loci (ΦST nuclear= 0.43, P <
0.0001) relative to the Control Region (ΦST Control Region= 0.76, P < 0.0001), they were
informative and also suggested that all populations are genetically differentiated. Furthermore, the nuclear loci uncovered an ancestral relationship between O. castro population from Japan and O. monteiroi that was not detected by the mitochondrial locus.
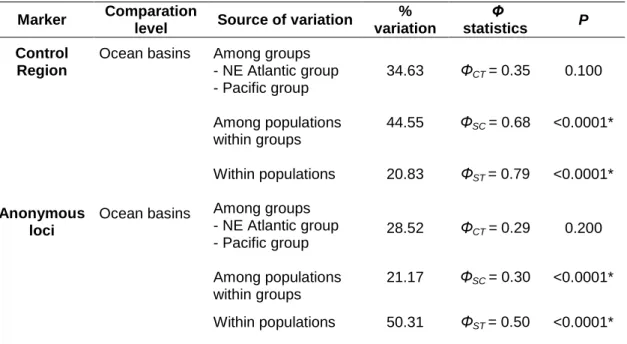
Multi-locus coalescent analyses suggested that all the divergence events (except between O. castro populations from NE Atlantic archipelagos) occurred within the Pleistocene. Significant levels of gene flow are unlikely to have occurred during the diversification process, even within ocean basins, supporting that factors other than geological barriers, such as paleo-oceanographical conditions, phylopatry and specialization to foraging/non-breeding areas, act as important mechanisms of population divergence in pelagic seabirds.
Considering the increasing threats affecting seabirds and the genetic uniqueness of each population, results from this work reinforce the importance of conservation efforts, not only directed to the nesting habitats, but also to the non-breeding areas of O. castro and O. monteiroi.
Keywords:
Phylogeography, Historical Demography, Multi-locus, Oceanodroma castro, Oceanodroma monteiroi, Conservation Genetics.Resumo
A filogeografia tem por objectivo explicar padrões de distribuição espaciais e temporais de linhagens genéticas de uma espécie ou de espécies filogeneticamente relacionadas. Por outras palavras, procura perceber que factores, físicos ou não, influenciaram ou influenciam a divergência das diferentes linhagens, identificadas e caracterizadas através da análise de marcadores moleculares que vão “registando” as alterações genéticas deixadas por esses eventos (Avise 2000).
Até há pouco tempo grande parte dos estudos filogeográficos eram realizados a partir de um único marcador: a molécula de DNA mitocondrial (mt). O mtDNA, por representar um efectivo populacional inferior ao efectivo representado por um locus autossomal nuclear, é um marcador muito útil, principalmente em casos de divergência recente, uma vez que as alterações genéticas que ocorrem ao longo da evolução são fixas muito mais rapidamente e, na ausência de fluxo genético, a variação entre populações é maximizada. No entanto, representa a variação equivalente a um só locus e reflecte apenas a demografia das fémeas (Avise 2000).
As análises single-locus acarretam ou podem acarretar problemas neste tipo de estudos. Cada locus tem uma assinatura genética particular e que, por essa razão, pode diferir de um locus para outro no caso de serem independentes. Consequentemente, a genealogia que deriva apenas de um único gene pode não reflectir a verdadeira história evolutiva de uma espécie ou de espécies filogeneticamente próximas entre si. A análise de vários genes independentes torna-se, portanto, essencial. Deste modo, a filogeografia tem-se expandindo no sentido de incorporar as análises multi-locus para complementar a informação obtida a partir do genoma mitocondrial e melhor caracterizar os processos evolutivos (Avise 2009).
As aves marinhas pelágicas (Procelariformes) constituem modelos de interesse para testar hipóteses relativas aos mecanismos de divergência populacional que originam os padrões filogeográficos observados no meio marinho. Se por um lado são espécies de grande capacidade dispersiva, por outro, tendem a ser filopátricas e a não sobrevoar terra. Apesar deste tipo de estudos ser comum em aves marinhas de latitudes elevadas, estudos com o objectivo de caracterizar e perceber os padrões de divergência histórica de aves marinhas tropicais e subtropicais são menos frequentes (Smith et al. 2007).
O Paínho da Madeira (Oceanodroma castro) é uma ave pertencente à ordem Procellariiformes que ocorre nas regiões tropicais e subtropicais dos oceanos Pacífico e Atlântico. Nidica em pequenos ilhéus localizados em diferentes arquipélagos, sendo que em alguns locais de nidificação, como no caso dos Azores, da Madeira e das Galápagos, existem duas populações a nidicar nos mesmos ilhéus, mas em alturas diferentes do ano. Fora do período reprodutor dispersam pelos oceanos à procura de alimento e, embora a sua distribuição nessas alturas seja maioritariamente desconhecida, esta parece depender fortemente da localização de locais de produtividade oceânica (Haney 1985).
Morfologicamente as diferentes populações parecem diferir ligeiramente (o que levou à discussão e proposta da existência de diferentes subespécies), enquanto que, geneticamente, estudos filogeográficos globais recentes baseados num locus mitoconodrial (Região de Controlo) e em microsatélites, revelaram que as populações dos diferentes arquipélagos se encontram diferenciadas entre si, sendo inclusivamente possível, diferenciar a maioria das populacões que ocorrem em simpatria (Smith et al. 2007; Friesen et al. 2007). Nos Açores, devido a pronunciadas diferenças genéticas, morfológicas e ao nível das vocalizações, as populações nidificantes no arquipélago durante o Verão foram classificadas como pertencentes a uma nova espécie: o Painho de Monteiro (Oceanodroma monteiroi) (Bolton et al. 2008).
Este trabalho tem como objectivo o estudo filogeográfico e demográfico de 4 populações O. castro (Azores, Madeira, Galápagos e Japão) e de uma população pertencente à espécie O. monteiroi, utilizando e comparando 12 loci nucleares anónimos e o locus mitocondrial, previamente analisado em estudos anteriores (Smith et al. 2007; Friesen et al. 2007). Mais especificamente visa a caracterização dos loci nucleares anónimos e identificação da estrutura populacional/grupos evolutivos por estes sugerida, procura inferir a história evolutiva das diferentes populações amostradas a partir da informação conjunta de todos os loci e determinar que importância têm os diferentes grupos em termos de conservação.
Através de análises de polimorfismo verificou-se que os loci anónimos têm, em média, 24 posições variáveis (correspondendo a aproximadamente 4 posições polimórficas a cada 100 pares de bases), existindo, no entanto, uma grande variação entre loci. Os níveis de diversidade genética médios (π = 0.0051±0.0003) são aproximadamente uma ordem de grandeza inferiores aos estimados para a Região de Controlo (π = 0.0408±0.0016), embora comparáveis aos encontrados em loci nucleares
anónimos isolados em outras espécies de aves (Jennings e Edwards 2005; Lee e Edwards 2008; Silva et al. 2011).
Atendendo às análises de estrutura populacional conclui-se que a variação que deriva dos loci nucleares anónimos sugere níveis de estrutura genética inferiores aos obtidos pela Região de Controlo (ΦST nuclear= 0.43, P < 0.0001, ΦST Região de Controlo= 0.76,
P < 0.0001), provavelmente devido ao reduzido polimorfismo de alguns loci e ao sorting de alelos ocorrer, duma forma geral, mais lentamente no genoma nuclear. No entanto, verificou-se que, tal como para o locus mitocondrial, todas as populações são diferenciadas geneticamente. Mais importante, os loci nucleares anónimos parecem indicar uma relação ancestral entre a população O. castro do Japão e O. monteiroi que já não está presente no locus mitocondrial, reforçando, desta forma, a importância da abordagem multi-locus e, em particular, da utilização de loci nucleares.
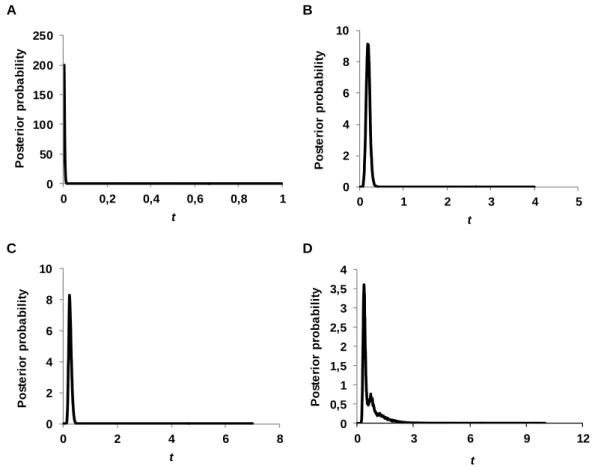
Através da análise conjunta de todos os loci estima-se que a maioria dos eventos de divergência tenham ocorrido durante o Pleistocénico (1.6 – 0.01 ma). A divergência entre o grupo de populações do Pacífico e o grupo do NE Atlântico (populações O. castro e O. monteiroi) terá sido a primeira a ocorrer. Posteriormente terá ocorrido a divergência das populações do Pacífico (Galápagos e Japão), assim como a da população O. monteiroi dentro do grupo do NE Atlântico. As populações O. castro dos Açores e Madeira parecem apenas ter divergido muito recentemente, após o fim da última glaciação (10 000 anos atrás). Apesar das estimativas dos tempos de divergência não serem precisas o suficiente para relacioná-las com os ciclos glaciares ou interglaciares do Pleistocénico, a ausência de alterações demográficas no passado (e.g. bottlenecks), parece suportar a hipótese das fases glaciares não terem sido tão dramáticas como foram para aves marinhas de elevadas latitudes. De facto, poderão até ter tido um efeito benéfico para aves de distribuição tropical e subtropical, uma vez que a redução do nível do mar e a maior ocorrência de zonas de produtividade oceânica associada às baixas temperaturas terão promovido o aumento de potenciais locais de nidificação, bem como de oportunidades de alimento (Smith et al. 2007).
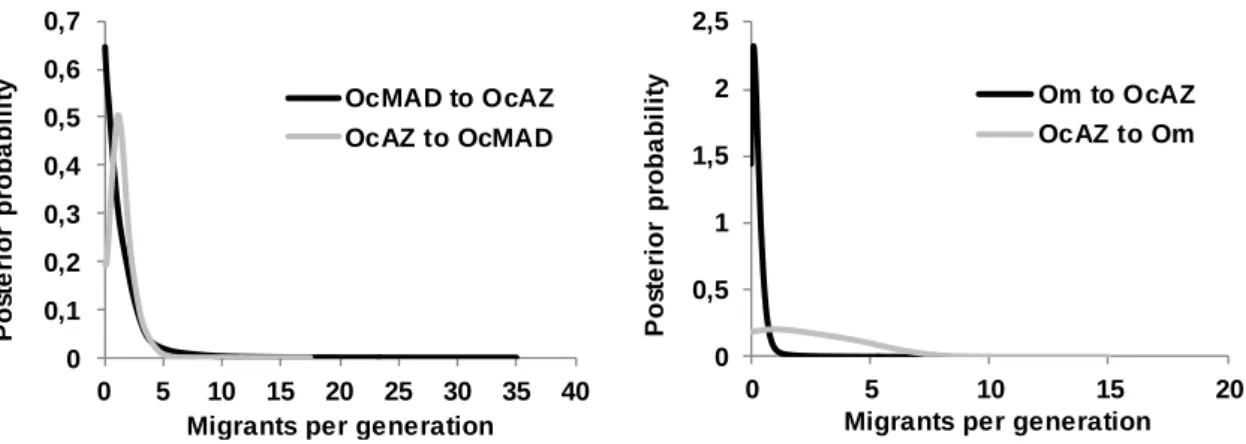
Segundo o modelo de Isolamento com Migração, implementado através do programa IMa2 (Hey e Nielsen 2007), o processo de divergência para a maioria das populações ocorreu na ausência de fluxo genético. A estrutura genética entre populações do mesmo oceano sugere que a existência de barreiras geológicas, nomeadamente o Istmo do Panamá, terá tido um papel secundário no processo de diferenciação e que
factores como a filopatria, a época de nidificação, a proximidade das diferentes colónias ou a dispersão específica para determinadas áreas dos oceanos fora do período reprodutor poderão ter sido, de facto, preponderantes (Smith et al. 2007).
Em termos de conservação e, segundo a estrutura populacional encontrada, é então sugerido que se considerem as populações O. castro do Pacífico como pertencentes a Unidades de Evolução Independentes (ESUs) (sensus Moritz 2004). As populações O. castro do NE Atlântico, devido à baixa diferenciação entre si e ao fluxo genético estimado, parecem ainda fazer parte do mesmo grupo evolutivo, pelo que as duas populações devem apenas ser tratadas como Unidades de Gestão (MUs) separadas.
Tendo em conta as crescentes ameaças que afectam as aves marinhas e, em particular, o impacto que têm no grupo dos Procelariformes, é crucial que medidas de conservação sejam aplicadas, não só ao nível dos habitats de nidificação, mas também das áreas de ocorrência fora do período reprodutor das populações. Especial atenção deve ser dada à espécie O. monteiroi, uma vez que é endémica do arquipélago dos Açores e que a discrepância entre o efectivo populacional estimado (~20 000 indivíduos) e os census realizados (~300 casais) parece suportar a existência da forte redução populacional descrita em Bolton et al. (2008), ocorrida muito recentemente.
Palavras-chave:
Filogeografia, Demografia Histórica, Multi-locus, Oceanodroma castro, Oceanodroma monteiroi, Genética da Conservação.Agradecimentos
Em primeiro lugar gostaria de agradecer à Doutora Mónica Silva. Agradeço por me ter aceite como seu orientando ao longo deste ano, mas principalmente pela dedicação, pela disponibilidade, pela ajuda, pela paciência e tolerância que sempre teve perante a minha inexperiência. Por tudo o que me ensinou. Por tudo o que fez para que a produção deste trabalho nunca estivesse comprometida.
Agradeço à Professora Manuela Coelho por também me ter aceite como seu orientando, pela disponibilidade para qualquer problema ou dúvida que tivesse e pelas sugestões que me deu. Agradeço a oportunidade de integrar o seu grupo e de poder expôr o meu trabalho nas reuniões que foram existindo ao longo do último ano.
Agradeço a todos os membros do grupo, do gabinete e do laboratório. Em especial à Maria Ana, à Ana Rita, aos Migueis, ao Tiago, à Isa, à Joana, à Angela, à Catarina Ginja e à Fátima que simpaticamente me aceitaram e integraram e, de uma forma ou de outra, contribuiram para a realização deste trabalho.
À minha mãe. Pela paciência em primeiro lugar e por me ter oferecido todas as condições para que pudesse estudar todos estes anos.
À minha tia, primos e avós pela a ajuda, presença e preocupação. A todos os meus amigos.
Contents
1. Preliminary note ... 1
2. Introduction ... 2
2.1 Phylogeography: single and multi-locus approaches ... 2
2.2 Mechanisms of population divergence in pelagic seabirds ... 3
2.3 Oceanodroma castro and Oceanodroma monteiroi ... 4
2.4 Conservation genetics ... 6
2.5 Aims ... 7
3. Methods ... 9
3.1 Sampling ... 9
3.2 DNA Extraction, amplification and sequencing of loci ... 9
3.3 Gametic phase determination ... 10
3.4 Polymorphism and neutrality analysis ... 12
3.5 Population genetic structure ... 12
3.5.1 Haplotype networks... 12
3.5.2 Clustering of nuclear genotypes by STRUCTURE ... 13
3.5.3 Pairwise comparisons of ΦST and analysis of molecular variance ... 13
3.6 Phylogenetic and evolutionary relationships ... 14
3.7 Coalescent estimates of gene flow, divergence times and population size based on the Isolation with Migration model ... 15
3.8 Demographic changes ... 15
4. Results ... 17
4.1 Polymorphism and neutrality analysis ... 17
4.2 Population genetic structure ... 21
4.2.1 Haplotype networks... 21
4.2.2 Clustering of nuclear genotypes by STRUCTURE ... 25
4.3 Phylogenetic and evolutionary relationships ... 30
4.4 Coalescent estimates of gene flow, divergence times and population size based on the Isolation with Migration model ... 32
5. Discussion ... 40
5.1 Genetic diversity of the nuclear anonymous loci ... 40
5.2 Multi-locus inference of the evolutionary groups ... 40
5.3 Evolutionary history of O. castro and O. monteiroi ... 41
5.4 Conservation implications ... 43
6. References ... 45
1
1. Preliminary note
This thesis is part of the FCT project “Comparative phylogeography and population demography in pelagic seabirds (Procellariiformes): insights from multiple loci in co-distributed species” (PTDC/BIA-BDE/65110/2006), which aims to provide a temporal perspective into the mechanisms of population divergence in Procellariiform seabirds and a better understanding of the effects of evolutionary processes on the levels of genetic diversity displayed by natural populations. It is expected to publish a scientific paper from the results obtained in this study.
2
2. Introduction
2.1 Phylogeography: single and multi-locus approaches
The field of phylogeography seeks to explain patterns of spatial and temporal distributions of genealogical lineages, especially those within and among closely related species (Avise 2000). In other words, it attempts to understand and interpret the extent and mode by which historical processes may have been shaping the divergence and spatial distribution of genetic lineages. Thus, the role of physical and non-physical barriers to gene flow that presently exist or existed in the past, such as the rise of a mountain range that separated lowland taxa, the limited dispersal ability of a species or the Pleistocene glaciations and climatic changes effects, are of special interest to phylogeographical studies (Avise 2000; Avise 2009). Phylogeography has proved to be a powerful tool for understanding the origin, dispersal and geographic structure of species over time and space based on the evolutionary footprints left over time by these processes on present-day molecular variation (Lee and Edwards 2008).
Until recently, animal mitochondrial (mt) DNA was the molecule of choice for examining evolutionary relationships at the population level and among closely related species (Avise 2000). Due to its smaller effective population size (1/4 of the effective population size of the autosomal nuclear DNA) mitochondrial loci will have, on average, a faster coalescence (but see Karl et al. 2012). The genetic differences will tend to become rapidly fixed and variation at the population level maximized, in the absence of the homogenizing power of gene flow (Avise 2000). However, mtDNA variation may not represent the genealogical patterns of an entire population, since it is only uniparentally inherited. More importantly, irrespective of the number of genes used, only one locus is effectively being sampled (Bermingham and Moritz 1998).
Each locus has a particular genetic signature and genealogical structure that can differ from those of other loci. Thus, the information derived from single locus analysis often leads to erroneous conclusions because its genealogy may not truly or completely reflect the real history of populations or species (Bermingham and Moritz 1998; Avise 2009). Although mtDNA loci are a powerful tool for genealogical and evolutionary
3 studies, genealogical data from multiple independent loci are essential to separate the effects of selection and demography on the patterns of sequence variation, but also to get closer to the real estimates of population parameters (Edwards and Beerli 2000; Zink and Barrowclough 2008; Brito and Edwards 2009).
The potential discrepancy between single and multi-locus analyses has been known for decades (Heled and Drummond 2010). With the emerging power of genomics and the development of increasingly powerful coalescent-based methods, which allowed combining information from multiple genes, phylogeography has been expanded in order to take into account multi-locus analyses, especially those from the nuclear genome (Jennings and Edwards 2005).
Despite the technical and biological hurdles associated to the autosomal nuclear genome (Avise 2009), several phylogeographic studies have used different nuclear markers, such as intron sequences or microsatellites to trace and compare genealogical patterns with those derived from the mitochondrial marker (e.g. Friesen et al. 2007a; Welch et al. 2011). Anonymous nuclear loci, non-coding DNA segments, randomly isolated from the nuclear genome, have received much less attention as a molecular marker, even though they represent a cost effective solution for phylogeographic studies of non-model species (Jennings and Edwards 2005; Lee and Edwards 2008; Silva et al. 2011). Presumably dispersed across the chromosomes, thereby representing wide and potentially unbiased variation across the genome (which may not be true for other nuclear markers, such as introns or microsatellites), they provide multiple and independent replicates of gene genealogies that are used to infer population histories, and, consequently, a better understanding of the events that possibly lead to speciation.
2.2 Mechanisms of population divergence in pelagic seabirds
Although physical barriers are scarce in the marine environment, land masses appear to be an effective barrier to gene flow for many seabird species, since most of them avoid flying over land (Warham 1990). The emergence of the Isthmus of Panama, which isolated Pacific and Atlantic oceans approximately 3 million years ago, appears to be a major physical barrier to gene flow of many tropical marine taxa (Steeves et al. 2005a; Morris-Pocock et al. 2011).
4 In addition, large scale climate oscillations, such as those that characterized the more recent Pleistocene glacial cycles, have influenced the contemporary intraspecific diversity of high latitude seabirds (Congdon et al. 2000). Since many species experienced severe range contractions during glacial cycles, with populations restricted to a few small and isolated refugia during glacial maxima, contemporary population structure may reflect these past historical associations (e.g. Peters et al. 2005; but see Klicka and Zink 1997).
However, genetic structure of pelagic seabirds’ populations can also occur in the absence of obvious physical barriers to gene flow. Large tracts of island-less water, such as the Eastern Pacific Basin, or ocean currents, as the presumably inhospitable cold water Benguela current, could act as marine barriers that effectively restrict gene flow in some pelagic tropical seabirds (Steeves et al. 2005b; Morris-Pocock et al. 2011). Behavioral or ecological characteristics, such as natal philopatry and habitat specialization could also be acting as effective non-physical barriers (Smith et al. 2007; Welch et al. 2011). For example, seabird species with population-specific non-breeding distributions are more likely to show genetic structure than species in which all populations associate together during the non-breeding season (Steeves et al. 2005b).
The order Procellariiformes, comprising albatrosses, petrels and shearwaters, storm petrels, and diving petrels, are a group of pelagic seabirds of special interest to test hypotheses concerning the mechanisms of population divergence that give rise to the phylogeographic patterns observed in the marine environment. They are typically strong flyers and can disperse long distances over the oceans, so that high levels of gene flow might be expected among colonies. However a wide range of pelagic seabird species show significant population genetic structure suggesting that, despite their high vagility, different kinds of barriers to dispersal, physical and/or behavioral, have been influencing the divergence process of pelagic seabirds’ populations (Weimerskirch 1998; Friesen 2007).
2.3 Oceanodroma castro and Oceanodroma monteiroi
The Madeiran storm-petrel Oceanodroma castro is a small Procellariiform seabird that has been the focus of recent phylogeographic studies and taxonomic
5 investigations (Smith et al. 2007; Friesen et al. 2007a; Bolton et al. 2008; Howell et al. 2010).
This extremely mobile, highly pelagic seabird shows a widespread tropical and sub-tropical distribution in both the Atlantic and Pacific Oceans. Individuals breed colonially on isolated oceanic islands or islets of Japan, Hawaii, Galapagos and Northeast (NE) and Central Atlantic archipelagos (Azores, Madeira, Canaries, Cape Verde, Santa Helena and Ascension), nesting in rock crevices and burrows (Smith et al. 2007). Outside the breeding season, they tend to disperse across the oceans, but their non-breeding distribution is currently unknown for most populations (Bolton et al. 2008). They exhibit a marked affinity for centers of localized upwelling and eddies (Haney 1985). The high phytoplankton biomass of these areas provide zooplankton and nekton, including small myctophid fish, squid, amphipods, and euphausiids, that mostly comprise the diet of Madeiran Storm-Petrels (Haney 1985; Warham 1990). They are phylopatric, tending to return, each year, to their natal colony to breed (Smith et al. 2007; Friesen et al. 2007a; Bolton et al. 2008).
Interestingly, the breeding phenology can vary significantly among colonies. For example, while for the Japanese population the breeding period is unique and compact, occurring only in the summer months, in the Cape Verde colonies it is much more protracted, occurring during the entire year. On the other hand, in the Azores, Madeira, and Galapagos archipelagos, there are two populations nesting in the same islets, even in the same burrows, but at different times of the year. The presence of these temporal segregated populations aroused a great interest in the study of this species, which represents one of the few known cases of sympatric speciation by allochrony (Friesen et al. 2007a; Smith and Friesen 2007; Bolton et al. 2008).
Madeiran Storm-Petrels show considerable geographic variation in several morphological characters, such as bill, wing morphology and rump colouration, and vocalizations, leading researchers to propose the recognition of different sub-species (Smith et al. 2007; Howell et al. 2010). Recent global phylogeographic studies based on the fast evolving mitochondrial locus Control Region (CR) and microsatellites loci (Smith et al. 2007; Friesen et al. 2007a) revealed significant genetic structure and absence of gene flow among most of the populations nesting on different archipelagos. Furthermore, these studies revealed also that sympatric populations of most archipelagos were already genetically distinct. However, while in the Galapagos and
6 Madeira archipelagos sympatric populations appear to be at the initial stages of speciation, the Azores summer nesting populations, due to significant genetic differentiation, and pronounced morphological and vocalizations differences, were classified as a new species, the Monteiro’s Storm-petrel Oceanodroma monteiroi (Bolton et al. 2008).
2.4 Conservation genetics
The description of each population’s genetic uniqueness and the understanding of the mechanisms by which populations diverge are extremely relevant for the design and effectiveness of conservation plans applied to a given species. If populations differ genetically, loss of a population may result in loss of some of the species’ genetic variation, including local adaptations (e.g. timing of breeding), cryptic species (species that are difficult for humans to differentiate), and the species ability to adapt, evolve and speciate. In addition, because the degree of genetic divergence between populations is inversely related to the amount of gene flow, populations that differ genetically may not recolonize naturally following a local decline or extirpation (Friesen 2007; Taylor and Friesen 2012).
Thus, phylogeography studies are of special importance to species conservation, since they contribute to the genetic characterization of populations, as well as the understanding of the mechanisms by which they diverge, providing also information about colony demographics. Specifically, these studies can contribute to the identification of Evolutionary Significant Units (ESUs) and Management Units (MUs) (sensus Moritz 2004). ESUs are composed of highly genetically differentiated populations. They represent the most important elements of intra-specific diversity and should be preserved as independent units. In contrast, MUs comprise populations that diverged more recently and between which gene flow might still occur. There is no need to preserve them as independent units, so they can be treated together as a single cluster. Although the global conservation status of the Madeiran storm petrel is considered to be of Least Concern (IUCN Red List), the order Procellariiformes has one the fastest extinction rates among avian species (Croxall et al. 2012). The major causes responsible for the sharp decline of many populations are of anthropogenic origin.
7 Introduction of alien predators on nesting colonies, such as dogs, cats or rats is of special concern because most species are burrow nesters, and are vulnerable to predation when on the ground (Silva et al. 2011). The disturbance caused by human activities, resulting in the loss of nesting habitat, the increasing marine pollution and the accidental bycatch captures in fishing gear are cited as others factors with a significant contribution to the increased mortality of pelagic seabirds (Pimm et al. 2006; Croxall et al. 2012). In addition, especially for small Procellariforms, natural factors, such as the late sexual maturation, the laying of a single egg, the presence of natural predators (e.g. the gull Larus cachinnans or the Long-eared owls Asio otus) or the natural disadvantage in the competition with other species for nesting habitat (e.g. Cory’s shearwater Calonectris diomedea has been documented killing adult Madeiran storm petrels and other storm petrels for use of the occupied nest burrows), potentiate the likelihood of species decline (Warham 1990; Bolton 2004; Bolton et al. 2008).
Furthermore, most species are restricted to islands, and often show significant genetic differentiation over their distribution range (Friesen et al. 2007b). Consequently, conservation and management strategies targeting this group should take into consideration levels of genetic variation and isolation of the different populations to preserve biological diversity and the adaptive potential of species. In this context, phylogeographic studies provide crucial information towards this goal by describing the patterns of geographical distribution of allelic lineages and estimating relevant demographic parameters, such as gene flow and effective population sizes.
2.5 Aims
The main goal of this thesis is to study the phylogeography and population demographics of two Procellariiformes species (Oceanodroma castro and Oceandroma monteiroi) using a multi-locus approach based on 12 nuclear anonymous loci and a previously surveyed mitochondrial locus (Control Region).
Specifically this study aims to 1) characterize the genetic diversity of markers in the nuclear genome; 2) identify the evolutionary groups defined by the nuclear data set and compare them to the structure suggested by the mitochondrial locus; 3) reconstruct the species tree for this group; 4) identify and discuss the role of physical or
non-8 physical barriers on the divergence of these taxa based on estimates of historical and contemporary population parameters; 5) determine the importance of the different groups in terms of conservation based on the genetic findings.
9
3. Methods
3.1 Sampling
Sampling was planned considering the distribution range of the group and the location of the major physical barrier to gene flow between Pacific and Atlantic Oceans for tropical and subtropical seabirds (the Isthmus of Panama). As such, 95 O. castro samples were used from four different populations on either side of the Isthmus (Appendix Figure 1): 23 blood samples from the Azores (Ilhéu da Praia); 27 blood samples from Madeira (Selvagem Grande I, summer population); 20 samples from the Eastern coast of Japan; 25 blood samples from the Galapagos (Plaza Norte, cool season population). Additionally, 20 blood samples of O. monteiroi (Ilhéu da Praia) were also used, resulting in a final dataset of 115 samples.
NE Atlantic Ocean individuals sampling consisted in the capture of chicks in their nests during the breeding season. A sample of 50-100 ml of blood was taken from the brachial vein with a capillary tube, and stored at room temperature in Seutin’s solution,which prevents the enzymatic degradation of DNA. After the blood collection, individuals were banded to avoid re-sampling. The capture of chicks was carried out during the day, to avoid the disturbance of adults, since most of them were feeding at sea. Sampling of the Pacific populations followed a similar methodology (Smith et al. 2007).
3.2 DNA Extraction, amplification and sequencing of loci
Total genomic DNA of each sample was extracted with a standard phenol-chloroform protocol adapted from Sambrook et al. (1989). The samples from Galapagos were extracted with a DNeasy extraction kit (QIAGEN), following a protocol specific for nucleated blood cells. DNA samples were ressuspended in ddH2O and stored at -20°C.
The twelve anonymous loci were subsequently amplified through polymerase chain reaction (PCR) for each sample. These loci had been previously isolated, and
10 locus-specific primers were designed and optimized in advance (Silva et al. 2012). Amplifications were carried out under optimized conditions in 25 µl reactions, containing ~100 ng DNA, and final concentrations of 0.5 U of GoTaq® Flexi DNA Polymerase (Promega), 1X Green GoTaq® Flexi buffer, 0.2 mM dNTP, 1.5 mM of MgCl2 and 0.3 µM of each primer. The thermal profiles included 5 min of initial denaturation at 95°C followed by 35 cycles of (30s at 95°C + 30s at 60°C to 64°C + 45s at 72°C) and a final extension step of 10 min at 72°C. PCR products were subjected to electrophoresis in 1% agarose gels to confirm the success of amplifications and subsequently purified through EXO-SAP method, an enzymatic clean-up process under the following conditions: 2.5 µl of 10X Shrimp Alkaline Phosphatase (SAP) buffer, 1 µl of SAP and 0.5 µl of Exonuclease I per PCR product at 37°C for 30 min, 80°C for 15 min and 12°C for 5 min. Purified PCR products were sequenced in both directions in outsourcing (Macrogen Inc).
The mitochondrial locus Control Region was amplified in house only for the Madeira samples, using primers and conditions described in Smith et al. (2007). Sequences for the remaining populations were obtained from GenBank and added to a final mitochondrial data set.
All sequences were aligned and edited using Sequencher 4.2a (Gene Codes). For the nuclear loci, since the two alleles of each locus are amplified simultaneously, heterozygous sites are represented by double peaks (generally reduced in height relative to adjacent homozygous positions) in the resulting chromatograms. Thus, forward and reverse sequences were analyzed by eye and edited as necessary to ensure that all double peaks were correctly identified and labeled with standard degenerate codes (e.g. Y = C or T). Individuals were removed from the dataset if heterozygous positions could not be determined with confidence at least in one of the two directions. Insertions and deletions (indels) were removed from the final datasets because they are not considered by some of the software packages. Nevertheless, alleles of different length (length-variant heterozygotes) for some loci were used in allele phasing (see below).
11 The most significant hurdle in the analysis of nuclear sequences is the uncertainty of the gametic phase when multiple polymorphisms are present in heterozygous individuals. If individuals are homozygous or carry alleles that differ at a single position, each allele sequence at a given locus can be unambiguously identified from direct sequencing of PCR products. It is not possible, however, to determine directly the gametic phase of nucleotides across two or more variable positions based on only sequence data for a given individual (Harrigan et al. 2008).
Accordingly, several approaches were followed to determine the phase of the alleles. PHASE v2.1.1 software (Stephens et al. 2001; Stephens and Scheet 2005), a software program that implements a Bayesian statistical method for reconstructing alleles from population genotype data, was used to probabilistically determine the gametic phase of each individual. Since the model with recombination was used, the program was first run to estimate the most appropriate recombination value for each locus using initially default values for the recombination parameter. Hereupon, PHASE was run for each locus with 1000 iterations, thinning interval of 10, a burn in of 100 and the respective estimated recombination value updated between successive runs. The length of the final run of the algorithm was increased 10-fold and the algorithm was repeated 3 times for each run. PHASE input/output files were generated with the SeqPhase software (Flot 2010).
The PCR products of 48 individuals, all of which had alleles poorly resolved by PHASE, i.e. the posterior probability of the most likely allele pair was less than 0.80 (Harrigan et al. 2008), were also cloned with the TOPO TA Cloning Kit for Sequencing (Invitrogen) following the manufacturer’s instructions. Positive transformant colonies were picked and cultured overnight at 37ºC in Luria-Bertani medium containing 100 µM of Ampicillin. The plasmid DNA was isolated using the QIA prep spin Miniprep kit (QIAGEN) and amplifications were carried out under similar PCR conditions as described above, but with an annealing temperature of 52ºC and specific primers annealing to the TOPO vector. PCR products were confirmed again in 1% agarose gels, purified following the EXO-SAP method and sequenced in both directions in outsourcing (Macrogen Inc). Between 2 and 7 clones were sequenced per PCR product to recover the two alleles of each sample.
Additionally, phase determination was also done for length variant heterozygotes individuals with more than one segregating site, following the method
12 proposed by Flot et al. (2006). This method determines the phase by examining both forward and reverse sequences of an individual and taking advantage of the offset peaks downstream of the indel in each direction. Only sequences with one indel were considered for this method, since individuals with allele differences caused by the presence of two or more indels were too complex and laborious to phase. Each single polymorphic position for each individual was then determined manually or through Champuru v1.0 software (Flot. 2007).
Finally, PHASE was run again using the same settings described above, but using an input file with the known allele phases (determined through cloning or the length variant method). Individuals for which the posterior probability of the best allele pair remained less than 0.80 were excluded from the dataset (Harrigan et al. 2008).
3.4 Polymorphism and neutrality analysis
In order to describe the genetic diversity of the nuclear anonymous loci and CR locus, summary statistics were calculated using DNAsp v5.10.00 software (Librado and Rozas 2009). For each locus, the number of segregating sites, the number of haplotypes, the haplotype diversity and nucleotide diversity were estimated for all loci.
The Tajima’s D neutrality test (Tajima 1989), a statistical test based on the analysis of the patterns of DNA polymorphism, was performed for each locus in Arlequin v.311 (Excoffier et al. 2005) with a significance level of 0.05.
3.5 Population genetic structure
3.5.1 Haplotype networks
Genealogical relationships among haplotypes were inferred for each nuclear anonymous locus and for the mitochondrial CR locus through median-joining networks as implemented in Network v.4.6.1.0 (Bandelt et al. 1999). Because this method (and the remaining population genetic analyses) does not contemplate intra-locus recombination, the largest non-recombining blocks of DNA sequence were identified
13 for each locus, using the IMgc software (Woerner et al. 2007). IMgc was run giving more weight to the retention of segregating sites over individuals.
3.5.2 Clustering of nuclear genotypes by STRUCTURE
To detect differentiated clusters (K) without defining populations a priori, a Bayesian clustering analysis implemented in STRUCTURE v.2.3.1 (Pritchard et al. 2000; Falush et al. 2003) was performed, using only the nuclear anonymous loci. The sequence data were converted to a single nucleotide polymorphism formatted data set, and analysis used the admixture model with uncorrelated allele frequencies. Alternative models of population structure were tested with K values ranging from K = 1, or no population structure, to K = 6 (one more than the total number of sampled populations), with all population being completely differentiated from each other. 10 runs were performed for every K value, each run consisting of 100 000 generations, with 10 000 generations discarded as burn-in. The value of K that best fit the data was inferred by estimating ΔK, as suggested by Evanno et al. (2005), using the STRUCTURE Harvester program (Earl and vonHoldt 2012). Structure was re-run to test if substructure existed in the genetic clusters suggested by the program.
3.5.3 Pairwise comparisons of ΦST and analysis of molecular variance
The analysis of population genetic structure was also investigated using pairwise comparisons of ΦST, and through the analysis of molecular variance (AMOVA,
Excoffier et al. 1992) as implemented in Arlequin v3.11.
ΦST is a fixation index (Nei 1973) that incorporates both haplotype frequencies
and the genetic distances between alleles to detect population genetic structure. Pairwise ΦST comparisons were calculated among populations using pairwise differences as the
genetic distance measure. The significance was tested with 10 000 permutations and considering a significance level of 0.05, after Bonferroni corrections (Rice 1989).
The AMOVA, which is also based on analyses of variance of gene frequencies and takes into account the distance between molecular haplotypes, was performed to partition the total sequence variation present in the dataset in different hierarchical
14 levels: among Pacific and NE Atlantic groups, among population within oceans and within populations. Pairwise differences were also selected as the measure of genetic distance between haplotypes and significance of the fixation indices (ΦSC, ΦST and ΦCT)
were estimated as for pairwise ΦST comparisons. Both pairwise ΦST and AMOVA
analyses were conducted for the mitochondrial locus individually and for the concatenated nuclear anonymous dataset. Concatenation was performed randomly among alleles, using MESQUITE v.2.75 (Maddison and Maddison 2011).
3.6 Phylogenetic and evolutionary relationships
*BEAST (Heled and Drummond 2010), an algorithm implemented in the software BEAST v1.6.1 (Drummond and Rambaut 2007), was used to estimate a species tree for the five populations sampled. This approach considers the genealogies of the different loci included in the analysis, i.e. coestimates multiple gene trees from multiple individuals per species, to estimate the tree of species relationships (Degnan and Rosenberg 2009).
*BEAST analyses were performed on a data set with all the loci and a subset with only the nuclear loci, so that it was possible to estimate the relative weight of the mitochondrial locus on the analysis.In the first case, the mutation rate considered was 0.105 substitutions/site/million years (Quinn 1992), whereas the nuclear mutation rate used was 3.6×10⁻³ substitutions⁄site ⁄million years (Axelsson et al. 2004).
In each analysis, *BEAST was run for 1.5 billion generations, with samples recorded every 100 000th generation after a burn-in of150 million of generations. The Yule speciation prior and a strict molecular clock were used for all *BEAST analyses and the substitution model applied was the HKY model (Hasegawa et al. 1985) for all the nuclear loci and the GTR+I+G model (Yang 1994) for the Control Region locus. Since not all models of sequence evolution are available in BEAST, the most approximate to the ones suggested by jModeltest (Posada 2008) for each locus was chosen. Each run was replicated (varying only the seed number) to verify that the Markov Chain Monte Carlo (MCMC) sampling process converged to the same stationary distribution, which was analyzed using TRACER v.1.5
15 *BEAST, the maximum credibility tree that best represented the posterior distribution (identified by Tree Annotator) was visualized and edited with FigTree v.1.3.1 (http://tree.bio.ed.ac.uk/software/figtree/).
3.7 Coalescent estimates of gene flow, divergence times and population
size based on the Isolation with Migration model
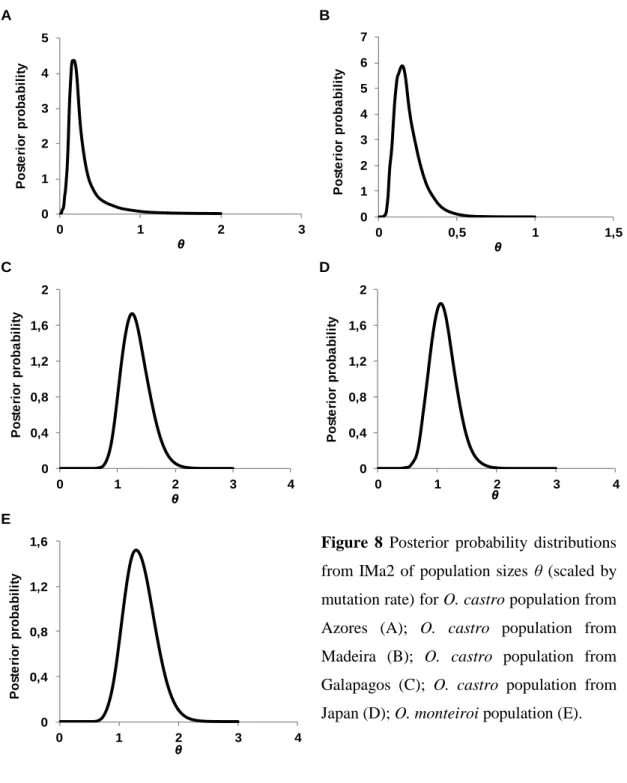
IMa2 is a program that extends the method of Hey and Nielsen (2007) to two or more populations. It implements a coalescent-based method that uses MCMC sampling of gene genealogies to estimate population parameters scaled by mutation rate µ, such as divergence time t (t = Tµ, where T is the time since divergence in years), population size θ (θ = 4Neµ [for a nuclear locus] or θ = 2Neµ [for a mitochondrial locus], where Ne
is the effective population size) and gene flow m (m = M/µ, where Mis the effective female immigration rate). This method is particularly appropriate for cases of recent divergences, since it does not assume mutation-drift-migration equilibrium, and thus allele sharing may be due to either gene flow and/or incomplete lineage sorting (Hey and Nielsen 2007).
Using all loci, initial runs were conducted with general priors (estimated following the IMa2 documentation) and varying the MCMC length and heating schemes to optimize priors and to test for convergence among analyses. The mutation rate used was determined by the product of the average sequence length of the nuclear anonymous loci by 3.6×10⁻⁹ substitutions⁄site⁄years (Axelsson et al. 2004). To translate parameter estimates of the IMa2 analyses to demographic values, biologically more meaningful, it was also considered a generation time of 12 years (Smith et al. 2007). IMa2 final runs had at least 4 million generations (samples recorded every 100th generation) with the first 100 000 generations discarded as burn-in, and a minimum of 40 Metropolis-coupled chains running simultaneously to improve mixing. The final run was replicated to ensure convergence. Trend plots, swap rates and Effective Sample Size (ESS) values and were used to assess mixing and convergence.
16 The Tajima´s D neutrality test assumes equilibrium and the presence of random mating. Therefore, a significant deviation of D from 0 does not necessarily mean that the neutral theory is not applicable (Tajima 1993), but factors/natural forces other than selection (population expansion, bottleneck, heterogeneity of mutation rates) could have been modeling the patterns of DNA polymorphism. Thus this test was used for all population and loci to detect possible demographic changes. The Fu’s Fs neutrality test was also performed for all loci and populations (Fu 1997). Although it also tests the neutral mutation hypothesis, it is very sensitive to population demographic expansion, which generally leads to large negative Fs values.
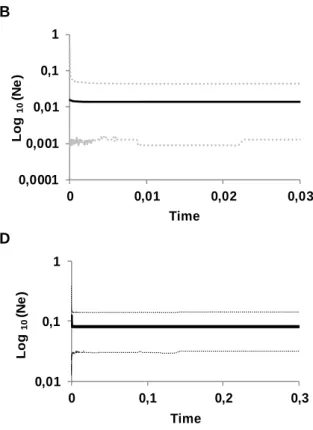
In addition, the population demography through time was investigated for each population with the Extended Bayesian Skyline Plots (Heled and Drummond 2008) implemented in BEAST v1.6.1 (Drummond and Rambaut 2007). This approach uses the differences in coalescence times among lineages to estimate population size changes through time. The analysis used all the loci with the same mutation rate and models of substitution that were used in estimating the species tree. The MCMC was run for 100 million generations, with samples recorded every 10 000th generation after a burn-in of 10 million of generations. As before, runs’ quality was monitored using TRACER v.1.5
17
4. Results
4.1 Polymorphism and neutrality analysis
Genomic DNA was successfully extracted from all blood samples used in this study. Amplification success of each nuclear anonymous locus was also very high for most individuals, varying between 80% and 100% (Appendix Figure 2). Despite the uncertainty of allele phasing, low sequence quality and the presence of multiple indels in a sequence which reduced the final dataset, each anonymous locus was amplified in up to 115 individuals, to a total of 7501bp sequenced per individual.
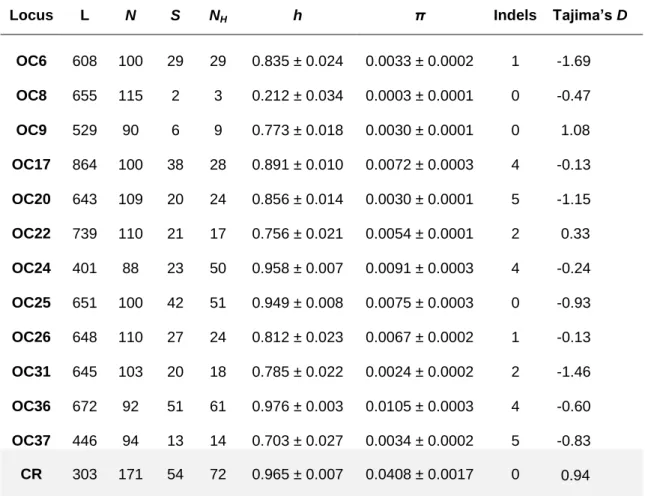
The anonymous loci had, on average, 24 polymorphic sites (corresponding to a frequency of, approximately, 4 single nucleotide polymorphisms (SNP) per ~100 bp). Indels with an average size of 4 nucleotides (median of 2) were found in most of the nuclear loci (Table 1). However, levels of genetic polymorphism varied significantly across loci. The locus OC8 was the less polymorphic locus with only 2 segregating sites (S) and 3 unique haplotypes. OC36, on the other hand, was the most variable locus, with 51 segregating sites defining 61 different haplotypes. Consequently, the haplotype diversity (h) range was very wide among the nuclear loci, varying from h = 0.212±0.034 to h = 0.976±0.003. The maximum value of haplotype diversity in locus OC36 was even comparable to that estimated for the rapidly evolving Control Region locus (h = 0.965±0.007).
Overall, the mitochondrial locus was the most polymorphic, with the highest number of segregating sites (S = 54) and haplotypes (72 haplotypes), as well as the highest nucleotide diversity (π = 0.0408±0.0016), which was almost an order of magnitude higher than the average anonymous nucleotide diversity (π = 0.0051±0.0003, Table 1 and Figure 1).
The overall values of Tajima’s D were negative for some loci and positive for others, but in neither case were they significantly different from zero, indicating no statistical departure from neutral expectations (Table 1).
18
Table 1 Summary statistics for the twelve nuclear anonymous loci and the mitochondrial
Control Region locus (CR). L is the locus length (bp), N the number of individual samples, S the number of segregating sites, NH the number of haplotypes, h the haplotype diversity and π the
nucleotide diversity.
None of the Tajima’s D values were significant at a P < 0.05 level.
Figure 1 Nucleotide diversity (π) of each anonymous locus and Control Region. Dotted line
shows the mean nucleotide diversity of the anonymous loci. Error bars represent units of standard deviation.
Locus L N S NH h π Indels Tajima’s D
OC6 608 100 29 29 0.835 ± 0.024 0.0033 ± 0.0002 1 -1.69 OC8 655 115 2 3 0.212 ± 0.034 0.0003 ± 0.0001 0 -0.47 OC9 529 90 6 9 0.773 ± 0.018 0.0030 ± 0.0001 0 1.08 OC17 864 100 38 28 0.891 ± 0.010 0.0072 ± 0.0003 4 -0.13 OC20 643 109 20 24 0.856 ± 0.014 0.0030 ± 0.0001 5 -1.15 OC22 739 110 21 17 0.756 ± 0.021 0.0054 ± 0.0001 2 0.33 OC24 401 88 23 50 0.958 ± 0.007 0.0091 ± 0.0003 4 -0.24 OC25 651 100 42 51 0.949 ± 0.008 0.0075 ± 0.0003 0 -0.93 OC26 648 110 27 24 0.812 ± 0.023 0.0067 ± 0.0002 1 -0.13 OC31 645 103 20 18 0.785 ± 0.022 0.0024 ± 0.0002 2 -1.46 OC36 672 92 51 61 0.976 ± 0.003 0.0105 ± 0.0003 4 -0.60 OC37 446 94 13 14 0.703 ± 0.027 0.0034 ± 0.0002 5 -0.83 CR 303 171 54 72 0.965 ± 0.007 0.0408 ± 0.0017 0 0.94
19 When the indices of genetic diversity h and π were estimated for each population separately (Table 2), the two O. castro population from NE Atlantic archipelagos (Azores and Madeira) had consistently the lowest levels of genetic diversity for several of the analyzed loci. Conversely, O. monteiroi had higher levels of diversity for approximately half the nuclear loci.
Table 2 Indices of genetic diversity for each species/population. N is the number of individual
samples, h the haplotype diversity and π the nucleotide diversity.
Locus Species/Population N h π O. castro - Azores 21 0.753 ± 0.047 0.0024 ± 0.0003 OC6 O. castro - Madeira 26 0.454 ± 0.070 0.0008 ± 0.0002 O. castro - Galapagos 17 0.859 ± 0.034 0.0036 ± 0.0004 O. castro - Japan 18 0.857 ± 0.029 0.0045 ± 0.0004 O. monteiroi 18 0.911 ± 0.025 0.0041 ± 0.0004 O. castro - Azores 23 0 0 OC8 O. castro - Madeira 27 0 0 O. castro - Galapagos 25 0.318 ± 0.080 0.0005 ± 0.0001 O. castro - Japan 20 0.508 ± 0.024 0.0008 ± 0.0000 O. monteiroi 20 0 0 O. castro - Azores 16 0.621 ± 0.053 0.0029 ± 0.0001 OC9 O. castro - Madeira 21 0.512 ± 0.017 0.0029 ± 0.0001 O. castro - Galapagos 18 0.802 ± 0.035 0.0026 ± 0.0003 O. castro - Japan 18 0.603 ± 0.044 0.0014 ± 0.0002 O. monteiroi 17 0.749 ± 0.043 0.0021 ± 0.0002 O. castro - Azores 22 0.749 ± 0.033 0.0013 ± 0.0001 OC17 O. castro - Madeira 26 0.759 ± 0.033 0.0020 ± 0.0004 O. castro - Galapagos 22 0.605 ± 0.079 0.0023 ± 0.0008 O. castro - Japan 17 0.818 ± 0.037 0.0075 ± 0.0003 O. monteiroi 13 0.843 ± 0.051 0.0053 ± 0.0006 O. castro - Azores 22 0.688 ± 0.042 0.0024 ± 0.0002 OC20 O. castro - Madeira 27 0.679 ± 0.045 0.0023 ± 0.0002 O. castro - Galapagos 22 0.837 ± 0.029 0.0022 ± 0.0002 O. castro - Japan 19 0.856 ± 0.031 0.0029 ± 0.0002 O. monteiroi 19 0.881 ± 0.021 0.0037 ± 0.0003 O. castro - Azores 23 0.204 ± 0.077 0.0003 ± 0.0001 OC22 O. castro - Madeira 27 0.324 ± 0.076 0.0005 ± 0.0001 O. castro - Galapagos 22 0.569 ± 0.068 0.0036 ± 0.0004 O. castro - Japan 20 0.545 ± 0.058 0.0014 ± 0.0004 O. monteiroi 18 0.825 ± 0.035 0.0052 ± 0.0004
20
Table 2 (continued).
Locus Species/Population N h π
O. castro - Azores 22 0.879 ± 0.028 0.0058 ± 0.0005
O. castro - Madeira 26 0.861 ± 0.025 0.0069 ± 0.0003
OC24 O. castro - Galapagos 17 0.929 ± 0.024 0.0065 ± 0.0004
O. castro - Japan 13 0.874 ± 0.057 0.0066 ± 0.0008 O. monteiroi 10 0.932 ± 0.033 0.0106 ± 0.0010 O. castro - Azores 22 0.761 ± 0.057 0.0035 ± 0.0004 OC25 O. castro - Madeira 23 0.809 ± 0.035 0.0047 ± 0.0005 O. castro - Galapagos 21 0.882 ± 0.031 0.0069 ± 0.0008 O. castro - Japan 17 0.818 ± 0.035 0.0045 ± 0.0004 O. monteiroi 17 0.955 ± 0.016 0.0083 ± 0.0004 O. castro - Azores 23 0.198 ± 0.072 0.0015 ± 0.0006 OC26 O. castro - Madeira 27 0.377 ± 0.076 0.0011 ± 0.0004 O. castro - Galapagos 24 0.688 ± 0.062 0.0041 ± 0.0005 O. castro - Japan 19 0.679 ± 0.066 0.0043 ± 0.0007 O. monteiroi 17 0.866 ± 0.031 0.0067 ± 0.0004 O. castro - Azores 23 0.605 ± 0.065 0.0013 ± 0.0002 OC31 O. castro - Madeira 23 0.432 ± 0.081 0.0011 ± 0.0003 O. castro - Galapagos 23 0.573 ± 0.065 0.0020 ± 0.0005 O. castro - Japan 16 0.748 ± 0.056 0.0021 ± 0.0003 O. monteiroi 18 0.673 ± 0.080 0.0025 ± 0.0004 O. castro - Azores 17 0.914 ± 0.027 0.0079 ± 0.0004 OC36 O. castro - Madeira 25 0.920 ± 0.016 0.0078 ± 0.0004 O. castro - Galapagos 20 0.912 ± 0.022 0.0064 ± 0.0005 O. castro - Japan 16 0.893 ± 0.033 0.0116 ± 0.0005 O. monteiroi 14 0.944 ± 0.021 0.0111 ± 0.0008 O. castro - Azores 20 0.233 ± 0.086 0.0009 ± 0.0004 OC37 O. castro - Madeira 27 0.319 ± 0.073 0.0025 ± 0.0006 O. castro - Galapagos 22 0.647 ± 0.061 0.0040 ± 0.0004 O. castro - Japan 7 0.901 ± 0.046 0.0049 ± 0.0006 O. monteiroi 18 0.583 ± 0.076 0.0022 ± 0.0003 O. castro - Azores 19 0.860 ± 0.054 0.0092 ± 0.0026 CR O. castro - Madeira 58 0.791 ± 0.042 0.0068 ± 0.0007 O. castro - Galapagos 33 0.983 ± 0.012 0.0131 ± 0.0013 O. castro - Japan 30 0.862 ± 0.048 0.0185 ± 0.0036 O. monteiroi 31 0.929 ± 0.026 0.0154 ± 0.0015
21
4.2 Population genetic structure
4.2.1 Haplotype networks
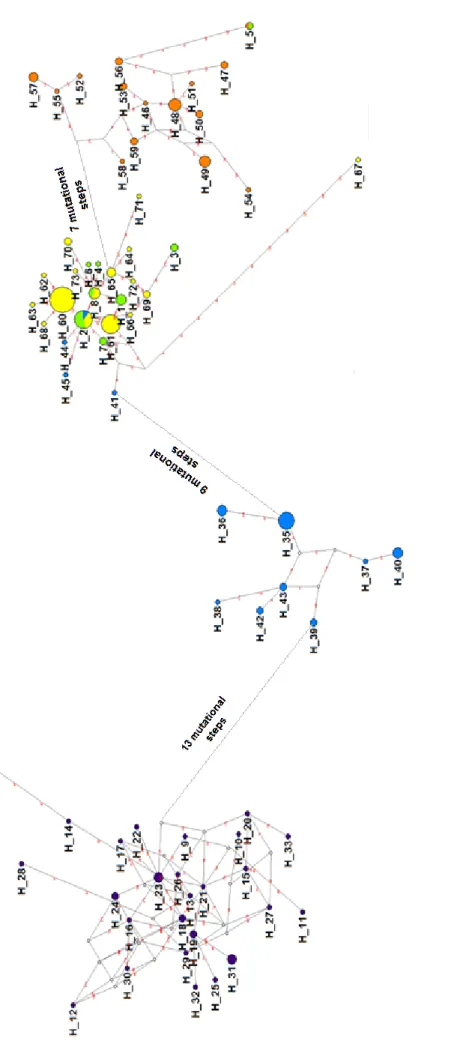
The Control Region network was well resolved and the different haplotypes formed structured phylogeographic groups in the final network (Figure 2).
Haplotypes belonging to O. castro individuals nesting in the Galapagos formed a reciprocal monophyletic group, differing from O. castro Japanese haplotypes (its genetically closest group) by, at least, thirteen mutational steps (4.7% sequence divergence).
Most of the Japanese haplotypes formed also a differentiated clade, differing slightly less from the O. castro NE Atlantic haplotypes (at least 10 mutational steps, 4% sequence divergence) than from the Galapagos clade.
In contrast, most haplotypes of O. castro from the Azores and Madeira populations grouped together and the number of mutations between them was low (0.1% sequence divergence). Haplotypes H_2 and H_8 were shared between these populations. Some haplotypes of O. castro sampled in Japan (haplotype H_41, H_45, H_44 and H_2) were also shared with or found to be more closely related to this group of haplotypes. Surprisingly, a single haplotype sampled in Madeira differed twelve mutational steps from the remaining O. castro NE Atlantic haplotypes. As the sample might have been mis-identified in the field, it was removed from further analyses.
Haplotypes of O. monteiroi formed an almost reciprocal monophyletic clade, except for haplotype H_5, shared with an O. castro individual from the Azores. Excluding this haplotype, O. monteiroi haplotypes differed, at least, six mutational steps from the O. castro NE Atlantic group (2.4% sequence divergence).
22 Figure 2 M edi an -j oi ni ng n et w or k o f C ont rol R eg ion hapl o type s. The si ze of t h e ci rcl es is pr opor ti ona l to t he hapl ot yp e fr eque n cy. Mut at iona l st eps se pa rat ing t h e ha pl ot yp es a re i nd ica ted ove r t he ha pl o type l in ki ng l ine s. The c ol o rs of ea ch c ir cl e r ep re se n t t h e or ig in of t he ha pl o type . G ree n – O . cas tr o popul at ion fr om A zo res ; Y el low – O . cas tro popu la ti o n fr o m Ma d ei ra; V io le t – O . cas tr o popul at ion fr o m G al ap agos ; B lue – O . cas tro popul at ion fr o m Ja pan ; O ra nge – O . m o nt ei roi popu la ti o n; Whi te – m iss ing i nt er m ed iat e ha pl o type s.
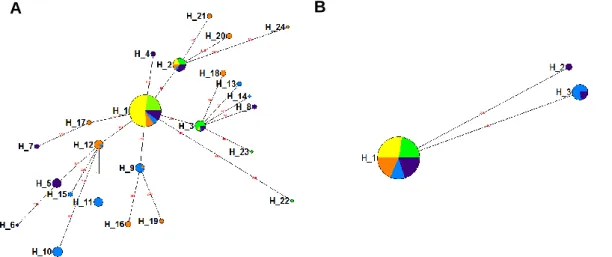
23 The median-joining networks based on the nuclear anonymous loci were not as well resolved and most loci showed a pattern of polyphyly (Figure 3). As a result, haplotypes were not as geographically structured as were the Control Region haplotypes.
A common pattern to many loci (Figure 3: A, B, C, E, G, and J) was the presence of a widely distributed, high frequency, central haplotype likely reflecting retained ancestral polymorphism, separated by several, closely related (differing by one or two base pairs), low frequency haplotypes, private to single populations. The O. castro population from Galapagos seemed to be the population with a higher number of private nuclear alleles.
Nevertheless in a few loci it was already possible to identify a more marked geographic structuring of the alleles. In locus OC17 (Figure 3D) there were two well-structured clades, representing Pacific and Atlantic haplotypes, which were almost reciprocally monophyletic. Only two Pacific alleles (H_3 and H_10) clustered with the NE Atlantic group and an allele sampled in Madeira (H_20) clustered with the Pacific group.
Figure 3 Median-joining networks of the twelve nuclear anonymous loci: OC6 (A); OC8 (B);
OC9 (C); OC17 (D); OC20 (E); OC22 (F); OC24 (G); OC25 (H); OC26 (I); OC31 (J); OC36 (K); OC37 (L). The size of the circle is proportional to the haplotype frequency. Mutational steps separating the haplotypes are indicated over the haplotype linking lines. The colors of each circle represent the origin of the haplotype. Green – O. castro population from Azores; Yellow – O. castro population from Madeira; Violet – O. castro population from Galapagos; Blue – O.
castro population from Japan; Orange – O. monteiroi population; White – missing intermediate
haplotypes.
A
B
24
Figure 3 (Continued).
C D
E F
25
Figure 3 (Continued).
4.2.2 Clustering of nuclear genotypes by STRUCTURE
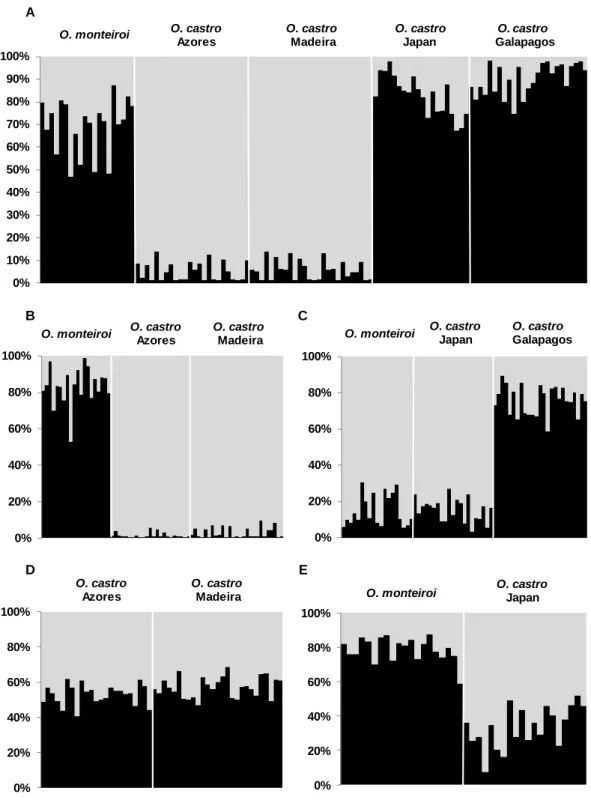
The analysis of genetic structure of all individuals without prior knowledge of their geographic origin, based only on the anonymous loci, revealed that the number of clusters that best fit the data was K = 2. Accordingly, all individuals belonging to O. castro populations from Azores and Madeira archipelagos were assigned to one genetic cluster with posterior probability greater than 0.85 (median = 0.95), whereas most O. monteiroi individuals and those from Pacific populations of O. castro were assigned to a second genetic cluster (Figure 4A). However, O. monteiroi individuals were more
I J
J
26 uncertainly assigned to this second genetic cluster (median = 0.72), than O. castro individuals from Japan and Galapagos (median = 0.84 and median = 0.89, respectively). STRUCTURE was re-ran on two sub-sets of the data, the first using only individuals belonging to O. monteiroi population and O. castro populations from NE Atlantic, and the second sub-set using the individuals assigned to the second genetic cluster of the first analysis.
In the first case the most likely value of K was two. Most of O. monteiroi individuals were clearly distinguishable (posterior probability median of belong to the first genetic cluster = 0.84) from O. castro individuals from Azores and Madeira, which were all assigned to the second genetic cluster with posterior probability greater than 0.90 (median = 0.99) (Figure 4B). Surprisingly, the subsequent analysis only with O. castro individuals from NE Atlantic populations revealed that the most likely value of K was not one (K = 2). However, individuals were only poorly assigned to one of the two genetic clusters (posterior probability median of assignment to one genetic cluster < 0.60), revealing likely admixture and suggesting that K may indeed be one (Figure 4D).
In the second case STRUCTURE revealed the existence of sub-structuring within the second genetic cluster of the first analysis (K = 2, Figure 4C). All O. castro individuals from Japan and O. monteiroi individuals were assigned to one genetic cluster with more than 0.70 of posterior probability (median = 0.87), while O. castro Galapagos individuals formed a second differentiated genetic cluster (posterior probability median = 0.77). When STRUCTURE was re-run only with all individuals from the first genetic cluster, K was also 2. O. monteiroi individuals were all assigned to one genetic population with posterior probability greater than 0.70 (median = 0.81), while most of O. castro individuals from the Japanese population were assigned to the second genetic cluster with a lower posterior probability (posterior probability median = 0.65), but suggesting that these populations were also differentiated from each other (Figure 4E).
27 A B C D E 0% 20% 40% 60% 80% 100% 0% 10% 20% 30% 40% 50% 60% 70% 80% 90% 100% 0% 20% 40% 60% 80% 100% 0% 20% 40% 60% 80% 100%
O. castro O. castro O. castro O. castro Azores Madeira Japan Galapagos
O. castro O. castro Azores Madeira O. castro Japan O. monteiroi O. monteiroi O. monteiroi O. castro O. castro Japan Galapagos 0% 20% 40% 60% 80% 100%
O. monteiroi O. castro O. castro Azores Madeira
Figure 4 Results from STRUCTURE clustering analyses of all anonymous loci genotypes.
Probabilistic assignments of individual genotypes of all populations (A); only of O. monteiroi population and O. castro populations from Azores and Madeira (B); only of O. monteiroi population and O. castro populations from Galapagos and Japan (C); only of O. castro population from Azores and Madeira (D); only of O. monteiroi population and O. castro population from Japan (E).