High Levels of Genetic Connectivity among
Populations of Yellowtail Snapper,
Ocyurus
chrysurus
(Lutjanidae
–
Perciformes), in the
Western South Atlantic Revealed through
Multilocus Analysis
Raimundo da Silva1, Ivana Veneza1, Iracilda Sampaio2, Juliana Araripe2, Horacio Schneider2, Grazielle Gomes1,2*
1Laboratório de Genética Aplicada, Instituto de Estudos Costeiros, Campus Bragança—Universidade Federal do Pará, Bragança, Pará, Brasil,2Laboratório de Genética e Biologia Molecular, Instituto de Estudos Costeiros, Campus Bragança—Universidade Federal do Pará, Bragança, Pará, Brasil
Abstract
In the present study, five loci (mitochondrial and nuclear) were sequenced to determine the genetic diversity, population structure, and demographic history of populations of the yel-lowtail snapper,Ocyurus chrysurus, found along the coast of the western South Atlantic.O.
chrysurusis a lutjanid species that is commonly associated with coral reefs and exhibits an ample geographic distribution, and it can therefore be considered a good model for the in-vestigation of phylogeographic patterns and genetic connectivity in marine environments. The results reflected a marked congruence between the mitochondrial and nuclear markers as well as intense gene flow among the analyzed populations, which represent a single ge-netic stock along the entire coast of Brazil between the states of Pará and Espírito Santo. Our data also showed high levels of genetic diversity in the species (mainly mtDNA), as well a major historic population expansion, which most likely coincided with the sea level oscilla-tions at the end of the Pleistocene. In addition, this species is intensively exploited by com-mercial fisheries, and data on the genetic structure of its populations will be essential for the development of effective conservation and management plans.
Introduction
Preservation of the biological diversity of any ecosystem is essential for evaluation of the distribu-tion and connectivity of its populadistribu-tions [1] and the factors that determine these patterns. Consid-ering the marine environment, opportunities for isolation to occur between populations are rare [2–4]. Many marine fish species tend to present a high degree of genetic connectivity, despite being distributed over thousands of kilometers of ocean, although this is often attributed to the OPEN ACCESS
Citation:da Silva R, Veneza I, Sampaio I, Araripe J, Schneider H, Gomes G (2015) High Levels of Genetic Connectivity among Populations of Yellowtail Snapper,Ocyurus chrysurus(Lutjanidae– Perciformes), in the Western South Atlantic Revealed through Multilocus Analysis. PLoS ONE 10(3): e0122173. doi:10.1371/journal.pone.0122173
Academic Editor:João Pinto, Instituto de Higiene e Medicina Tropical, PORTUGAL
Received:June 6, 2014
Accepted:February 5, 2015
Published:March 13, 2015
Copyright:© 2015 da Silva et al. This is an open access article distributed under the terms of the
Creative Commons Attribution License, which permits unrestricted use, distribution, and reproduction in any medium, provided the original author and source are credited.
Data Availability Statement:All sequences files will be available in the genbank with their access codes. This information, in paper, will only be available after acceptance.
intense mixing of individuals during the initial phases of development [2,5,6]. In fact, genetic connectivity has often been associated with the duration of the pelagic larval phase (PLD) [7], al-though a number of studies have shown that there is not always a clear relationship between the duration of this phase and the genetic homogeneity of populations [8,9].
The yellowtail snapper,Ocyurus chrysurus(Bloch 1790), is a lutjanid fish found in tropical and subtropical coastal regions, where it is generally associated with sandy bottoms and coral reefs [10]. This species occurs in the western Atlantic between Florida (USA) and southeastern Brazil [10,11]. Similar to other lutjanid species,O.chrysurusexhibits a pelagic larval develop-ment period of approximately 30 days [12]. Following settlement of pelagic larvae, some stud-ies indicate that the movements of the juveniles and adults of this specstud-ies are somewhat limited [13,14], which may restrict gene flow among populations. A recent study [15] that included specimens from the Florida coast and the Caribbean and analyzed both mitochondrial (ND4 gene) and nuclear data (microsatellites) found that gene flow among populations was restricted and identified four distinct stocks ofO.chrysurusin the region, despite not finding high levels of genetic divergence between populations. These results were attributed to a set of factors, par-ticularly the influence of ocean currents and limitations on the movement of the post-larvae and adults [15].
Additional studies have provided evidence of the sub-structuring of yellowtail snapper stocks in the western Atlantic, including the Caribbean [16]. Vasconcellos et al. [16] analyzed populations from the coast of Brazil (Ceará, Pernambuco, Bahia, and Espírito Santo) and the Caribbean (Belize) based on morphometric data, allozymes, and sequences of mitochondrial DNA (Control Region) and identified a single Brazilian stock, revealing significant levels of ge-netic sub-structuring between populations from Belize and Brazil.
In spite of the economic and ecological relevance of this species as a fishery resource, Vas-concellos et al. [16] conducted the only genetic study of the Brazilian populations ofO. chry-surusreported to date. Additionally, there was a large gap between the northernmost Brazilian population examined by these authors, in the state of Ceará, and Belize. In others words, the northern limit of the Brazilian stock—or how many stocks exist—remained unclear, consider-ing the enormous extent of the northern sector of this country’s coastline. Distinct stocks dis-play independent evolutionary dynamics and can respond in different ways to intense fishing pressure [17]. Therefore, reliable information on these stocks is essential for fishery manage-ment and the conservation of the species.
Phylogeographic research in the western Atlantic (e.g., Brazil and Caribbean) has revealed a lack of effective barriers to gene flow in some fish species, such as two demersal lutjanids, the Southern and Northern red snappers,Lutjanus purpureus[5] andLutjanus campechanus[6], respectively. Given the evidence of population sub-structuring between the Caribbean and Bra-zilian coast in the yellowtail snapper and the sampling gap in the northern Brazil in previous studies (resolved through the inclusion of samples from Maranhão and Pará) [16], the present study assessed the genetic connectivity amongO.chrysuruspopulations distributed along more than 3,000 km of the coast of the western South Atlantic in Brazil (i. g. representing most of the species distribution in the Brazilian coast) and provides robust data on the population struc-ture, genetic variability, and demographic history of this species.
Materials and Methods
Sampling
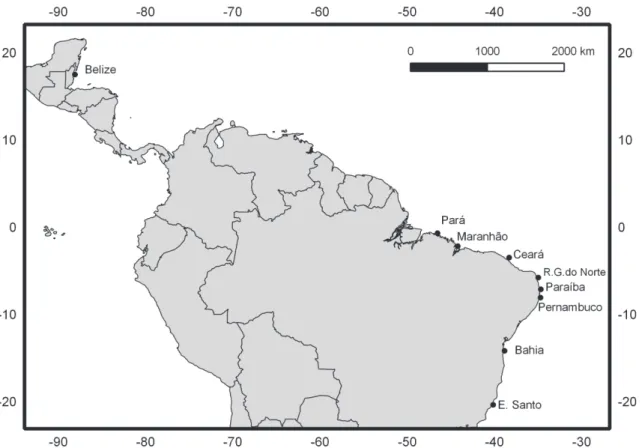
Specimens from a total of 170O.chrysurusadults were collected from eight localities on the coast of Brazil, between 2007 and 2012, in the states of Pará, Maranhão, Ceará, Rio Grande do Norte, Paraíba, Pernambuco, Bahia, and Espírito Santo (Fig. 1). The tissues were obtained Competing Interests:The authors have declared
from commercial fishing ports (obtained from the near-shore artisanal fishery) and the fishing with rafts, performed by local fisherman. The specimens were identified based on the specific literature [10,18].
Ethics Statement
All specimens were obtained from dead individuals, procured through direct purchase from commercial landings in the localities mentioned above.Ocyurus chrysurusis not endangered or protected along the Brazilian Coast. Therefore, there was no need to apply for a license for collection or approval by the Animal Ethics Committee. The specimens were transported with the authorization of the Brazilian Environment Ministry.
Laboratory procedures
In the laboratory, tissues samples (from the muscle, fin or tongue) were extracted from each specimen and frozen until analysis. All of the specimens were included in the Lutjanidae tissue bank of the Applied Genetics Laboratory at the Bragança, Campus of the Federal University of Pará (UFPA). Their genomic material was obtained using a phenol-chloroform and enzymatic extraction protocol and was precipitated with sodium acetate, isopropanol and ethanol [19].
For this study, we analyzed two mitochondrial markers, Cytochrome b (Cytb) and the control region (CR) [20,21], and three intragenic nuclear regions, Adenine Nucleotide Transporter— in-tron 1 (ANT-1), Growth Hormone—intron 5 (GH-5) and Insulin-Like Growth Factor 1—intron 2 (IGF-2) [22–24]. These segments were amplified using polymerase chain reaction (PCR)
Fig 1. Map of collection locations for the present study.Distribution of the localities on the coast of Brazil from which theOcyurus chrysurusspecimens were collected for the present study, as well as location of Belize, previously sampled by Vasconcellos et al.[16].
(Table 1). The reactions were run in a volume of 15μL, which included approximately 100 ng of total DNA, 2.4μL of dNTPs (1.25 mM), 1.5μL of buffer (200 mM Tris-HCl- pH 8.0, 500 mM KCl), 0.6μL of MgCl2 (50 mM), 0.6μL of each primer (50 ng/μL), 0.1μL of Taq DNA polymer-ase (5 U/μL), and ultrapure water added to complete the reaction volume.
The amplicons were purified with PEG 8000 (polyethylene glycol) following the protocol [25] and sequenced via the dideoxy-terminal method [26] using the reagents of the Big Dye kit (ABI Prism Dye Terminator Cycle Sequencing Reading Reaction—PE Applied Biosystems, Carlsbad, CA, USA). The precipitate was sequenced through capillary electrophoresis in an ABI 3500 automatic sequencer (Applied Biosystems).
Initially, only one of the strands of each genomic region was sequenced (seeTable 1). When ambiguities were observed in the chromatograms, the sample was sequenced in both directions and/or twice in the same direction (especially in the intragenic regions) to avoid errors in the identification of heterozygous individuals. For the intron of Insulin-like Growth Factor (IGF), it was necessary to design an internal primer (IGF B-5’- CATTGATATTCCTGNTCGTTCA-3’) to obtain sequences in both directions. All haplotypes were deposited in Genbank under the acces-sion numbers KM596919 to KM507050, except for GH-5, because that fragments smaller than 200 bp are not accepted in Genbank (these sequences are listen inS1 Supporting Information).
Database
The DNA sequences were edited and aligned in BIOEDIT v. 7.1.3.0 [27]. In the case of the nu-clear loci, the individual heterozygotes were detected when double peaks were observed at the same position in both directions in the chromatograms. Heterozygotic events caused by indels were diagnosed through visual analysis of the chromatograms, with the alleles being recon-structed in INDELLIGENT v. 1.2. (http://imperialis.inhs.illinois.edu/dmitriev/indel.asp) [28].
The gametic phase of each nuclear marker was defined using the PHASE algorithm [29], available in DNAsp v 5. 10.01 [30]. The runs consisted of 1,000 burn-in iterations and 1,000 principal iterations, with a thinning interval of 1. The algorithm was applied five times, with the fifth chain being ten times longer than the others. The haplotypes that returned a probabili-ty of less than 0.8 were excluded from the analyses.
For the nuclear data, the minimum number of recombination events was estimated via the Rm method [31], available in DNAsp v 5. 10.01 [30]. As the results of this analysis are strongly affected by homoplasy [32], the significance of the number of recombination events was
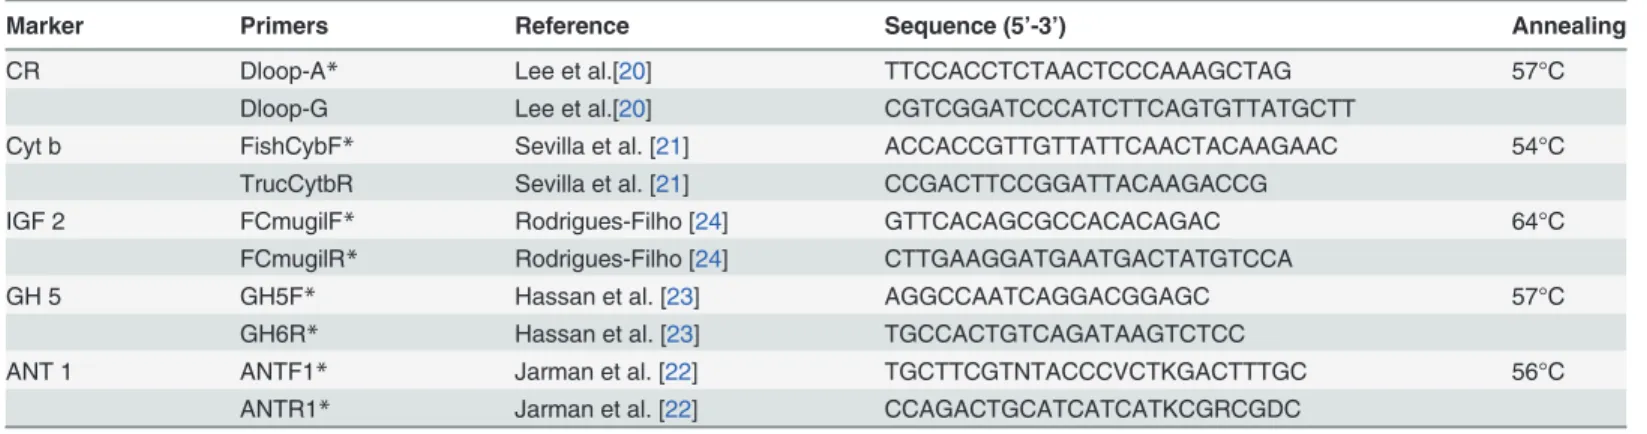
Table 1. Primers used in the present study for BrazilianOcyurus chrysurus.
Marker Primers Reference Sequence (5’-3’) Annealing
CR Dloop-A* Lee et al.[20] TTCCACCTCTAACTCCCAAAGCTAG 57°C
Dloop-G Lee et al.[20] CGTCGGATCCCATCTTCAGTGTTATGCTT
Cyt b FishCybF* Sevilla et al. [21] ACCACCGTTGTTATTCAACTACAAGAAC 54°C
TrucCytbR Sevilla et al. [21] CCGACTTCCGGATTACAAGACCG
IGF 2 FCmugilF* Rodrigues-Filho [24] GTTCACAGCGCCACACAGAC 64°C
FCmugilR* Rodrigues-Filho [24] CTTGAAGGATGAATGACTATGTCCA
GH 5 GH5F* Hassan et al. [23] AGGCCAATCAGGACGGAGC 57°C
GH6R* Hassan et al. [23] TGCCACTGTCAGATAAGTCTCC
ANT 1 ANTF1* Jarman et al. [22] TGCTTCGTNTACCCVCTKGACTTTGC 56°C
ANTR1* Jarman et al. [22] CCAGACTGCATCATCATKCGRCGDC
*Primers used for sequencing.
evaluated using theФWtest [32], available in SPLITS TREE v. 4.12.6 [33]. Linkage
disequilibri-um was analyzed the EM algorithm in ARLEQUIN v. 3.5.1.3 [34], which was run five times, with 20,000 permutations.
Characterization of genetic diversity and levels of gene flow
Determination of the number of polymorphic sites and the identification of possible stop co-dons (in the case of codifying regions) were performed in MEGA 6 [35]. The identification, quantification, and distribution of the haplotypes were determined in DNAsp v 5. 10.01 [30]. The genetic variability of the populations was evaluated based on the haplotype (h) and nucleo-tide (π) diversity indices [36] obtained from ARLEQUIN v. 3.5.1.3 [34].
The haplotype network was generated using HAPLOVIEWER [37] based on a maximum parsimony tree produced in DNAPARS, available in the package PHYLIP v. 3. 6 [38], in accor-dance with Salzburger et al. [37].
The genetic homogeneity of theO.chrysuruspopulations was initially evaluated through an analysis of molecular variance (AMOVA) [39] for each marker individually and subsequently through a multilocus approach, both with 10,000 permutations. This analysis permitted parti-tioning of the results into within- and between-population variation. In addition, Fstvalues
[40] were used to evaluate the gene flow between pairs of populations. These analyses were run in ARLEQUIN v. 3.5.1.3 [34], with a subsequent adjustment of thepvalues using the False Dis-covery Rate test [41]. To verify the existence of isolation by distance, Mantel tests were per-formed using a matrix of genetic (Fst/(1-Fst)) and geographic (km converted to Ln) distances [42]. Negative Fst values were expressed as zero. These analyses were conducted in IBDWS (http://ibdws.sdsu.edu/*ibdws) [43], with 10,000 permutations.
For comparison between Brazilian and Caribbean populations, the control region sequences used by Vasconcellos et al. [16] (accession numbers EF624354—EF624359; EF624361—EF624373) were included in the network, AMOVA, and pairwise Fst analyses as well the Mantel test.
Bayesian methods, using STRUCTURE v. 2.3.4 [44], were applied to assign individuals to populations. This procedure places individuals into K clusters, where K is chosen in advance but can be experimentally varied throughout independent runs. K values between 1 and 8 were tested, using a model with admixture and no locprior (i. e., only genetic data is used for the as-signment of individuals to a given K). For this analysis, only nuclear data were employed. Each run consisted of 1,000,000 steps (burn-in = 10%, and each value of K was implemented 10 times). The number of K was inferred by comparing the mean values of Ln Prob obtained in Structure Harvester (http://taylor0.biology.ucla.edu/structureHarvester/) [45].
Cluster analyses were also conducted in STRUCTURAMA [46]. For this analysis, the mito-chondrial and nuclear data were grouped. The runs consisted of 2,000,000 generations, (burn-in = 20%). For the values of K, we employed the follow(burn-ing distribution (K = expk (2)). The runs were summarized using the "showtogetherness" command.
To check the fit of the historical population dynamics to a model of exponential growth, we used a mismatch distribution [47] together with the SSD and raggedness indices. Mismatch analyses were conducted in DNAsp v 5 10 01 [30], rates of SSD and raggedness, were imple-mented in Arlequin v. 3.5.1.3 [34] based on 10, 000 permutations.
Two runs were performed using different random seeds, including 200 million generations for each BSP run and 400 million for each EBSP run, with samples taken at intervals of 10,000 generations, 10% of which were discarded as burn-in. The convergence and mixing of the chains were inspected visually in TRACER v.1.5 [55]. The convergence and mixing were con-sidered to be appropriate when all of the ESS values for each of the parameters analyzed were above 200.
Tajima’sD[56] and Fu’sFs[57] were also calculated, given that in addition to the detection of possible deviations from neutrality, these values may be used to evaluate demographic pat-terns, such as population expansion. These analyses were run in ARLEQUIN v. 3.5.1.3 [34], with their statistical significance being assessed using 10,000 permutations.
Results
Mitochondrial DNA
A total of 602 base pairs (bp) was sequenced from the Control Region in 152O.chrysurus spec-imens, and 645 bp of the Cytochrome b gene was sequenced in 170 specimens (Table 2). Con-sidering the respective evolutionary rates of the two markers, similar patterns concerning their distribution and haplotype frequencies were observed in the different populations examined. In the CR, which includes 93 polymorphic sites, a total of 91 haplotypes were identified, the most common of which was shared by 27 specimens and was present at all localities except Bahia. All other CR haplotypes were either unique or occurred at low frequencies and were dis-tinguished by a small number of mutations. Only 12 polymorphic sites were found in Cyto-chrome b; however, a total of 12 haplotypes were identified, two of which were very common, being shared by 74 (44%) and 67 (39%) of the specimens and being found in all of the populations analyzed.
The indices of haplotypic diversity were high in the CR (h = 0.963±0.010) and lower for Cytb (h = 0.653±0.002), and the same pattern was observed in the case of nucleotide diversity, withπ= 1.7% for the CR, but onlyπ= 0.15% for Cytb (Table 2). AMOVA indicated that most of the variation in both markers occurs within populations, rather than between them, with low and non-significantФSTvalues being obtained (Table 3), and this finding was further
cor-roborated by the non-significant Fstvalues obtained in the pairwise comparisons between
pop-ulations (Table 4). However, the comparison between the populations from the Brazilian coast and Belize revealed that approximately 30% of the variance is explained by differences between these two regions (Table 3). The Fst values between the Brazil and Belize populations were greater than 0.20 and were highly significant for all comparisons (Table 4), indicating particu-larly high differentiation between these stocks.
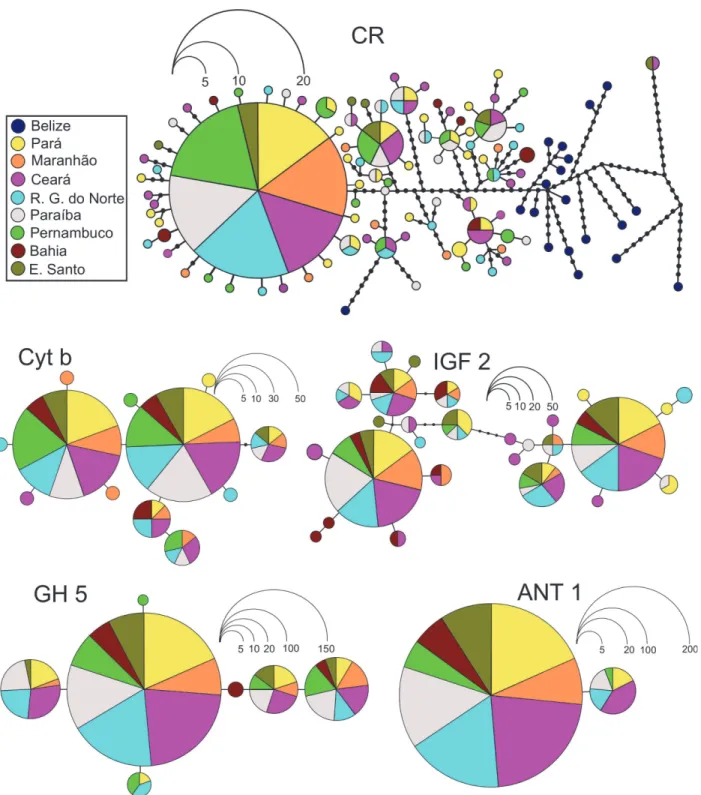
The genetic homogeneity of the populations from the Brazilian coast was also emphasized by the distribution of the haplotypes, given the lack of any clear geographic pattern in the net-work (Fig. 2). This genetic homogeneity over a broad geographic scale was further supported by the Mantel test, which rejected the scenario of isolation by distance (IBD), although when the comparisons included Belize there was some evidence in favor of a scenario with IBD, (Mantel test; r = 0.7354, p = 0.05) (S1 Fig.). The haplotypes identified in Belize were not shared by any locality analyzed along the Brazilian coast, supporting the significance of the
Mantel test.
With regard to the neutrality of the data, the obtainedFsvalues were significant in some populations, or when the specimens were grouped in a single population for both mitochondri-al markers (Table 2). TheDvalues were not significant for any population (Table 2).
Table 2. Genetic Diversity and statistics of neutrality for the BrazilianOcyurus chrysuruspopulations analyzed in the present study.
Locus/Locality N Unique haplotypes Nh S h (sd) π(%) Tajima’sD Fu’sFs
Control Region
PA 30 16 26 50 0.983 (0.016) 1.79 −0.55ns −12.16**
MA 11 7 8 36 0.890 (0.091) 1.56 −1.10ns 0.10ns
CE 31 17 26 61 0.982 (0.015) 2.01 −0.79ns −9.94**
RN 22 11 18 50 0.956 (0.036) 1.77 −0.88ns −5.04(0.029)
PB 21 7 17 51 0.966 (0.030) 1.90 −0.79ns −3.95ns
PE 22 7 15 39 0.943 (0.035) 1.50 −0.61ns −2.42ns
BA 8 3 6 26 0.928 (0.084) 1.93 0.83ns 1.23ns
ES 7 3 7 34 1 (0.076) 2.15 −0.38ns −1.12ns
Total 152 91 93 0.963 (0.010) 1.79 −1.11ns −24.22**
Cytochrome b
PA 29 1 5 5 0.615 (0.052) 0.12 −1.04ns −1.29ns
MA 16 2 7 7 0.791 (0.076) 0.21 −1.19ns −2.89*
CE 31 1 6 6 0.707 (0.054) 0.18 −0.64ns −1.15ns
RN 24 2 7 7 0.731 (0.064) 0.17 −1.23ns −2.69(0.027)
PB 23 - 4 5 0.557 (0.083) 0.12 −1.22ns −0.40ns
PE 25 1 4 4 0.616 (0.063) 0.14 −0.38ns 0ns
BA 10 - 3 2 0.711 (0.086) 0.13 0.83ns 0.25ns
ES 12 - 3 3 0.621 (0.103) 0.13 −0.04ns 0.39ns
Total 170 12 12 0.653 (0.022) 0.15 −1.33ns −5.43(0.024)
IGF 2
PA 22 4 12 16 0.811 (0.040) 1.43 1.95ns 0.70ns
MA 15 - 7 14 0.735 (0.054) 1.39 1.84ns 3.40ns
CE 27 4 14 14 0.808 (0.035) 1.39 2.36ns
−0.01ns
RN 21 1 11 15 0.815 (0.038) 1.44 2.25ns 1.25ns
PB 18 1 12 15 0.712 (0.069) 1.30 1.35ns
−0.28ns
PE 8 - 4 10 0.691 (0.073) 1.37 2.96ns 5.11ns
BA 8 2 8 14 0.891 (0.047) 1.37 1.08ns 0.26ns
ES 11 - 6 11 0.757 (0.074) 1.21 2.00ns 2.80ns
Total 130 28 20 0.785 (0.017) 1.40 2.01ns
−2.36ns GH 5
PA 26 - 5 4 0.451 (0.079) 0.45 −0.20ns −0.66ns
MA 12 - 5 5 0.626 (0.093) 0.80 0.87ns 0.01ns
CE 33 - 4 3 0.489 (0.067) 0.52 0.89ns 0.88ns
RN 25 - 4 4 0.433 (0.079) 0.41 −0.41ns 0.06ns
PB 23 - 4 3 0.588 (0.068) 0.66 1.52ns 1.26ns
PE 13 1 5 5 0.624 (0.086) 0.84 0.36ns 0.242ns
BA 7 - 3 3 0.483 (0.142) 0.54 0.07ns 0.78ns
ES 11 - 4 3 0.463 (0.119) 0.55 0.50ns 0.05ns
Total 150 8 6 0.510 (0.031) 0.57 0.10ns −0.96ns
ANT 1
PA 26 - 2 1 0.110 (0.057) 0.03 −0.66ns −0.45ns
MA 11 - 1 0 0.000 (0) 0.00 0ns 0ns
CE 33 - 2 1 0.192 (0.059) 0.06 −0.10ns 0.35ns
RN 24 - 2 1 0.119 (0.061) 0.03 −0.63ns −0.38ns
PB 21 - 2 1 0.135 (0.068) 0.04 −0.58ns −0.26ns
are consistent with a process of historical expansion of yellowtail snapper populations, as indi-cated by significant negativeFsvalues [57] and by adjusting the mismatch distributions to model population growth (Fig. 4).
Nuclear DNA
A fragment of 1,048 bp was sequenced for the nuclear regions, 552 bp of which corresponded to intron 2 of the Insulin-like Growth Factor (IGF) gene, which was sequenced in 130 speci-mens (13 individuals were excluded from the analysis due to the lowa posteriorivalues re-corded for their haplotypes). For this intron, an indel region of approximately 140 bp was identified. In the case of the Adenine Nucleotide Transporter (ANT) gene, 320 bp of intron 1 (together with a portion of the exons) was sequenced in 142 specimens, and 176 bp of intron 5 (together with a portion of the exon) of the Growth Hormone (GH) gene was sequenced in 150 specimens. TheФw test demonstrated the existence of recombination events only in IGF 2
Table 2. (Continued)
Locus/Locality N Unique haplotypes Nh S h (sd) π(%) Tajima’sD Fu’sFs
PE 7 - 2 1 0.142 (0.118) 0.04 −1.15ns −0.59ns
BA 8 - 1 0 0.000 (0) 0.00 0ns 0ns
ES 12 - 1 0 0.000 (0) 0.00 0ns 0ns
Total 142 2 1 0.112 (0.024) 0.03 −0.28ns −0.00007ns
Acronyms: N = number of specimens, Nh = number of haplotypes, S = number of segregating sites, h = haplotype diversity,π= nucleotide diversity.
*p<0.05 (for Fs<0.02)
**p<0.01; ns = not significant; PA: Pará; MA: Maranhão; CE: Ceará; RN: Rio Grande do Norte; PB: Paraíba; PE: Pernambuco; BA: Bahia; Espírito Santo.
doi:10.1371/journal.pone.0122173.t002
Table 3. Analysis of Molecular Variance for the BrazilianO.chrysuruspopulations.
C R Variance Variation (%) Ф
Among groups (Brazil x Belize) 2.70579 32.92262 0.32923**
Among groups/ Within groups −0.07523 −0.91533 −0.01365
Within of populations 5.58807 67.99271 0.32007
CR
Among populations −0.06248 −1.15973 −0.01160ns
Within of populations 5.44961 101.15973
Cyt b
Among populations −0.01012 −2.08757 −0.02088ns
Within of populations 0.49468 102.08757
nuDNA1
Among populations −0.00912 −1.32 −0.01324ns
Within of populations 0.69809 101.32
Analysis of Molecular Variance (AMOVA) for the BrazilianO.chrysuruspopulations analyzed in the present study, for control Region (Brazil/ Belize), Control Region (only Brazil), Cytochrome b, and nuDNA (intragenic markers–IGF 2; GH 5; ANT 1).
**- p<0.01; ns = not significant
1 Due to the similar pattern obtained for each marker individually, we chose to show only the of the results analysis multiloci.
(Rm = 8; p = 0.03). When the indel region was removed, recombination was not detected (p = 0. 25), and all of the analyses for this marker were performed excluding this region.
The highest diversity was recorded in the IGF 2 sequences (h = 0.785 ± 0.017;π= 1.4%), with intermediate values (h = 0.510±0.031;π= 0.57%) being recorded for GH 5 and consider-ably lower values being obtained for ANT 1 (h = 0.112±0.024;π= 0.03%) (Table 2).
The results of the AMOVA revealed that most of the genetic variance was present within, rather than between the populations, which is consistent with high levels of genetic similarity between populations (Table 3). This finding was reinforced by the frequency and distribution
Table 4. Matrix of pairwise Fst values for the Brazilian populations ofO.chrysurus. CR
BE PA MA CE RN PB PE BA ES
BE
-PA 0.295**
-MA 0.319** −0.008ns
-CE 0.269** −0.009ns −0.014ns
-RN 0.288** −0.020ns −0.035ns −0.025ns
-PB 0.272** −0.022ns −0.014ns −0.016ns −0.025ns
-PE 0.325** −0.018ns −0.030ns −0.007ns −0.024ns −0.016ns
-BA 0.203** −0.002ns 0.066ns 0.001ns 0.0001ns 0.005ns 0.035ns
-ES 0.258** 0.014ns 0.008ns 0.0008ns 0.009ns −0.026ns 0.016ns 0.077ns
-Cyt b
PA MA CE RN PB PE BA ES
PA
-MA −0.023ns
-CE −0.012ns −0.030ns
-RN −0.017ns −0.030ns −0.032ns
-PB −0.008ns −0.009ns −0.021ns −0.027ns
-PE −0.015ns −0.034ns −0.006ns −0.008ns 0.021ns
-BA −0.026ns −0.054ns −0.051ns −0.060ns −0.024ns −0.030ns
-ES −0.051ns −0.044ns −0.037ns −0.039ns −0.041ns −0.018ns −0.030ns -nuDNA
PA MA CE RN PB PE BA ES
PA
-MA −0.018ns
-CE −0.015ns −0.027ns
-RN −0.015ns −0.019ns −0.015ns
-PB −0.010ns 0.004ns 0.003ns 0.0001ns
-PE −0.030ns −0.030ns −0.017ns −0.019ns −0.023ns
-BA −0.013ns −0.034ns −0.023ns −0.023ns 0.013ns −0.019ns
-ES −0.004ns −0.028ns −0.005ns −0.002ns 0.047ns −0.012ns −0.012*ns
-Matrix of pairwise Fst values for the Brazilian populations ofO.chrysurusanalyzed in the present study, for control Region, Cytochrome b, and nuDNA (intragenic markers—IGF 2; GH 5; ANT 1). Acronyms: BE- Belize, PA- Pará, MA- Maranhão, CE- Ceará, RN- Rio Grande do Norte, PB- Paraíba, PE-Pernambuco, BA- Bahia, ES- Espírito Santo
**- p = 0
*ns= -p<0.05, however non-significant after FDR
ns- Not signi ficant
1- Due to the similar pattern obtained for each marker individually, we chose to show only the of the results analysis multiloci.
of the identified haplotypes (Fig. 2) as well as by non-significant values of the pairwise Fst (Table 4) and Mantel tests (S1 Fig.). Likewise, the Bayesian clustering analysis showed that a scenario with only one group is the most likely (S2andS3Figs.).
Fig 2. Genetic relationships among haplotypes found in the BrazilianOcyurus chrysuruspopulations.Estimated by the maximum parsimony method, for the sequences of the Control Region, Cytochrome b, IGF 2, GH 5, and ANT. Each haplotype is represented by a circle, and the frequency of each haplotype proportional to the scale shown. Colors refer to the origin of each sample analyzed.
With regard to the neutrality indices (Table 2), the obtained values were negative and not significant. The mismatch distributions were unimodal for all markers, except for IGF 2, which presented a clearly bimodal distribution (Fig. 4). This pattern can be observed in populations that have experienced long intervals with stable sizes or that have undergone a subtle decrease
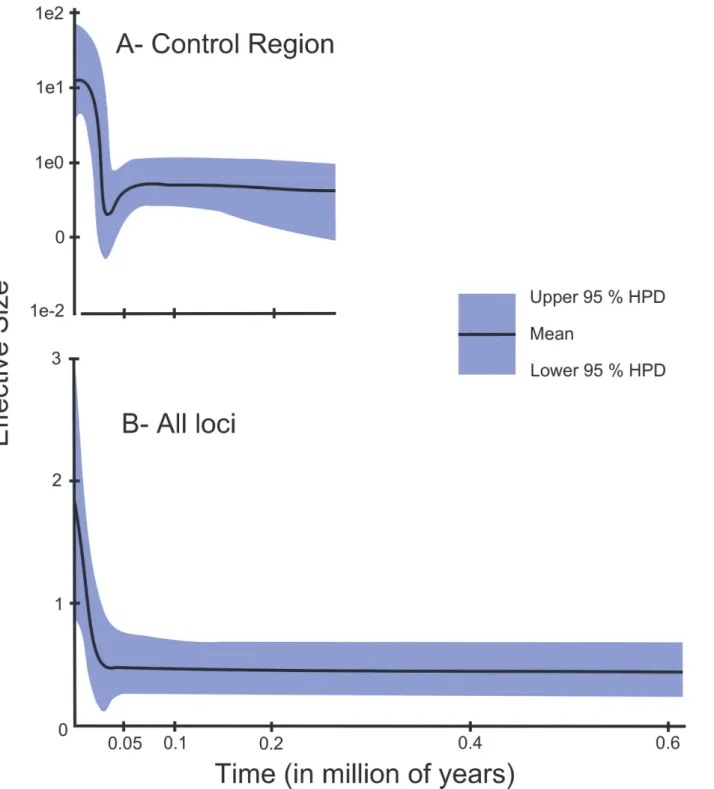
Fig 3. Skyline plots for BrazilianOcyurus chrysurus.A. Based on the Control Region sequences (Bayesian Skyline plot). B. Extended Bayesian Skyline plot for the BrazilianOcyurus chrysuruspopulations. Both are based on a mutation rate of 10% per million years (between lineages).
in their effective size, followed by an event of expansion of range, or in populations who have experienced a weak bottleneck [58]. The EBSP analysis indicated the occurrence of an increase in the effective size of theO.chrysuruspopulations (Fig. 3), supporting the results of the BSP for the mitochondrial Control Region.
Discussion
Genetic structure in the yellowtail snapper
The pattern of genetic homogeneity observed inO.chrysurusin the present study is similar to that found in other lutjanids, such asLutjanus kasmira[59],Pristipomoides filamentosus[60],
L.campechanus[6], andL.purpureus[5]. All of these species exhibit a high dispersal capacity during at least one phase of their life cycle. However, a pattern of significant genetic structure
Fig 4. Distribution of the pairwise differences between haplotypes forOcyurus chrysurusfrom the coast of Brazil.On the y axis the number of proportional differences is presented. X-axis represents the number of differences between pairs of sequences. Bars correspond to the observed values, and the dotted lines represent the proposed model for exponential growth.
has been observed for other species of this Family, such asLutjanus erythropterus[53], Lutja-nus fulvus[59], andLutjanus synagris[61].
Differences in larval behavior as well as the characteristics of the environment where these species live may explain these discordant patterns of genetic connectivity and appear to directly influence the evolutionary history of these fish. However, it is important to note thatO.chrysurus
is not genetically homogeneous throughout the whole of its geographic distribution. Vasconcel-los et al. [16] found marked differences between the Caribbean and Brazilian populations of
O.chrysurus, while Saillant et al. [15] detected genetic sub-structuring in the populations of these species located in neighboring areas of the Caribbean and Gulf of Mexico. In general, these data are consistent with the existence of effective barriers in the ocean between northern Brazil and the Caribbean, (e.g., circulation patterns and ocean currents), as identified in previous phylogeo-graphic studies [62–64], as well as between the Caribbean and the Gulf of Mexico [15,65]. Never-theless, regarding genetic differentiation involving Brazilian populations, our results demonstrate that the model of isolation by distance cannot be discarded.
Juvenile and adult yellowtail snappers tend to remain within their area of settlement over the course of their lives [13,14]. This characteristic, in addition to specific habitat features, such as the pattern of currents, may account for the genetic differentiation observed in previous studies, with limited gene flow occurring between populations in some areas [15].
However, the larvae ofO.chrysurusdisplay a strong swimming ability [66], and they are most likely able to travel long distances, which could lead to intensive mixture of individuals. Moreover, these larvae present a planktonic phase of approximately one month and an off-shore distribution, and during this larval stage, they preferably inhabit surface waters, which are more subject to the influence of ocean currents [12]. The dynamics of ocean surface circula-tion in the south of the western Atlantic region is primarily a result of bifurcacircula-tion of the South Equatorial current [67]. Some studies, however, demonstrate that the bifurcation of the south equatorial current is not an effective barrier to dispersal for many marine taxa [68,69], further-more, the main currents parallel to the Brazilian coast (i.e. Brazil Current / North Brazil Cur-rent) show slight seasonal changes in direction (seehttp://www.aoml.noaa.gov/phod/graphics/ dacdata/seasonal_brazil.gif) that could allow some connectivity between the locations analyzed. Thus, all of these features are consistent with high genetic similarity along the Brazilian coast (coast Pará to Espírito Santo), as demonstrated in this study, and they may be the main factors regulating the genetic connectivity between the Brazilian populations ofO.chrysurus, as ob-served in another lutjanid,L.purpureus[5].
Genetic Diversity
The results of the present analysis revealed high levels of genetic variation in the investigated yellowtail snapper populations, especially in the mitochondrial markers, which presented a large number of haplotypes, similar to that recorded forL.purpureus[5] andL.campechanus
[6], with similar genetic variability demonstrated between localities, over a distance of approxi-mately 3,000 km along the Brazilian coast. This outcome would be expected for populations linked by intense gene flow, a scenario commonly observed in a number of marine species [70]. The high indices of genetic diversity recorded in the present study, especially for the mito-chondrial markers, and particularly the Control Region, are a common feature of marine tele-osts, including lutjanids [5,6,53,71,72], and have been recorded previously inO.chrysurus[16].
indices. For example, Hoarau et al. [73] did not report decreased levels of genetic variability in microsatellite markers in a temporal analysis ofPleuronectes platissacovering almost 100 years, even though this species has been heavily exploited since the XIX century. Additionally, Pinsky & Palumbi [74] recently performed a meta-analysis involving hundreds of fish species and observed high levels of genetic diversity for snappers of the genusLutjanus, even for spe-cies that are considered to be overfished.
Distinct levels of genetic diversity were observed at the three nuclear loci analyzed in the present study. The most variable nuclear locus was the intron of the IGF 2 gene, which pre-sented a degree of polymorphism comparable to that observed in the mitochondrial Control Region, indicating that it is a potentially useful marker for population-level and phylogeo-graphic studies in lutjanids, as observed forCentropomus[75].
Demographic History
The yellowtail snapper inhabits coastal waters [10] and is therefore relatively susceptible to sea level oscillations [76]. During the last glacial maximum, for example, approximately 90% of the present-day continental shelf of the Caribbean region was above sea level, due to a decrease in the sea level of 120 meters [77]. This situation almost certainly led to the extinction of species or lineages, as well as contraction processes and population expansion [78,79,80].
The temperature fluctuations that occurred in this period may have had a great influence on the historical demography of a number of marine species from this region. For example, Rocha et al. [81] lists temperature fluctuations that occurred in the Atlantic (see Sachs et al. [82]) as one of the events responsible for population growth in species of theChromisgenus.O. chry-surusgenerally prefers water at temperatures between 24–30°C, with temperatures above 34°C being lethal for this species [83]. Thus, temperature changes beyond these thresholds could also lead to strong fluctuations in the effective size ofO.chrysuruspopulations.
Historic events of population expansion are commonly identified in demographic studies on marine fish species. In the western Atlantic, events of this type have been recorded in Cynos-cion guatucupa[84] andChromis multilineata[81] as well as in lutjanids, such as the snappers
L.purpureus[5] andL.campechanus[6].
The results obtained for theO.chrysurusstocks analyzed in the present study clearly indi-cate population expansion along the Brazilian coast. This process is similar to that observed in CaribbeanO.chrysurus, although Vasconcellos et al. [16] concluded that the Brazilian popula-tions were demographically stable because all tests neutrality (“Fs”and“D”) were unable to re-ject a neutral model of evolution. In this case, it is possible that the discrepancies in relation to the previous study are related to intrinsically different sensitivities of the applied neutrality tests. Finally,Fstest, was significant only for the total population for the mitochondrial mark-ers examined in the present study. Fu's test shows greater statistical power and sensitivity for detecting events of geographical expansion [57] and is therefore more suitable for supporting the expansion scenario indicated by the mitochondrial markers.
Final considerations
The present study is the most comprehensive investigation of the Brazilian populations of
Ocyurus chrysurusundertaken to date. The results clearly revealed the existence of a single pan-mictic population along the Brazilian coast (sensuSelkoe et al.)[87], and as reported by Vas-concellos et al. [16], there is a high level of substructure between the Brazilian and Caribbean populations. However, it is worth mentioning that the absence of individuals sampled between Brazil and Belize makes it difficult to perform further analyses of the historical connectivity be-tween populations in this geographic range.
In relation to the high levels of genetic diversity observed, mainly among mitochondrial markers, these findings cannot be interpreted as a lack of any impact of fisheries on these popu-lations, given that the commercial exploitation of this species is relatively recent, and the mark-ers used in the present study would not be appropriate for the detection of alterations on this time scale (see Gaither et al. [88]). Furthermore, the deterioration of genetic diversity due to overfishing is more clearly demonstrated in populations that exhibit a low effective size (e.g., a few hundred individuals) and low migration rates [74], which may not be the scenario for
Ocyurus chrysurusalong the Brazilian coast.
The data presented herein suggest that the populations of yellowtail snapper along the Bra-zilian coast may represent a single genetic stock, and if so, they should be managed as a unit. This conclusion has strong implications for the management of this species. For example, for various snappers, includingO.chrysurus, the formation of shoals for spawning is reported to occur at a number of locations [89]. Thus, the protection of these areas should be given a higher priority because they apparently have a greater impact on the population structure over a vast area.
Further studies involving other classes of molecular markers (e.g., microsatellite markers, SNPs, adaptive loci) as well as studies tracking adults and larval dispersal should be conducted to obtain a better understanding of the structure ofO.chrysuruspopulations.
Supporting Information
S1 Fig. Correlation between genetic distance and geographic distance between sample sites forO.chrysurus.
(TIF)
S2 Fig. Diagrams representing the structure of the K values (1–8).Above Mean Ln prob
values ± standard deviation for each value of K. Each individual is represented by a bar. The height of the bar is proportional to the probability of the individual belonging to a given clus-ter.
(TIF)
S3 Fig. Matrix indicating the pair-wise probability of each individual belonging to the same group.Each individual analyzed is represented by a square, and that the probability val-ues are represented by color (see scale). Numbers: 1- Pará, 2- Maranhão, 3- Ceará, 4- R. G. do Norte, 5- Paraíba, 6- Pernambuco, 7- Bahia, 8- Espírito Santo.
(TIF)
S1 Supporting Information. Codes and sequences of Growth hormone- Intron 5 utilized in the present study.
Author Contributions
Conceived and designed the experiments: RS IV JA GG. Performed the experiments: RS IV GG. Analyzed the data: RS GG HS IS. Contributed reagents/materials/analysis tools: IS HS GG. Wrote the paper: RS IS JA HS GG. Drafting the article or revising it critically for important in-tellectual content: GG JA IS. Final approval of the version to be published: GG JA HS.
References
1. Craig MT, Hastings PA, Pondella DJ II, Ross Robertson D, Rosales-Casián JA. Phylogeography of the flag cabrillaEpinephelus labriformis(Serranidae): implications for the biogeography of the Tropical Eastern Pacific and the early stages of speciation in a marine shore fish. J Biogeogr. 2006; 33: 969–
979.
2. Palumbi SR. Genetic Divergence, Reproductive Isolation, and Marine Speciation. Annu Rev Ecol Syst. 1994; 25: 547–572.
3. Rocha LA, Robertson DR, Roman J, Bowen BW. Ecological speciation in tropical reef fishes. Proc Biol Sci. 2005; 272: 573–579. PMID:15817431
4. Bernardi G. Speciation in fishes. Mol Ecol. 2013; 22: 5487–5502. doi:10.1111/mec.12494PMID: 24118417
5. Gomes G, Sampaio I, Schneider H. Population structure ofLutjanus purpureus(Lutjanidae— Perci-formes) on the Brazilian coast: further existence evidence of a single species of red snapper in the western Atlantic. An Acad Bras Cienc. 2012; 84: 979–999. PMID:23207703
6. Garber AF, Tringali MD, Stuck KC. Population structure and variation in red snapper (Lutjanus
campe-chanus) from the Gulf of Mexico and Atlantic coast of Florida as determined from mitochondrial DNA
control region sequence. Mar Biotechnol. 2004; 6: 175–185. PMID:14586768
7. Planes S. Biogeography and Larval Dispersal Inferred from Population Genetic Analysis. In: Sale P., editor. Coral reef fishes: dynamics and diversity in a complex ecosystem. New York, USA: Academic Press; 2002. pp. 201–220.
8. Shulman MJ, Bermingham E. Early Life Histories, Ocean Currents, and the Population Genetics of Ca-ribbean Reef Fishes. Evolution. 1995; 49: 897–910.
9. Luiz OJ, Madin JS, Robertson DR, Rocha LA, Wirtz P, Floeter SR. Ecological traits influencing range expansion across large oceanic dispersal barriers: insights from tropical Atlantic reef fishes. Proc Biol Sci. 2012; 279: 1033–1040. doi:10.1098/rspb.2011.1525PMID:21920979
10. Allen G-R. Snappers of the World.An annotated and illustrated catalogue of Lutjanid species known to date. Vol 6. Rome: FAO; 1985.
11. Cervigón F. Los peces marinhos de Venezuela. 2a edição. Caracas, Venezuela: Fundacion Científica Los Roques; 1993.
12. Lindeman KC, Lee TN, Wilson WD, Claro R, Ault JS. Transport of Larvae Originating in Southwest Cuba and Dry Tortugas: Evidence for Retention in Grunts and Snappers. Proc 52nd Gulf Caribb Fish Inst. 2001; 52: 732–747.
13. Lindholm J, Kaufman L, Miller S, Wagschal A, Newville M. Movement of yellowtail snapper (Ocyurus chrysurus Block 1790) and black grouper (Mycteroperca bonaci Poey 1860) in the northern Florida Keys National Marine Sanctuary as determined by acoustic telemetry: 2005. Available:http:// aquaticcommons.org/2324/1/lindholm.pdf.
14. Watson M, Munro J, Gell FR. Settlement, movement and early juvenile mortality of the yellowtail
snap-perOcyurus chrysurus. Mar Ecol Prog Ser. 2002; 237: 247–256.
15. Saillant EA, Renshaw MA, Cummings NJ, Gold JR. Conservation genetics and management of yellow-tail snapper,Ocyurus chrysurus, in the US Caribbean and South Florida. Fish Manag Ecol. 2012; 19: 1–12.
16. Vasconcellos AV, Vianna P, Paiva PC, Schama R, Solé-Cava A. Genetic and morphometric differ-ences between yellowtail snapper (Ocyurus chrysurus, Lutjanidae) populations of the tropical West At-lantic. Genet Mol Biol. 2008; 31: 308–316.
17. Ovenden JR, Berry O, Welch DJ, Buckworth RC, Dichmont CM. Ocean’s eleven: a critical evaluation of the role of population, evolutionary and molecular genetics in the management of wild fisheries. Fish Fish. 2013; doi:10.1111/faf.12052.
18. Menezes NA, Figueiredo JL. Manual de Peixes Marinhos do Sudeste do Brasil.IV.Teleostei (3). São
19. Sambrook J, Fritsch EF, Maniatis T. Molecular cloning. 2nd ed. New York, USA: Cold Spring Harbor Laboratory Press; 1989.
20. Lee W-J, Conroy J, Howell WH, Kocher TD. Structure and evolution of Teleost mitochondrial control re-gions. J Mol Evol. 1995; 41: 54–66. PMID:7608989
21. Sevilla RG, Diez A, Norén M, Mouchel O, Jérôme M, Verrez-Bagnis V. Primers and polymerase chain reaction conditions for DNA barcoding teleost fish based on the mitochondrial cytochrome b and nucle-ar rhodopsin genes. Mol Ecol Notes. 2007; 7: 730–734.
22. Jarman SN, Ward RD, Elliott NG. Oligonucleotide primers for PCR amplification of Coelomate introns. Mar Biotechnol. 2002; 4: 347–355. PMID:14961246
23. Hassan M, Lemaire C, Fauvelot C, Bonhomme F. Seventeen new exon-primed intron-crossing poly-merase chain reaction amplifiable introns in fish. Mol Ecol Notes. 2002; 2: 334–340.
24. Rodrigues-Filho LFS. Identificação e Filogeografia de Tainhas do Gênero Mugil e avaliação do estado
taxonômico das espéciesMugil lizaValenciennes, 1836 eMugil platanusGünther, 1880. Ph. D. Thesis, Universidade Federal do Pará. 2011.
25. Paithankar KR, Prasad KS. Precipitation of DNA by polyethylene glycol and ethanol. Nucleic Acids Res. 1991; 19: 1346. PMID:2030954
26. Sanger F, Nicklen S, Coulson AR. DNA sequencing with chain-terminating inhibitors. Procedings Natl Acad Sci USA. 1977; 74: 5463–5467. PMID:271968
27. Hall TA. BioEdit: A user-friendly biological sequence alignment editor and analysis program for Win-dows 95/98/NT. Nucleic Acids Symp Ser. 1999; 41: 95–98.
28. Dmitriev DA, Rakitov RA. Decoding of superimposed races produced by direct sequencing of heterozy-gous indels. PLoS Comput Biol. 2008; 4: e1000113. doi:10.1371/journal.pcbi.1000113PMID: 18654614
29. Stephens M, Smith NJ, Donnelly P. A new statistical method for haplotype reconstruction from popula-tion data. Am J Hum Genet. 2001; 68: 978–989. PMID:11254454
30. Librado P, Rozas J. DnaSP v5: a software for comprehensive analysis of DNA polymorphism data. Bio-informatics. 2009; 25: 1451–1452. doi:10.1093/bioinformatics/btp187PMID:19346325
31. Hudson RR, Kaplan NL. Statistical properties of the number of recombination events in the history of a sample of DNA sequences. Genetics. 1985; 111: 147–164. PMID:4029609
32. Bruen TC, Philippe H, Bryant D. A simple and robust statistical test for detecting the presence of recom-bination. Genetics. 2006; 172: 2665–2681. PMID:16489234
33. Huson DH, Bryant D. Application of phylogenetic networks in evolutionary studies. Mol Biol Evol. 2006; 23: 254–267. PMID:16221896
34. Excoffier L, Lischer HEL. Arlequin suite ver 3.5: a new series of programs to perform population genet-ics analyses under Linux and Windows. Mol Ecol Resour. 2010; 10: 564–567. doi: 10.1111/j.1755-0998.2010.02847.xPMID:21565059
35. Tamura K, Stecher G, Peterson D, Filipski A, Kumar S. MEGA6: Molecular Evolutionary Genetics Anal-ysis version 6.0. Mol Biol Evol. 2013; 30: 2725–2729. doi:10.1093/molbev/mst197PMID:24132122 36. Nei M. Molecular Evolutionary Genetics. New York: Columbia Univ. Press; 1987.
37. Salzburger W, Ewing GB, von Haeseler A. The performance of phylogenetic algorithms in estimating haplotype genealogies with migration. Mol Ecol. 2011; 20: 1952–1963. doi:10.1111/j.1365-294X. 2011.05066.xPMID:21457168
38. Felsenstein J. PHYLIP—Phylogeny Inference Package (version 3.2). Cladistics. 1989; 5: 164–166. 39. Excoffier L, Smouse PE, Quattro JM. Analysis of Molecular Variance Inferred from Metric Distances among DNA Haplotypes: Application to Human Mitochondrial DNA Restriction Data. Genetics. 1992; 131: 479–491. PMID:1644282
40. Weir BS, Hill WG. Estimating F-Statistics. Annu Rev Genet. 2002; 36: 721–750. PMID:12359738 41. Benjamini Y, Yekutieli D. The control of the false discovery rate in multiple testing under dependency.
Ann Stat. 2001; 29: 1165–1188.
42. Rousset F. Genetic differentiation and estimation of gene flow fromF-statistics under isolation-by-dis-tance. Genetics. 1997; 145: 1219–1228. PMID:9093870
43. Jensen JL, Bohonak AJ, Kelley ST. Isolation by distance, web service. BMC Genet. 2005; 6. doi:10. 1186/1471-2156-6-13.
44. Pritchard JK, Stephens M, Donnelly P. Inference of population structure using multilocus genotype data. Genetics. 2000; 155: 945–959. PMID:10835412
46. Huelsenbeck JP, Andolfatto P, Huelsenbeck ET. Structurama: bayesian inference of population struc-ture. Evol Bioinforma. 2011; 7: 55–59. doi:10.4137/EBO.S6761PMID:21698091
47. Rogers AR, Harpending H. Population growth makes waves in the distribution of pairwise genetic differ-ences. Mol Biol Evol. 1992; 9: 552–569. PMID:1316531
48. Drummond AJ, Rambaut A, Shapiro B, Pybus OG. Bayesian coalescent inference of past population dynamics from molecular sequences. Mol Biol Evol. 2005; 22: 1185–1192. PMID:15703244
49. Heled J, Drummond AJ. Bayesian inference of population size history from multiple loci. BMC Evol Biol. 2008; 8: doi:10.1186/1471–2148–8–289.
50. Drummond AJ, Suchard MA, Xie D, Rambaut A. Bayesian phylogenetics with BEAUti and the BEAST 1.7. Mol Biol Evol. 2012; 29: 1969–1973. doi:10.1093/molbev/mss075PMID:22367748
51. Guindon S, Gascuel O. A simple, fast, and accurate algorithm to estimate large phylogenies by maxi-mun likelihood. Syst Biol. 2003; 52: 694–704.
52. Darriba D, Taboada GL, Doallo R, Posada D. jModelTest 2: more models, new heuristics and parallel computing. Nat Methods. 2012; 9: 772. doi:10.1038/nmeth.2109PMID:22847109
53. Zhang J, Cai Z, Huang L. Population genetic structure of crimson snapperLutjanus erythropterusin East Asia, revealed by analysis of the mitochondrial control region. ICES J Mar Sci. 2006; 63: 693–
704.
54. Avise JC. Phylogeography The History and Formation of species. Cambridge, MA: Havard University Press; 2000.
55. Rambaut A, Drummond AJ. Tracer v1. 5. 2009. Available:http://beast.bio.ed.ac.uk. Accessed 23 Au-gust 2013.
56. Tajima F. Statistical method for testing the neutral mutation hypothesis by DNA polymorphism. Genet-ics. 1989; 123: 585–595. PMID:2513255
57. Fu Y-X. Statistical Tests of Neutrality of Mutations Against Population Growth, Hitchhiking and Back-ground Selection. Genetics. 1997; 147: 915–925. PMID:9335623
58. Ray N, Currat M, Excoffier L. Intra-Deme Molecular Diversity in Spatially Expanding Populations. Mol Biol Evol. 2003; 20: 76–86. PMID:12519909
59. Gaither MR, Toonen RJ, Robertson DR, Planes S, Bowen BW. Genetic evaluation of marine bio-geographical barriers: perspectives from two widespread Indo-Pacific snappers (Lutjanus kasmiraand
Lutjanus fulvus). J Biogeogr. 2010; 37: 133–147.
60. Gaither MR, Jones SA, Kelley C, Newman SJ, Sorenson L, Bowen BW. High connectivity in the deep-water snapperPristipomoides filamentosus(Lutjanidae) across the Indo-Pacific with isolation of the Hawaiian archipelago. PLoS One. 2011; 6: e28913. doi:10.1371/journal.pone.0028913PMID: 22216141
61. Karlsson S, Saillant E, Gold JR. Population structure and genetic variation of lane snapper (Lutjanus
synagris) in the northern Gulf of Mexico. Mar Biol. 2009; 156: 1841–1855.
62. Rocha LA, Bass AL, Robertson DR, Bowen BW. Adult habitat preferences, larval dispersal, and the comparative phylogeography of three Atlantic surgeonfishes (Teleostei: Acanthuridae). Mol Ecol. 2002; 11: 243–252. PMID:11856425
63. Rocha LA. Patterns of distribution and processes of speciation in Brazilian reef fishes. J Biogeogr. 2003; 30: 1161–1171.
64. Floeter SR, Rocha LA, Robertson DR, Joyeux JC, Smith-Vaniz WF, Wirtz P, et al. Atlantic reef fish bio-geography and evolution. J Biogeogr. 2008; 35: 22–47.
65. Gold JR, Saillant E, Cummings NJ, Renshaw MA. Genetic Divergence and Effective Size among Lane Snapper in U. S. Waters of the Western Atlantic Ocean. North Am J Fish Manag. 2011; 31: 209–223. 66. Hogan JD, Fisher R, Nolan C. Critical swimming speed of settlement-stage coral reef fishes from the
Caribbean: a methodological and geographical comparison. Bull Mar Sci. 2007; 80: 219–231. 67. Peterson RG, Stramma L. Upper-level circulation in the South Atlantic Ocean. Prog Ocean. 1991; 26:
1–73.
68. Rodríguez-Rey GT, Solé-Cava AM, Lazoski C. Genetic homogeneity and historical expansions of the slipper lobster,Scyllarides brasiliensis, in the south-west Atlantic. Mar Freshw Res. 2014; 65: 59–69. 69. Wieman A. C, Berendzen PB, Hampton KR, Jang J, Hopkins MJ, Jurgenson J, et al. A panmictic fiddler
crab from the coast of Brazil? Impact of divergent ocean currents and larval dispersal potential on ge-netic and morphological variation inUca maracoani. Mar Biol. 2013; 161: 173–185.
71. Gomes G, Schneider H, Vallinoto M, Santos S, Orti G, Sampaio I. CanLutjanus purpureus(South red snapper) be“legally”considered a red snapper (Lutjanus campechanus)? Genet Mol Biol. 2008; 31: 372–376.
72. Varela AI, Ritchie PA, Smith PJ. Low levels of global genetic differentiation and population expansion in the deep-sea teleostHoplostethus atlanticusrevealed by mitochondrial DNA sequences. Mar Biol. 2012; 159: 1049–1060.
73. Hoarau G, Boon E, Jongma DN, Ferber S, Palsson J, Van der Veer HW, et al. Low effective population size and evidence for inbreeding in an overexploited flatfish, plaice (Pleuronectes platessaL.). Proc R Soc London Ser B. 2005; 272: 497–503.
74. Pinsky ML, Palumbi SR. Meta-analysis reveals lower genetic diversity in overfished populations. Mol Ecol. 2014; 23: 29–39. doi:10.1111/mec.12509PMID:24372754
75. de Oliveira JN, Gomes G, Rêgo PS, Moreira S, Sampaio I, Schneider H, et al. Molecular Data Indicate the Presence of a Novel Species ofCentropomus(Centropomidae—Perciformes) in the Western At-lantic. Mol Phylogenet Evol. 2014; 77: 275–280. doi:10.1016/j.ympev.2014.04.019PMID:24792089 76. Phillips NM, Chaplin JA, Morgan DL, Peverell SC. Population genetic structure and genetic diversity of
three critically endangeredPristissawfishes in Australian waters. Mar Biol. 2011; 158: 903–915. 77. Bellwood DR, Wainwright PC. The History and Biogeography of Fishes on Coral Reefs. In: Sale PF,
ed-itor. Coral reef fishes: dynamics and diversity in a complex ecosystem. New York, USA: Academic Press; 2002. pp. 5–32.
78. Hewitt GM. Genetic consequences of climatic oscillations in the Quaternary. Philos Trans R Soc Lond B Biol Sci. 2004; 359: 183–195. PMID:15101575
79. Hoareau TB, Boissin E, Berrebi P. Evolutionary history of a widespread Indo-Pacific goby: the role of Pleistocene sea-level changes on demographic contraction/expansion dynamics. Mol Phylogenet Evol. 2012; 62: 566–572. doi:10.1016/j.ympev.2011.10.004PMID:22037473
80. Eytan RI, Hellberg ME. Nuclear and mitochondrial sequence data reveal and conceal different demo-graphic histories and population genetic processes in Caribbean reef fishes. Evolution 2010; 64: 3380–3397. doi:10.1111/j.1558-5646.2010.01071.xPMID:20584072
81. Rocha LA, Rocha CR, Robertson DR, Bowen BW. Comparative phylogeography of Atlantic reef fishes indicates both origin and accumulation of diversity in the Caribbean. BMC Evol Biol. 2008; 8: doi:10. 1186/1471-2148-8-157.
82. Sachs JP, Anderson RF, Lehman SJ. Glacial surface temperatures of the southeast Atlantic Ocean. Science. 2001; 293: 2077–2079. PMID:11557890
83. Wallace RK. Thermal acclimation, upper temperature tolerance, and preferred temperature of juvenile yellowtail snappers,Ocyurus chrysurus(Bloch)(Pisces: Lutjanidae). Bull Mar Sci. 1977; 27: 292–298. 84. Fernández Iriarte PJ, Pía Alonso M, Sabadin DE, Arauz PA, Iudica CM. Phylogeography of weakfish
Cynoscion guatucupa(Perciformes: Sciaenidae) from the southwestern Atlantic. Sci Mar. 2011; 75:
701–706.
85. Barreto AMF, Bezerra FHR, Suguio K, Tatumi SH, Yee M, Paiva RP, et al. Late Pleistocene marine ter-race deposits in northeastern Brazil: sea-level change and tectonic implications. Palaeogeogr Palaeo-climatol Palaeoecol. 2002; 179: 57–69.
86. Khodri M, Leclainche Y, Ramstein G, Braconnot P, Marti O, Cortijo E. Simulating the amplification of or-bital forcing by ocean feedbacks in the last glaciation. Nature. 2001; 410: 570–574. PMID:11279492 87. Selkoe KA, Gaggiotti OE, TOBO Laboratory, Bowen BW, Toonen R. Emergent patterns of population genetic structure for a coral reef community. Mol Ecol. 2014; 23: 3064–3079. doi:10.1111/mec.12804 PMID:24866831
88. Gaither MR, Toonen RJ, Bowen BW. Coming out of the starting blocks: extended lag time rearranges genetic diversity in introduced marine fishes of Hawai’i. Proc Biol Sci. 2012; 279: 3948–3957. doi:10. 1098/rspb.2012.1481PMID:22874747