R E S E A R C H A R T I C L E
Open Access
Shared and divergent pathways for flower
abscission are triggered by gibberellic acid
and carbon starvation in seedless Vitis
vinifera L
Sara Domingos
1,2, Joana Fino
2,3, Vânia Cardoso
2, Claudia Sánchez
4, José C. Ramalho
1,2,5, Roberto Larcher
6,
Octávio S. Paulo
3, Cristina M. Oliveira
1and Luis F. Goulao
2,7*Abstract
Background: Abscission is a highly coordinated developmental process by which plants control vegetative and reproductive organs load. Aiming at get new insights on flower abscission regulation, changes in the global transcriptome, metabolome and physiology were analyzed in‘Thompson Seedless’ grapevine (Vitis vinifera L.) inflorescences, using gibberellic acid (GAc) spraying and shading as abscission stimuli, applied at bloom.
Results: Natural flower drop rates increased from 63.1 % in non-treated vines to 83 % and 99 % in response to GAc and shade treatments, respectively. Both treatments had a broad effect on inflorescences metabolism. Specific impacts from shade included photosynthesis inhibition, associated nutritional stress, carbon/nitrogen imbalance and cell division repression, whereas GAc spraying induced energetic metabolism simultaneously with induction of nucleotide biosynthesis and carbon metabolism, therefore, disclosing alternative mechanisms to regulate abscission. Regarding secondary metabolism, changes in flavonoid metabolism were the most represented metabolic pathways in the samples collected following GAc treatment while phenylpropanoid and stilbenoid related pathways were predominantly affected in the inflorescences by the shade treatment. However, both GAc and shade treated inflorescences revealed also shared pathways, that involved the regulation of putrescine catabolism, the repression of gibberellin biosynthesis, the induction of auxin biosynthesis and the activation of ethylene signaling pathways and antioxidant mechanisms, although often the quantitative changes occurred on specific transcripts and metabolites of the pathways.
Conclusions: Globally, the results suggest that chemical and environmental cues induced contrasting effects on inflorescence metabolism, triggering flower abscission by different mechanisms and pinpointing the participation of novel abscission regulators. Grapevine showed to be considered a valid model to study molecular pathways of flower abscission competence acquisition, noticeably responding to independent stimuli.
Keywords: Flower shedding, Gibberellin, Grapevine, Light reduction, Metabolomics, RNA-Seq
* Correspondence:[email protected]
2Instituto de Investigação Científica Tropical, I.P. (IICT), Lisbon, Portugal 7Present address: Colégio Food, Farming and Forestry, Universidade de
Lisboa (ULisboa), Lisbon, Portugal
Full list of author information is available at the end of the article
© 2016 Domingos et al. Open Access This article is distributed under the terms of the Creative Commons Attribution 4.0 International License (http://creativecommons.org/licenses/by/4.0/), which permits unrestricted use, distribution, and reproduction in any medium, provided you give appropriate credit to the original author(s) and the source, provide a link to the Creative Commons license, and indicate if changes were made. The Creative Commons Public Domain Dedication waiver (http://creativecommons.org/publicdomain/zero/1.0/) applies to the data made available in this article, unless otherwise stated.
Background
Abscission is the developmental mechanism by which plants are able to shed damaged and excessively formed organs, regulating the metabolic energy required to suc-cessfully attain the formation of vegetative and reproduct-ive structures [1]. Abscission encompasses a complex but precise regulation of cell separation that occurs in a spe-cific layer of specialized cells known as abscission zone (AZ) and is simultaneously activated by and responsive to endogenous and exogenous signals, such as abiotic and biotic interactions or exposure to chemical molecules [2, 3]. Once the AZ is properly differentiated, AZ cells acquire competence to respond to triggering-abscission signals through hormone-mediated pathways. After the activation phase, by modulating the expression of genes involved, among others, in cell wall (CW) remodeling and protein metabolism, and a high number of transcription factors, cell separation and differentiation of a protective layer on the proximal side after organ detachment ad-vance as last steps of the abscission process [4, 5]. Accord-ing to the currently accepted model, the endogenous flow level of inhibitory auxin in an organ destined to abscise must drop to acquire sensitivity to ethylene [6, 7]. Abscisic acid (ABA) is involved by acting as modulator of 1-aminocyclopropane-1-carboxylic acid (ACC) levels, and therefore of ethylene biosynthesis [8]. Increased ethylene biosynthesis is associated with the final events of abscis-sion activation, namely by promoting CW disassembly-related genes transcription [9, 10]. Increased levels of reactive oxygen species (ROS) have a pivotal role in organ abscission control, encompassing multiple steps of signaling, downstream from ethylene, and associated with ROS-sugar-hormone cross talk [11–14].
In reproductive organs, abscission is also related to lower carbohydrate and polyamine (PA) availability to developing flowers and fruits [15–18]. Together with its role as energy source, glucose acts as a repressing signal of programmed cell death (PCD) [19]. A glucose gradient in the AZ was recently suggested, similar to the auxin flux that regulates ethylene signaling [2]. In addition, the inflor-escence deficient in abscission (IDA) peptide signals and interacting receptor-like-kinases, HAESA and HAESA-like2, were showed to activate mitogen-activated protein kinase (MAPK) cascades leading to the abscission of floral organs in Arabidopsis thaliana L. [20, 21], in a signaling system that was proposed to be conserved and regulate cell separation in other plant species [22].
Strategies that stimulate flower and fruit abscission are widespread horticultural practices, collectively known as thinning. In seedless table grape (Vitis vinifera L.) production, reduction of the number of berries per bunch is mandatory to guarantee bunch quality and decrease fun-gal diseases incidence [23]. Gibberellic acid (GAc) spraying during bloom, often followed by hand adjustments, is the
most common method for thinning in grapevine [23–27], although the mechanisms by which GAc induces ab-scission remains largely unknown. Gibberellin (GA) per-ception and signaling investigated in model plants [28] disclosed early recognition via the GA INSENSITIVE DWARF1 (GID1) receptor and interaction between GA-GID complex and DELLA transcription factor re-sponsible for GA signaling repression. Binding of GA-GID1 to DELLA induces recognition of DELLA for ubiquitination by a specific F-box protein (GID2) that results in a rapid degradation of DELLAs via the ubiquitin-proteasome pathway. Recently, GA-induced changes in the transcriptome of pre-bloom inflores-cences and of berry enlargement stages in grapevine were investigated [29, 30] and the results suggested that GAc application to grape flowers and berries has a fairly comprehensive impact on their metabolism medi-ated by hormone biosynthesis and signaling, in particular through a negative feedback regulation of GAs biosyn-thesis and signaling [29, 30].
Flower abscission can also be boosted by shading conditions (70-90 % light interception) during bloom [12, 31, 32], paving the way to explore light management as an alternative thinning method. The pronounced reduc-tion of net photosynthetic rates under shading promotes the competition for photoassimilates between vegetative and reproductive organs, leading to shedding of the later with less sink strength at this early stage of development [33]. Shade-induced changes in the transcriptome of apple (Malus × domestica) revealed that photosynthesis repres-sion and associated nutrient stress is perceived at the fruit level, its growth is inhibited by a sugar transport blockage, resulting in a decreased auxin transport to the AZ and concomitant increased sensitivity to ethylene, leading to fruit abscission [18].
Therefore, abscission is a challenging biological ques-tion that can be induced by at least two distinct stimuli with distinct physiological basis. Recently, using an experi-mental assay with potted seeded vines managed under a greenhouse hydroponic production system, and thinned with GAc spraying or via shade nets to reduce intercepted light, we established an efficient method to produce sample sets with predictable abscising potential triggered by different (chemical and environmental) cues, which allowed us to disclose the participation of different meta-bolic pathways according to the imposed treatment in flower abscission regulation [12]. We now report the effect of the same abscission-inducers using a different genetic background under field conditions. The rationale was that, by using a seedless variety deprived of the main endogen-ous source of bioactive GAs [34] and developed while adapting to field multiple stresses, the major signals for abscission triggering would be perceived, providing new insights on this subject. Hence, comprehensive
cutting-edge metabolomics, RNA-Seq transcriptomics and physio-logical measurements, were performed to allow discussing how environmental (C-shortage) and GAc application act to trigger flower abscission, to identify routes linking the aptitude of an organ to become competent for cell separation and specificities and communication between different pathways leading to organ drop. In addition, the present study provides the first sequential transcriptomic atlas of GAc-induced flower abscission.
Methods
Experimental conditions and sample collection
The trail was conducted in a commercial table grape vineyard in south of Portugal (38° 05' 23.80" N; 8° 04' 52.7 1" W), using seven-year-old ‘Thompson Seedless’ (Vitis vinifera L.) vines grafted on ‘140 Ruggeri’ root-stock, spaced 3x3 m, grown under an overhead trellis system covered with plastic, and managed following standard fertilization, irrigation, and pest-management practices. Permission to access and sample at the vineyard was previous agreed under the frame of joint research partnership.
The imposed treatments were: thinning via reduction of intercepted light and chemical thinning with GAc, in five vines per treatment. An additional group of five vines remained untreated to be used as control. Shade was imposed at 50 % cap fall (stage 65 of the BBCH scale [35]) by covering the vines with polypropylene shading nets (Hubel, Portugal) that intercept 100 % of the incident photosynthetic photon flux density (PPFD), for a period of fourteen days. Chemical treatment consisted in spraying GAc solution (Berelex with 9 % of GAc, Kenogard) at 10 ppm, 12.5 ppm and 12.5 ppm, applied sequentially at 20 %, 50 % and 100 % cap fall (stages 62, 65 and 69 of the BBCH scale, respectively).
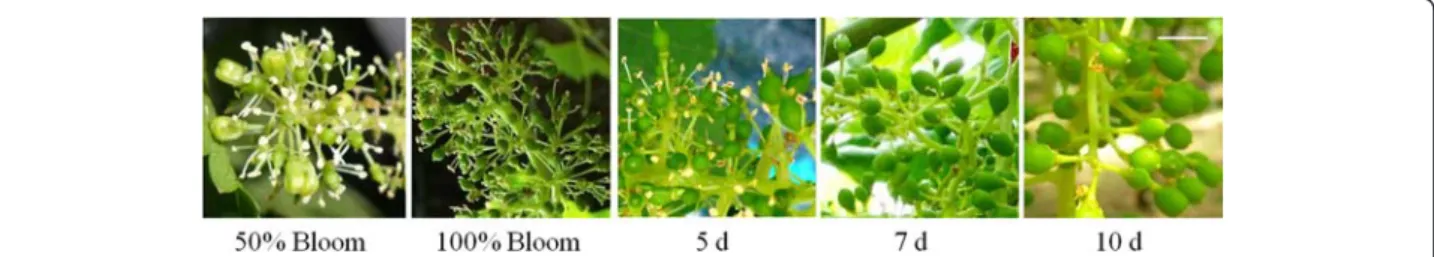
Climate conditions during the assay were monitored above the canopy of shaded and control vines (Watch-Dog MicroStation, Spectrum Tech., USA) (Additional file 1). Grape inflorescence samples were collected in a time-course assay, at three time-points: 5, 7 and 10 days after 100 % cap fall (referred to as 5d, 7d and 10d) (Fig. 1). In each point, three independent biological rep-licates were collected per treatment in the corresponding
five-vine plot. Each biological replicate is composed essentially by the flowers with their pedicels from an inflorescence deprived from rachis, immediately frozen in liquid nitrogen, and subsequently fine-powdered and stored at−80 °C until use.
RNA deep sequencing and bioinformatic analysis
Total RNA was extracted and purified from ca. 100 mg frozen inflorescences from each 5 and 7d biological sample, using the RNeasy Plant RNA Extraction Kit and RNase-Free DNase Set (Qiagen, Hilden, Germany) following the manufacturer’s instructions, but replacing the extraction solution for a 100 mM Tris-HCl, 2 % (w/v) CTAB, 25 mM EDTA and 2 M NaCl buffer [36]. When traces of contaminant genomic DNA were detected after standard PCR amplification of the ACTIN 1 (ACT1) gene (XM_002282480.3), samples were further digested with RNase-free DNase I (Ambion, Life Techonologies, CA, USA). RNA integrity and purity were evaluated by visual inspection of ribosomal bands in 1.5 % agarose gel electro-phoresis and by 2100 Bioanalyzer (Agilent Technologies, CA, USA) readings. Poly(A) mRNA isolation, cDNA syn-thesis, library generation, indexing, cluster generation and RNA-Seq analyses by Illumina HiSeq 2000 RNA sequen-cing of 100 bp paired-end reads was carried out by LGC Genomics (Berlin, Germany), using commercial services.
The raw Illumina 100-bp pair-end sequences were deposited in the NCBI Sequence Read Archive (SRA). The reads were quality trimmed using Trimmomatic version 0.32 [37], and surveyed for the presence of rRNA contamination using homology searches against rRNA databases [38]. Alignment against the Vitis vinifera refer-ence genome [39] was then performed with the software Tophat2 version 2.0.12 [40] set with the parameters -D 15 -R 2 -L 22 -i S,1,1.15 and end-to-end mode. Quantifi-cation and normalization of gene expression values by Fragments Per Kilobase Of Exon Per Million Fragments Mapped (FPKM) was calculated by Cufflinks version 2.2.1 [41]. Differential expression calculations were handled by DESeq2 version 1.4.5 [42] considering estimation of size factors, a false discovery rate (FDR) of 0.05 and a -1.5≥ log2 fold-change≥ 1.5, using the raw read counts.
Fig. 1 Aspect of 'Thompson Seedless' inflorescences from 50 % cap fall to 10 days after 100 % cap fall. Samples were collected at 5, 7 and 10 days after 100 % cap fall (5, 7 and 10d). Scale bar corresponds to 0.6 cm
EuKaryotic Orthologous Groups (KOG) [43], Gene Ontology (GO) and Kyoto Encyclopedia of Genes and Genomes (KEGG) [44] functional annotations were based on sequence homologies against public databases. Rap-search2 [45] with an e-value cut-off of 10−5 was used to search against Arabidopsis thaliana sequences in the KOG database and non-redundant (“nr”) peptide database (ftp:// ftp.ncbi.nlm.nih.gov/blast/db/ downloaded at November 26, 2013, including all “nr” GenBank CDS translations + PDB + SwissProt + PIR + PRF). To GO and KEGG annota-tions, the output was submitted to an in-house developed script - Rapsearch2XML (https://github.com/Nymeria8/ Rapsearch2Xml) and then to Blast2GO [46]. GO enriched categories were identified using the R bioconductor pack-age topGO version 2.18.0 [47], using a Fisher's exact test and a p-value≤ 0.01.
Data validation by gene expression quantification and correlation between replicates analyses
Aliquots (150 ng) of the same RNA samples extracted as per 2.1 were used for first-strand cDNA synthesis by M-MLV Reverse Transcriptase (Invitrogen), according to the manufacturer’s instructions. The expression of eight genes with significant differences on RNA-seq analysis, involved in auxin and ethylene signaling pathways [9, 48] and mitogen-activared protein kinase cascades [20] puta-tively related to flower abscission regulation, was assessed by q-rtPCR. Their specific primer sequences and proper-ties are given in Additional file 2. qRT–PCR amplifi-cations were conducted in a qTOWER 2.0 (Analytikjena, Germany) thermal cycler in 15μL reactions containing 1× SsoAdvanced™ SYBR®Green Supermix (Bio-Rad), 0.3 μM each primer and 90 ng cDNA.
The amplification cycling profile was: 95 °C during 30 s; then 40 cycles at 95 °C for 5 s and 60 °C for 30 s. Melting curves were generated to confirm amplification of single products and absence of primer dimerization. For each primer pair, PCR amplification efficiencies were calculated via a calibration dilution curve and slope calculation, using the equation E(%) = (10[−1/slope]) × 100 [49]. Data normalization was conducted based on quan-tification threshold cycle (Ct) values with respect to the geometric average of the Ct of 3 reference genes [50], polyubiquitin (XM_002282083.2), actin (XM_002282480.3) and glyceraldehyde-3-phosphate dehydrogenase (XM_ 002263109.2). Each analysis was performed in duplicate technical reactions, in each of the three biologic replicates per treatment and condition. To obtain measurements of the correlation between RNA-seq and qRT-PCR data, linear regression and determination coefficient (R2) were determined between the two methods obtained log2
fold-changes for the same eight genes.
To further investigate the robustness of our RNA-seq dataset, similarity of expression profiles between the
three biological replicates was determined by Pearson correlation coefficient (PCC) analyses with R 3.1.2 soft-ware using natural logarithm (ln)-transformed read counts for the differentially expressed genes (DEG) as input.
Global and targeted metabolomic profiling
Circa 200 mg of powdered material from each of the three biological replicates collected at 5d and 7d for each treatment were lyophilized, extracted with methanol and analyzed using the integrated platform developed by Metabolon® (Durham, USA) consisting of a combination of three independent approaches: ultrahigh perform-ance liquid chromatography/tandem mass spectrometry (UHLC/MS/MS2) optimized for basic species, UHLC/ MS/MS2 optimized for acidic species, and gas chromatog-raphy/mass spectrometry (GC/MS). Methods were per-formed as previously described [51–53]. For UHPLC/MS/ MS2 analysis, aliquots were separated using a Waters Acquity UHPLC (Massachusetts, USA) and analyzed using a LTQ linear ion trap mass spectrometer (Thermo Fisher Scientific Inc., Massachusetts, USA). Each extract was monitored for positive or negative ions in independent injections using separate acid/base dedicated 2.1 mm × 100 mm Waters BEH C18 1.7μm particle columns, heated to 40 °C. The MS interface capillary was maintained at 350 °C. The spray voltage for the positive ion injection was 4.5 kV, and 3.75 kV for the negative ion injection. The instrument scanned 99-1000 m/z and alternated between MS and MS/MS using dynamic exclusion with approxi-mately 6 scans per second. MS/MS normalized collision energy was set to 40, activation Q 0.25, and activation time 30 ms, with a 3 m/z isolation window. MS/MS scans were collected using dynamic exclusion with an exclusion time of 3.5 s. Derivatized samples for GC/MS were separated on a 5 % phenyldimethyl silicone column with helium as the carrier gas and a temperature ramp from 40 °C to 300 °C and then analyzed on a Thermo-Finnigan Trace DSQ MS (Thermo Fisher Scientific Inc., Massachusetts, USA) oper-ated at unit mass resolving power with electron impact ionization and a 50–750 atomic mass unit scan range.
Metabolites were identified by automated comparison of the ion features in the experimental samples to a reference library of chemical standard entries that in-cluded retention time, molecular weight (m/z), preferred adducts, and in-source fragments as well as associated MS/MS2 spectra (Additional file 3) and curated by visual inspection for quality control using a software developed at Metabolon Inc [53]. Raw area counts for each biochem-ical compound were rescaled by dividing each sample’s value by the median value for the specific biochemical. Welch’s two-sample t-tests were then used to determine whether or not each metabolite had significantly increased or decreased in abundance using Array Studio software (Omicsoft) and Microsoft Excel® spreadsheets. Mapping of
metabolites was performed onto general biochemical pathways, as provided in the Kyoto Encyclopedia of Genes and Genomes (KEGG) (www.genome.jp/kegg/) and Plant Metabolic Network (PMN) (www.plantcyc.org/).
Hormone (indole-3-acetic acid (IAA), abscisic acid (ABA), GA1, GA4, GA8, GA9, GA12, GA20, GA34, GA53)
extraction and quantification were performed [54] in 5d, 7d and 10d inflorescence samples. Starting from lyophi-lized ca. 300 mg weighed aliquots per sample, 15 μL samples were injected on an Acquity UPLC BEH C18 column (1.7 μm film thickness, 2.1 mm × 100 mm; Waters) mounted into an Acquity UPLC Waters equipped with a Xevo TQ MS mass spectrometer (Waters Corpor-ation, Milford, USA). Flow rate was set at 0.45 mLmin−1 and column temperature at 40 °C. Eluent A was a 0.1 % formic acid in a 2 mM ammonium acetate solution and eluent B was methanol with 0.1 % formic acid in a 2 mM ammonium acetate solution. Chromatographic separation was obtained using the following gradient for solvent B: 2 % for 0.5 min, raised to 95 % in 7.25 min, then held at 95 % for 1 min, and back to 2 % in 0.01 min. Column reconditioning was performed holding B at 2 % per 3 min before each injection. The transitions are reported in Additional file 4. Sugar (glucose, sucrose, fructose and stachyose) and free PA (putrescine, spermine, spermidine and cadaverine) contents from inflorescence samples collected at same time points were extracted and quanti-fied by high performance liquid chromatography (HPLC) as previous described by [12]. To access the significance of the differences between treatments, one-way ANOVA and Tukey HSD test at p-value≤ 0.05 were performed using Statistix9 software.
Exploratory analysis of transcriptome and metabolome profile
Data regarding transcript and metabolite quantification was natural logarithm (ln) –transformed for adjustment to normal distribution and verified by histogram plot-ting, using the R software before and after the trans-formation. Principal Coordinate Analysis (PCoA) was conducted based on the pair-wise correlation matrix using the NTsys-PC 2.20e software [55]. The DCENTER module was used to transform the symmetric matrix to scalar product and EIGEN for eigenvalues decompos-ition to identify orthogonal components of the original matrix modules. The minimum-spanning tree was calcu-lated allowing the visualization of the distances between operational units. R software was used for Orthogonal Signal Correction Partial Least Squares Discriminant Analysis (O-PLS-DA) and heatmap construction with associated hierarchical clustering. Approximately unbiased and bootstrap probability p-values were calculated using pvclust version 1.3.2 [56] with UPGMA method and 1000 bootstrap replications.
Vine physiology and final bunch morphology assessment
Flower drop was monitored with resource to non-woven cloth bags positioned around 10 bunches per treatment at full bloom and kept until 10d (days after 100 % cap fall). Shoot length and primary and secondary leaf areas were determined at bloom and 15 after, in six shoots per treatment, following non-destructive methods [57]. Esti-mated leaf chlorophyll content (SPAD-502 m, Minolta, Japan) was measured twice during the shade period (2 and 9d). Leaf gas exchange were measured in the morn-ing period (9:00 am - 11:00 am) usmorn-ing a portable CO2/H2O
porometer (CIRAS-1, PPSystems, USA), on eight mature leaves from the central part of the shoots, twice during the shade period (8 and 10d) and twice after removal of the shading nets (30 and 43d). At harvest (96d), the same bunches used for flower drop monitoring, were collected and the final number of berries was recorded to calculate the flower drop percentages. Bunch weight, rachis length and bunch compactness (number of berries cm−1of rachis) were also determined. To access the significance of the dif-ferences between treatments, one-way ANOVA and Tukey HSD test were performed as previous described for tar-geted metabolite analysis.
Results
Effects of GAc and shade on leaf gas exchanges, vegetative and reproductive organs development
During bloom period, no significant differences on the day/night mean temperature and relative humidity were perceived between treatments which were in average 26/15 °C and 57/71 %, respectively (Additional file 1). Conversely, 100 % PPFD interception was observed in the shaded vines. Leaf net photosynthetic rate (Pn),
stomatal conductance (gs), vegetative growth and
chloro-phyll content were reduced, only under shaded conditions (Table 1). Increased shoot growth was observed in vines submitted to GAc treatments, when compared with shade-treated vines.
GAc and shade treatments resulted in the drop of 887 ± 74 and 955 ± 9 flowers per inflorescence, respect-ively, corresponding to 83 % and 99 %. These values were significantly higher as compared to the control (natural drop flower) that showed a loss of 569 ± 81 flowers, corre-sponding to 63.1 %. Therefore, both GAc and shade imposed treatments significantly induced flower abscis-sion, although with a higher magnitude resulting from light interception, validating our experimental setup. After shade removal, leaf gas exchange rates recovered to values not significantly different from control.
At harvest, the increased flower abscission was trans-lated in a reduced berry number and bunch compactness in both treatments (Table 2). Rachis length and bunch weight and yield were also reduced in bunches from shade-treated plants.
Transcriptome analysis
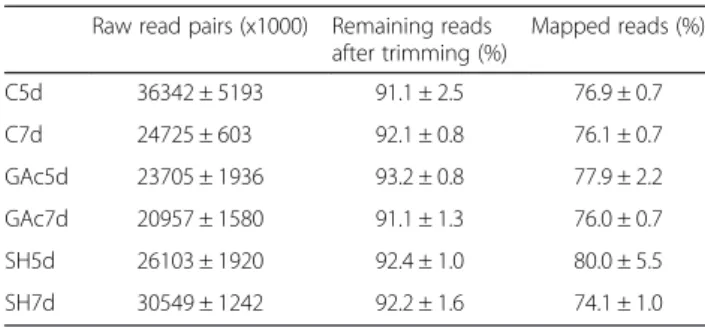
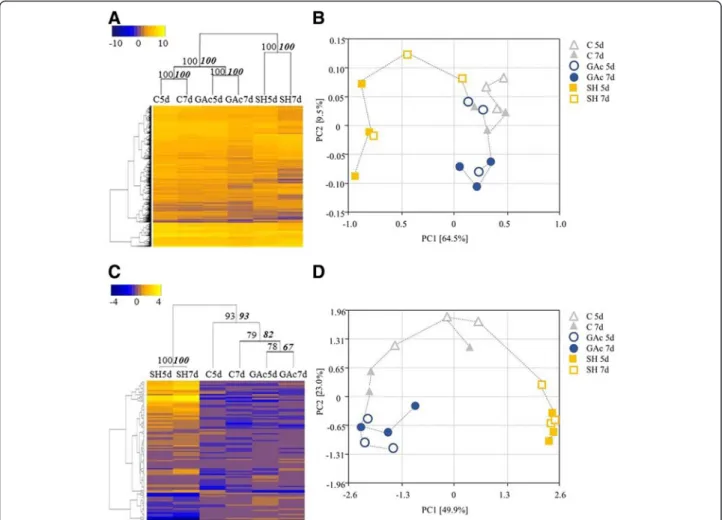
Eighteen RNA-seq 100-bp paired-end read libraries were prepared from poly(A) RNA extracted from grapevine inflorescences and an average of 27 million paired end reads were collected per each library (Table 3). Approxi-mately 8 % of the reads were trimmed based on the presence of Illumina adapters or low quality bases. After removing rRNA contamination, clean reads were obtained and the statistics of each sample mapping are showed in Additional file 5. Reads mapping to the genome sequence made up approximately 76.8 ± 1.8 % of the reads (Table 3). A total of 5581 genes were identified as differentially expressed between control and at least one of the librar-ies from treated samples (Additional file 6). The abbrevi-ations GAc5d, GAc7d, SH5d and SH7d mean the log2 fold-change between gene relative expression obtained in treated and control inflorescences, from samples collected at 5 and 7 days after 100 % cap fall. As shown in Fig. 2a, the shade treatment was responsible for the highest number of DEG, with 1781 and 5060 genes significantly showing differential expression at 5 and 7d, respectively. On the other hand, GAc treatment led to the differential expression of 192 and 173 genes, in 5d and 7d samples, respectively. According to hierarchical clustering analysis, means of expression values of sam-ples collected in the two time points investigated from each thinning treatment, were significantly clustered together (Fig. 3a). Regarding PCoA, the shade-treated biological replicates were differentiated from GAc and control ones by PC1 in both time points, whereas PC2 separated the 7d GAc-treated biological replicates from
the controls (Fig. 3b). These results indicate that, while shade treatment affected significantly the overall transcriptome dynamics both at 5 and 7d, in GAc, only in the second time sampled the treatment effect was above the biological variation between replicates. The OPLS-DA analysis of the differential expressed genes plotted by the KOG categories showed an overlap of gene functional categories (Additional file 7A). A posi-tive significant correlation was found between the log2 fold-changes from qRT-PCR and RNA-Seq transcriptomic datasets, confirming the reproducibility of RNA-Seq data (Additional file 2). In agreement, the robustness of the generated RNA-Seq dataset was further revealed by a high correlation of the transcriptome profiles among three biological replicates per treatment (Additional file 8).
Metabolome analysis
Regarding global metabolomic analysis, from the 215 metabolites searched by the global metabolic analyses conducted, a total of 105 changed its relative content in at least one of the conditions (p-value≤ 0.05) (Additional file 9). For the Fig. 2b, the abbreviations GAc5d, GAc7d, SH5d and SH7d mean the log2 fold-change between metabolite relative content obtained in treated and control inflorescences, collected after 5 and 7 days after 100 % cap fall. In samples from the GAc treatment, 30 and three metabolites changed respectively at 5 and 7d, while in shaded vines, 50 and 62 metabolites changed in the same time points (Fig. 2b). According to hierarchical clustering, the two time points of each treatment were clustered together and the different treatments were
Table 1 Effect of GAc and shade treatments on physiological measurements during shade period
Pn(μmol CO2m−2s−1) gs(mmol H2O m−2s−1) Leaf chlorophyll content
(SPAD units)
Total leaf area growth
(m2vine−1day−1) Shoot growth(cm day−1) Flower drop (%)
Control 8.7 a 83.5 a 25.6 a 0.914 a 2.9 ab 63.1 c
GAc 8.8 a 83.4 a 24.2 a 0.917 a 3.8 a 83.0 b
Shade 0.0 b 7.4 b 22.5 b 0.052 b 1.6 b 99.0 a
*** *** *** *** ** ***
Net photosynthetic rate (Pn), stomatal conductance (gs), estimated leaf chlorophyll content, total (primary and secondary) leaf area growth, shoot growth and total percentage of flower drop average values are reported. **, *** mean that the treatments are significantly different at p-value≤ 0.01 or ≤0.001 (ANOVA). Within each column, different letters indicate significant differences among treatments according to Tukey’s HSD test (p-value ≤ 0.05)
Table 2 Effect of treatments on gas exchange rates after shade period and bunch quality at harvest
Pn (μmol CO2m−2s−1) gs(mmol H2O m−2s−1) Bunch weight (g) Number of berries Rachis length (cm) Bunch compactness
Control 7.3 69.7 1479.6 a 324.2 a 48.5 a 6.8 a
GAc 8.6 81.8 821.8 ab 168.0 b 44.9 a 3.9 b
Shade 7.0 92.6 97.0 b 14.8 c 20.8 b 0.7 c
ns ns ** *** *** ***
Net photosynthetic rate (Pn) and stomatal conductance (gs) after shade period, and bunch weight, number of berries, rachis length and bunch compactness
average values are reported. ns, **, *** mean that the treatments are not significantly different, are significantly different at p-value≤ 0.01 or ≤0.001 (ANOVA). Within each column, different letters indicate significant differences among treatments according to Tukey’s HSD test (p-value ≤ 0.05)
separated with strong confidence based on bootstrap analyses (Fig. 3c). Figure 3d shows the association between biological replicates from all samples. PC1 separated shade from GAc treatment, while PC2 distinguished control replicates from treated ones, in both time points. Accord-ing to OPLS-DA, metabolites clustered by super-pathway showed specific distribution patterns (Additional file 7B). Altered metabolites derived from amino acid metabolism are identified as the major source of the variance in our data set. The results also show that component 1 clearly separated changes on metabolites from peptide
metabolism from secondary metabolites and, to a less extent, from carbohydrates, lipids and nucleotides (Additional file 7B).
Functional annotation and enrichment analysis
From the total 5581 DEG, 2079 were automatically clas-sified in KOG functional categories, 748 were manually assigned to the same categories according to the similar-ity with the automatically annotated, 393 were assigned to other functions and 2361 were classified as general or unknown function (Additional file 6). The most repre-sentative functional categories in shade-treated samples at both time points investigated were: signal transduction mechanisms, secondary metabolites biosynthesis, trans-port and catabolism, carbohydrates transtrans-port and metab-olism, transcription and posttranslational modification, protein turnover, and chaperones (Additional file 10). At the metabolite level, the most representative pathways included amino acid and peptide, carbohydrate, lipid and cofactors metabolism in both time points, whereas sec-ondary metabolism and nucleotide metabolism were most representative only at 5d and 7d, respectively.
To cope with the exploratory analysis results observed at transcriptome level (Fig. 3a), only GAc-treated sam-ples collected at 7d will be discussed. In this sample set, energy production and conversion, translation and ribo-somal structure, carbohydrates transport and metabol-ism, transcription and signal transduction mechanism functional categories were the most representative func-tional categories (Addifunc-tional file 10). Based on metabo-lome analysis, carbohydrates, amino acid and peptide, secondary metabolism, nucleotide and cofactor, prosthetic group and electron carrier metabolism were the most representative superpathways at 5d, while nucleotide, hormone and cofactors metabolisms were the only classes represented at 7d in GAc treated samples.
In addition, enzyme identification among DEG and its KEGG metabolic pathway assignment allowed identify-ing 24 and 205 enzymatic classes and 32 and 113 KEGG pathways for GAc- and shade-abscission indu-cing treatments, respectively (Additional file 11). The most representative KEGG metabolic pathways were oxidative phosphorylation and purine metabolism in GAc-treated inflorescences, and starch and sucrose metabolism and purine metabolism in shade-treated inflorescences. According to GO enrichment analysis, which demonstrate if a given pathway is predominant in our data set comparing to whole-genome background (p-value≤ 0.01, Additional file 12), 460 terms were found to be enriched. Acyclic graphs showing the top 5 and top 5-related GO terms mostly affected in treatment and time point (Additional file 13) sug-gested that genes related to electron and proton transport, oxidative phosphorylation were enriched in
Table 3 RNA-Seq data overview
Raw read pairs (x1000) Remaining reads after trimming (%) Mapped reads (%) C5d 36342 ± 5193 91.1 ± 2.5 76.9 ± 0.7 C7d 24725 ± 603 92.1 ± 0.8 76.1 ± 0.7 GAc5d 23705 ± 1936 93.2 ± 0.8 77.9 ± 2.2 GAc7d 20957 ± 1580 91.1 ± 1.3 76.0 ± 0.7 SH5d 26103 ± 1920 92.4 ± 1.0 80.0 ± 5.5 SH7d 30549 ± 1242 92.2 ± 1.6 74.1 ± 1.0
Reads number obtained in each treatment, percentage of reads after data trimming and of successfully mapped reads after rRNA contamination removal (mean of three independent biological replicates ± standard error (se))
Fig. 2 Diagram representing the number of DEG (a) and differentially changed metabolites (b) in treated inflorescences. Values indicate unigenes passing cut-off values of−1.5 ≥ log2 fold change ≥1.5 and p-value≤ 0.05for transcripts, and p-value ≤ 0.05 for metabolites affected by GAc and shade treatments relatively to the control. The list of all DEG, their respective annotation, fold-change and KOG functional category are given in Additional file 6
GAc-treated inflorescences while genes involved in re-sponse to light signal and secondary metabolism were enriched in shade samples, concerning biological processes. Among molecular functions, terms were mostly related to NADH oxidoreductase and dehydrogenase and rRNA binding in GAc-treated inflorescences, and to oxidoreduc-tase, electron carrier, tetrapyrrole binding, hydrolase, glyco-syl transferase and phenylalanine ammonia-lyase activities in shade-treated inflorescences. Regarding cellular compo-nents, the most enriched categories induced by GAc treat-ment were intracellular membrane-bounded organelle, chloroplast and cytoplasm, while apoplast, thylakoid and CW terms were enriched in shade treatment.
Effect of GAc treatment on metabolic pathways
As shown in Table 4, the specific genes most affected by GAc treatment were all up-regulated. The most
representative category was energy production and con-version, comprising genes encoding ATP synthases, cytochrome c biosgenesis protein, cytochrome oxi-dase, NADH dehydrogenases, an ATPase, and ribosomal proteins.
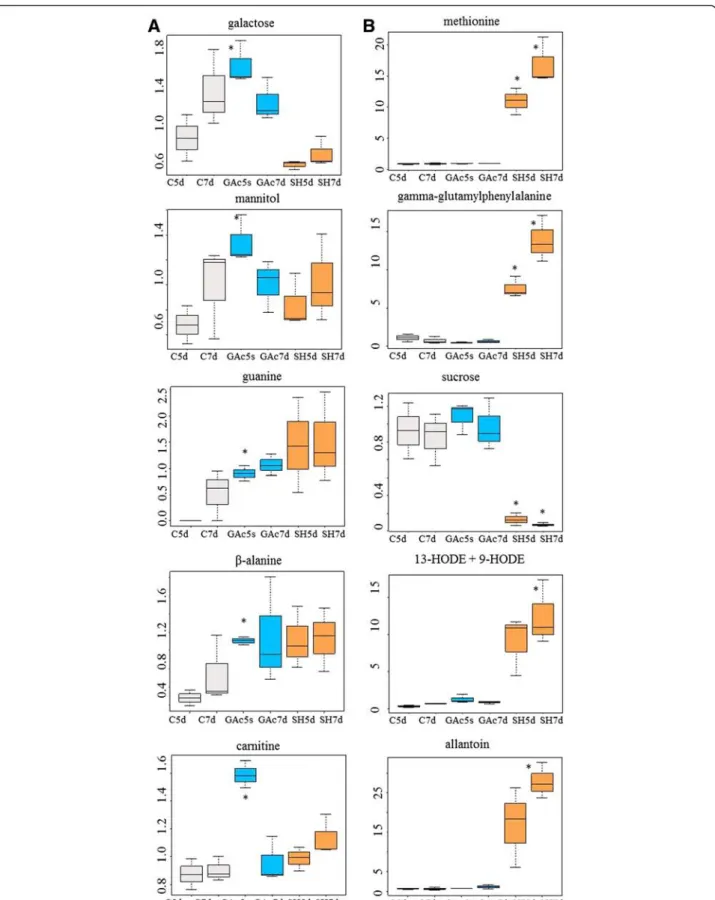
The most abundant metabolites specifically altered in result of the GAc treatment, wereβ-alanine and guanine from nucleotide metabolism, carnitine from cofactor me-tabolism and mannitol and galactose from carbohydrates metabolism (Fig. 4). Giberellate was only detected in GAc treated samples at both time points, presumably of ex-ogenous origin. Targeted metabolite analysis, allowed de-tecting increased putrescine and GA8 molecules and to
confirm the rise of GAc in GAc-treated inflorescences at 7d (Table 5). Cadaverine, IAA, GA1, GA4, GA9,
GA12, GA20, GA34, GA53 readings were below the
detec-tion threshold, so could not be quantified. Spermine,
Fig. 3 Hierarchical clustering and principal coordinate analysis (PCoA) of transcriptomic and metabolomic profile. Hierarchical clustering of expression values (a) and metabolite content (c) at different sampled stages. Each column represents the mean value for each treatment at each sampled stage (5 and 7 days after cap fall (d)). Data were ln-transformed and yellow tones represent higher values while blue tones represent lower values. The strength of dendrogram nodes was estimated with a bootstrap analysis using 1000 permutations, values represented in the left side of internal nodes are the approximately unbiased p-values (AU), bold and italic values on the right side represented the bootstrap probability value. Principal Coordinate Analysis of expression values (b) and metabolite content (d) of control (triangles), GAc (circles) and shade (squares) treated inflorescences, at 5d (open) and 7d (close), and respective biological replicates. The variance explained by each coordinate (%) is given under brackets
spermidine, glucose and fructose contents were not differ-ent between treated inflorescences and control. Due to the relatively lower number of GAc-induced alterations particularly when compared to those triggered by shade imposition, it was possibly to map it onto simplified meta-bolic pathways (Fig. 5).
Changes on carbohydrate, cofactor, amino acid and nucleotide metabolism and energy production processes
Glucose-6-phosphate (G6P), fructose-1,6-bisphosphate (F1,6P2) and mannose-6-phosphate (M6P), fructose and mannose levels were reduced, while mannitol, which can be synthesized via M6P degradation, and galactose increased in inflorescences from GAc-treated vines. Enhanced photosynthetic and respiratory metabolisms can be hypothesized based on the up-regulation of genes encoding photosystem I and II associated pro-teins, ribulose-1,5-bisphosphate carboxylase-oxygenase (RuBisCO, EC 4.1.1.39), NADH dehydrogenases (EC 1.6.5.3) and cytochrome-c oxidases (EC 1.9.3.1) and increased glycolate relative content (Additional file 6). Isocitrate relative content decrease and fumarate increase were observed, both associated with the TCA cycle. Cofac-tors metabolism was also affected, as disclosed by de-creased relative contents of nicotianamine and inde-creased nicotinamide and carnitine.
Amino acid and nucleotide pathways were favored in response to GAc treatment comparing to controls, as revealed by increased lysine, isoleucine and polyamine metabolisms and increased pyrimidine and purine metab-olisms, respectively (Fig. 5). Conversely N-acetylputrescine levels, involved in putrescine degradation declined. Genes encoding nucleoside-triphosphatase (EC 3.6.1.15), RNA polymerases (EC 2.7.7.6) and H+-translocating ATPase (EC 3.6.3.6) were up-regulated.
Changes on hormone biosynthesis, transcription factors and lipid and secondary metabolism
A gene encoding an S-beta-glucosyltransferase (EC 2.4.1.195) involved in indole-3-acetic acid (IAA) bio-synthesis and secondary metabolism, was up-regulated following GAc treatment.
The down-regulation of a gene encoding a gibberellin 3-beta-dioxygenase (GA3ox) (EC 1.14.11.15) was disclosed and ETHYLENE-RESPONSIVE TRANSCRIPTION FAC-TOR RAP2-3 (ERF RAP2-3) was the only transcript of hormone signaling pathways affected by GAc (Table 11). The expression of a gene encoding a thioredoxin per-oxidase (EC 1.11.1.15) and the relative content of β-tocopherol, associated to reactive oxygen species (ROS) detoxification mechanism were also affected.
As showed in Fig. 5, among lipid-related pathways, gly-cerolipid and glycerophospholipid metabolism, fatty acid degradation and linoleic acid metabolism were represented.
Secondary metabolic pathways were also significantly altered with the increase of salidroside, naringenin and quercetion-3-O-glucoside, 2,4,6-trihydroxybenzoate and arbutin contents and down-regulation of genes encod-ing a peroxidase (EC 1.11.1.7) and a hyoscyamine 6-dioxygenase (EC 1.14.11.9), acting in phenylpropanoids, flavonoids and benzenoids biosynthesis and metabolism pathways. Two genes from MYB transcription factors family were down-regulated (Additional file 6).
Effect of shade treatment on metabolic pathways
Shade imposition resulted in a more pronounced change in the number of genes differentially transcribed and me-tabolites differentially accumulated than GAc spraying (Tables 4 and 6, Fig. 4). As shown in Table 6, secondary metabolism-related genes encoding a specific MYB tran-scription factor, flavonol synthase and chalcone synthase,
Table 4 List of top ten DEG specific of GAc treatment
Gene ID GAc5d GAc7d Annotation UniprotKB Functional category
VIT_09s0070g00890 1.96 Ribosomal protein S7 F6I3F7 Translation, rib. struct. and biog.
VIT_00s0246g00230 1.98 Cytochrome oxidase subunit III, predicted F6HML2 Energy product. and conversion VIT_10s0003g04310 2.00 Vacuolar H + -ATPase V0 sector, subunits c/c' D7TKE9 Energy product. and conversion VIT_08s0056g01050 2.03 NADH dehydrogenase subunit 1 (chloroplast) F6HMW3 Energy product. and conversion
VIT_14s0030g00680 2.05 Ribosomal protein S4, predicted D7TUX0 Translation, rib. struct. and biog.
VIT_00s0198g00060 2.06 Ribosomal protein S7, predicted F6I245 Translation, rib. struct. and biog.
VIT_00s0246g00170 2.10 Cytochrome c biogenesis protein (chloroplast) F6HMK6 Energy product. and conversion VIT_00s0854g00040 1.50 2.11 NADH dehydrogenase subunit 4 (mitochondrion) F6HWW5 Energy product. and conversion
VIT_09s0002g00310 2.21 ATP synthase F0 subunit 6, predicted D7TZJ7 Energy product. and conversion
VIT_14s0036g01270 1.55 2.44 ATP synthase F0 subunit 6, predicted E0CU73 Energy product. and conversion Gene code identification, fold-change, annotation, UniProtKB accession number and KOG functional category are showed. Data were obtained from 3 independent biological replicates
Fig. 4 Relative content evolution of the top five metabolites specific of GAc (a) and shade (b) treatments. Asterisks identify which treatment is different from the control. Data were scale imputed median = 1. Gray, blue, and orange represent samples from control, GAc and shade treatments, respectively. Data were obtained from 3 independent biological replicates
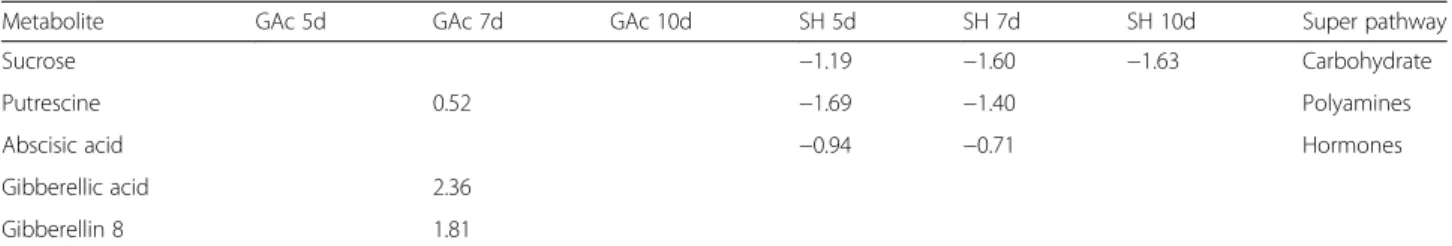
Table 5 Changes on metabolite relative content assessed by target chromatography in treated inflorescence comparing to control
Metabolite GAc 5d GAc 7d GAc 10d SH 5d SH 7d SH 10d Super pathway
Sucrose −1.19 −1.60 −1.63 Carbohydrate
Putrescine 0.52 −1.69 −1.40 Polyamines
Abscisic acid −0.94 −0.71 Hormones
Gibberellic acid 2.36
Gibberellin 8 1.81
Metabolite, respective fold-change and super pathway are reported. Data were obtained from 3 independent biological replicates
Fig. 5 Changes on transcriptomic and metabolic profiles mapped onto simplified metabolic pathways, observed in GAc-treated inflorescences. Red and green squares represent down and up-regulation of the transcripts, respectively. Gene description and fold-change corresponding to enzyme codes are given in Additional file 11. Red and green arrows represent decreased and increased metabolite accumulation, respectively. Description of enzyme codes: 1.11.1.7 - peroxidase; ec:1.14.11.15 - 3beta-dioxygenase; 1.14.11.9 - 3-dioxygenase; 1.14.14.1 - monooxygenase; 1.6.5.3 - reductase (H + translocating); 1.9.3.1 cytochromec oxidase; 2.4.1.195 Sbetaglucosyltransferase; 3.1.1.3 lipase; 3.6.1.15 nucleosidetriphosphatase; 3.6.3.6 -ATPase; 4.1.1.39 - carboxylase
genes encoding a cullin protein, a sugar transporter, stem-specific proteins and a small GTPase protein were the most significantly induced genes, specific for the shade treatment.
The most affected metabolites, specifically as result of the shade treatment (Fig. 4b) derived from amino acid and peptide (methionine and gamma-glutamylphenylalanine), carbohydrate (sucrose), lipid (13-HODE + 9HODE) and nucleotide (allantoin) metabolisms. Targeted metabolite analysis confirmed the reduction of putrescine and su-crose contents detected in global metabolomic analysis, and provided additional data of a significant decrease of ABA levels 5 and 7d in inflorescences sampled from shade treated plants.
Changes on amino acid, peptide and nucleotide metabolism
Amino acids metabolism was largely affected by shade treatment at the transcriptomic level, inducing alter-ations in phenylalanine, cysteine, methione, glycine, serine and threonine-related pathways, followed by ala-nine, aspartate, argiala-nine, glutamate, glutamine, tyrosine, tryptophan, valine, leucine, isoleucine, proline and poly-amine related paths. This result also observed regarding changes in metabolite accumulation, which encompass increased abundance of 30 amino acids or amino acid-related metabolites and reduced shikimate, putrescine and 4-acetamidobutanoate relative contents in shaded inflorescences. Glutathione and γ-glutamil peptides accumulation was likewise favored in shade treatment (Additional file 6 and Additional file 9).
DEG associated with purine and pyrimidine nucleo-tides metabolisms were predominantly up-regulated in result of the shade treatment and the same pattern was observed in associated metabolites, except for guanosine and inosine abundance.
Changes on carbohydrate metabolism, transport and signaling pathways
Carbohydrate-related pathways were mostly repressed in shaded inflorescences, including photosynthesis, chloro-phyll metabolism, carbon fixation, glycolysis, pyruvate metabolism, TCA cycle, starch and sucrose metabolism, pentose phosphate pathway, fructose and mannose me-tabolism, amino sugar and nucleotide sugar meme-tabolism, galactose metabolism, pentose and glucuronate intercon-versions and inositol phosphate metabolisms. At the metabolomic level, malate, citromalate, 2-ketogulonate, gluconate, xylose, inositol, glucose and sucrose decreased while fumarate, arabonate and xylonate were showed to increase in samples from the shade treatment.
Alterations on sugar signaling pathways and transport were induced by shade treatment during bloom, as dis-played in Table 7. Genes encoding sugar metabolizing en-zymes such as threalose-6-phosphate synthases, sucrose synthases and invertases showed a global up-regulation pattern. Genes encoding glucose-6-phosphate transloca-tors and sugar transporter SWEET1 and 3 were predom-inantly down-regulated, whereas genes encoding sugar transporter SWEET2 and 10, putative hexose transporter and sugar transporters ERD6-like, implicated in transport of sugars out of the vacuole in C-starvation conditions [58] were up-regulated.
Changes on hormone metabolism and signaling pathways
In what concerns hormone metabolism and signaling pathways, genes involved in ethylene and auxin related pathways were highly represented in samples from the thinning by shade treatment (Table 8). Genes encoding S-adenosylmethionine synthase (SAM-S) were down-regulated while the expression of genes encoding ACC oxidases, ETHYLENE INSENSITIVE 3-LIKE (EIN3) and
Table 6 List of top ten DEG specific of shade treatment
Gene ID SH5d SH7d Annotation UniprotKB Functional category
VIT_11s0016g01320 −6.51 Transcription factor MYB, predicted F6HGP6 Transcription
VIT_18s0001g03470 −3.26 −5.70 Flavonol synthase, predicted F6H0T8 Secondary metab. bios. transp. cat.
VIT_04s0043g00650 −5.63 Cullin-1 isoform 1, predicted Cell cycle control, cell div., chrom. part.
VIT_14s0068g00930 −2.50 −5.32 Chalcone synthase Secondary metab. bios. transp. cat
VIT_18s0001g11010 5.42 Ca2+independent phospholipase A2, predicted F6H017 Lipid transport and metabolism
VIT_13s0019g03070 3.31 5.46 Small heat-shock protein Hsp26, predicted F6HNN6 Posttranslational mod., protein turn., chap. VIT_05s0020g02170 3.99 5.73 Sugar transporter ERD6-like 16-like, predicted F6HDJ1 Carbohydrate transport and metabolism
VIT_00s0561g00020 3.86 5.73 Stem-specific protein TSJT1-like D7TYY3 Other
VIT_02s0033g00830 5.75 GTPase Rab11/YPT3, predicted F6I079 Intracellular traff., secretion, vesic. transp. VIT_00s0586g00030 3.91 5.80 Stem-specific protein TSJT1-like , predicted D7UE87 Other
Gene code identification, fold-change, annotation, UniProtKB accession number and KOG functional category. Data were obtained from 3 independent biological replicates
ERFs showed predominantly an up-regulation. Auxin biosynthetic pathway from thyptophan was favored as suggested by the up-regulation of a tryptophan aminotransferase-related gene. Genes encoding auxin binding proteins (ABP) and transport inhibitor response 1 (TIR1) auxin receptors were up-regulated, while Aux/IAA,
AUXIN RESPONSIVE FACTOR (ARF) and AUXIN
EF-FLUX CARRIERS (AEC) were down-regulated. The syn-thesis of indole-3-acetic acid (IAA)-amino acid conjugates was induced by the up-regulation of GH3.9 gene at 5d.
The expression of genes encoding gibberellin20-oxidase (GA20ox), gibberellin3-beta-dioxygenase (GA3ox)
and gibberellin2-oxidase (GA2ox) was also significantly regulated (Table 8). GA signaling pathway was repressed, with a concomitant up-regulation of a DELLA gene and down-regulation of GID2, responsible for DELLA degrad-ation [59].
Genes involved in CK activation, such as those encoding a UDP-glycosyltransferase 85A1 (EC 2.4.1.215), zeatin O-glucosyltransferase and CK riboside 5'-monophosphate phosphoribohydrolase were significantly affected by the imposition of the shade treatment. Genes encoding the CK receptors histidine kinases and histidine-containing phos-photransferase, and CK dehydrogenase enzyme, involved in its degradation, were induced. Shade also promoted the up-regulation of genes involved in brassinosteroids (BR) signal transduction. In addition, the expression of genes encoding cyclin-D3 (CYCD3) proteins, which are downstream components of the CK and BR-signaling pathways that promotes cell division [60], was significantly down-regulated, and a SENESCENCE RELATED GENE (SRG1) was up-regulated, in inflorescences from shaded vines, at 7d (Additional file 6).
Genes encoding ABA synthesis and degradation en-zymes, such as aldehyde oxidase and abscisic acid 8'-hydroxylase, respectively, were up-regulated. These changes on ABA metabolism were also verified as de-creased ABA relative content in shaded inflorescences (Table 4). In the ABA-signal transduction pathway, down-regulation of protein phosphatase 2C, which is a negative regulator of ABA response and up-regulation of SnRK2 were observed, suggesting a de-repression of ABA signaling in shaded inflorescences.
The expression of genes encoding methyltransferase enzymes responsible for conversion of jasmonic (JA) and salicylic acids (SA) in methyljasmonate and methyl-salicylate, respectively, was down-regulated. JA-mediated signaling pathway was also affected, as revealed by the up-regulation of a gene encoding TIFY9 which nega-tively regulates a key transcriptional activator of jasmo-nate responses [61].
Changes on lipid, cofactor and secondary metabolism
Impact on lipid-related pathways was disclosed as gly-cerolipid, glycerophospholipid and sphingolipid metabol-ism, fatty acid biosynthesis, elongation and degradation, linoleic and arachidonic acid metabolism, unsaturated fatty acids biosynthesis, alkaloid biosynthesis, ether lipid metabolism and cutin, suberine and wax biosynthesis were affected in shade-treated inflorescences (Additional file 11). In particular, genes encoding lipoxygenase (EC 1.13.11.12) and lipase (EC 3.1.1.3) enzymes were highly represented and mostly up-regulated. At the metabolite level, a global increase of fatty acids, oxylipins (HODE), glycerolipids, sterols and glycerophospholipids was also verified (Additional file 9).
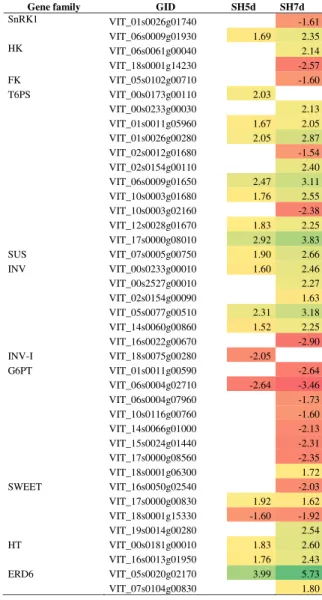
Table 7 DEG involved in sugar signaling and transport in shade-treated inflorescences and respective fold-change
Gene family GID SH5d SH7d
SnRK1 VIT_01s0026g01740 -1.61 VIT_06s0009g01930 1.69 2.35 HK VIT_06s0061g00040 2.14 VIT_18s0001g14230 -2.57 FK VIT_05s0102g00710 -1.60 T6PS VIT_00s0173g00110 2.03 VIT_00s0233g00030 2.13 VIT_01s0011g05960 1.67 2.05 VIT_01s0026g00280 2.05 2.87 VIT_02s0012g01680 -1.54 VIT_02s0154g00110 2.40 VIT_06s0009g01650 2.47 3.11 VIT_10s0003g01680 1.76 2.55 VIT_10s0003g02160 -2.38 VIT_12s0028g01670 1.83 2.25 VIT_17s0000g08010 2.92 3.83 SUS VIT_07s0005g00750 1.90 2.66 INV VIT_00s0233g00010 1.60 2.46 VIT_00s2527g00010 2.27 VIT_02s0154g00090 1.63 VIT_05s0077g00510 2.31 3.18 VIT_14s0060g00860 1.52 2.25 VIT_16s0022g00670 -2.90 INV-I VIT_18s0075g00280 -2.05 G6PT VIT_01s0011g00590 -2.64 VIT_06s0004g02710 -2.64 -3.46 VIT_06s0004g07960 -1.73 VIT_10s0116g00760 -1.60 VIT_14s0066g01000 -2.13 VIT_15s0024g01440 -2.31 VIT_17s0000g08560 -2.35 VIT_18s0001g06300 1.72 SWEET VIT_16s0050g02540 -2.03 VIT_17s0000g00830 1.92 1.62 VIT_18s0001g15330 -1.60 -1.92 VIT_19s0014g00280 2.54 HT VIT_00s0181g00010 1.83 2.60 VIT_16s0013g01950 1.76 2.43 ERD6 VIT_05s0020g02170 3.99 5.73 VIT_07s0104g00830 1.80
SnRK1: serine/threonine-protein kinase SnRK1; HK: hexokinase; FK: fructokinse; T6PS: trehalose-6-phosphate synthase; SUS: sucrose synthase; ÍNV: invertase; INV-I: invertase inhibitor; G6PT: glucose-6-phosphate/phosphate translocator 2; SWEET: bidirectional sugar transporter SWEET; HT: hexose transporter; EDR6: sugar transporter ERD6-like
Up-regulation is marked as green and down-regulation as red background. Data were obtained from 3 independent biological replicates
Cofactors metabolism-related pathways were also sig-nificantly altered, of which thiamine metabolism was the most represented pathway, followed by vitamin B6 metab-olism, riboflavin metabmetab-olism, pantothenate and CoA bio-synthesis and nicotinate and nicotinamide metabolism at
transcriptome level. Phosphate and methylphosphate me-tabolite levels increased in shade-treated inflorescences.
Secondary metabolic pathways such as phenylpropa-noid, stilbephenylpropa-noid, monoterpephenylpropa-noid, diterpenoids, caroten-oids, benzencaroten-oids, flavonoids and anthocyanin biosynthesis
Table 8 DEG involved in hormone biosynthesis, metabolism and signaling pathways in shade-treated inflorescences and respective fold-change
Gene
family GID SH5d SH7d
Gene
family GID SH5d SH7d
ABA AO VIT_18s0041g02410 2.19 2.66 ET SAM-S VIT_07s0005g02230 -3.02
ABAX VIT_03s0063g00380 2.03 2.63 VIT_14s0060g00480 -1.50 -2.58
PP 2C VIT_08s0007g06510 -1.51 ACO VIT_05s0049g00310 1.56 1.98
VIT_16s0050g02680 -1.82 VIT_07s0005g03060 -2.25
SnRK2 VIT_07s0197g00080 1.87 1.73 VIT_08s0007g03040 2.14 2.54
VIT_18s0001g06310 1.64 EIN3 VIT_13s0047g00250 1.66
AUX TRY-ATF VIT_18s0157g00140 1.81 4.65 ERF VIT_00s0772g00020 1.65 2.00
TIR VIT_05s0020g04830 2.36 3.12 VIT_01s0011g03070 2.24
ABP VIT_07s0005g05910 1.71 VIT_01s0150g00120 1.56 1.87
VIT_07s0005g05930 1.75 VIT_02s0234g00130 2.02
VIT_09s0002g01320 4.42 VIT_04s0008g06000 -2.02
VIT_18s0086g00590 2.93 VIT_04s0023g00970 -1.83
Aux/IAA VIT_04s0008g00220 -2.03 -2.70 VIT_05s0049g00510 1.79
VIT_07s0141g00270 -1.64 VIT_05s0077g01860 1.68
VIT_07s0141g00290 -2.21 -3.33 VIT_07s0031g01980 2.65
Aux-IP VIT_03s0038g00930 -1.77 -2.94 VIT_07s0141g00690 -1.60
VIT_03s0038g00940 -2.71 VIT_08s0040g03180 -2.60
VIT_04s0023g00560 3.45 VIT_09s0018g01650 -2.46
VIT_18s0001g13360 -1.72 VIT_12s0059g00280 1.80
VIT_18s0072g00660 -1.57 -2.32 VIT_13s0019g03550 1.55
IAA-IP VIT_07s0005g00660 1.89 VIT_14s0006g02290 -2.32 -2.90
VIT_18s0001g13980 -1.92 VIT_15s0021g01630 2.63
ARF VIT_06s0004g03130 -2.52 VIT_15s0046g00310 -2.12 -2.50
GH3.9 VIT_07s0005g00090 1.56 VIT_15s0046g01390 1.77
AEC VIT_11s0052g00440 -1.92 VIT_16s0013g00950 1.64
VIT_17s0000g02420 -1.67 VIT_16s0013g01000 1.63
BR BSL VIT_00s1197g00010 2.03 VIT_16s0013g01030 2.09
VIT_00s1427g00010 2.30 VIT_16s0013g01070 2.10
BRU1 VIT_05s0062g00250 2.04 3.82 VIT_16s0013g01120 2.01
CK UDP-GTF VIT_18s0001g05990 -2.84 VIT_16s0100g00400 1.51
zeatin-GTF VIT_08s0007g08920 1.63 3.35 VIT_17s0000g04480 1.58 1.93
CYT VIT_18s0001g14030 -1.61 VIT_18s0001g10150 1.64
CH VIT_13s0158g00320 1.73 VIT_18s0001g03240 2.04
HK VIT_01s0010g03780 2.22 VIT_18s0001g05850 1.71
VIT_04s0008g03460 1.96 VIT_18s0001g08610 -1.58
VIT_12s0057g00690 1.69 1.53 JA JA-MTF VIT_18s0001g12880 -1.62 -3.29
AHP VIT_09s0002g03520 -1.67 -3.25 VIT_18s0001g12890 -1.70 -3.61
GA DELLA VIT_14s0006g00640 1.74 VIT_18s0001g12900 -1.64 -1.93
GID2 VIT_07s0129g01000 -1.82 TIFY VIT_01s0146g00480 2.26
VIT_18s0001g09700 -1.69 SA SA-MTF VIT_04s0023g02220 2.55
GA20ox VIT_03s0063g01150 -3.21 -2.12 VIT_04s0023g02230 -2.40 -1.92
VIT_03s0063g01260 -2.55 -1.91 VIT_04s0023g02240 -2.35 -1.77
VIT_09s0002g05280 -1.56 -2.23 VIT_04s0023g02260 -2.64 -2.09
VIT_15s0046g02550 -2.28 VIT_04s0023g02310 2.44
GA3ox VIT_04s0008g04920 1.76 VIT_04s0023g03810 -2.10
GA2ox VIT_05s0077g00520 1.99 MAPKs MAPK VIT_06s0004g03540 2.101
VIT_06s0004g06790 -1.82 VIT_04s0023g02420 1.512
VIT_10s0116g00410 -3.39 MAPKK VIT_11s0016g02970 -2.239
VIT_19s0140g00120 3.05 VIT_05s0020g02910 -3.101
VIT_19s0177g00030 -2.59
GA-R VIT_14s0108g00740 -2.97
ABA: abscisic acid; AO: aldehyde oxidase; ABAX: abscisic acid 8'-hydroxylase; PP 2C: protein phosphatase 2C; SnRK2: serine/threonine-protein kinase SnRK2; AUX: auxin; TRY-ATF: tryptophan aminotransferase-related protein; TIR1 : transport inhibitor response 1; ABP: auxin-binding protein; Aux/IAA: Aux/IAA proteins; Aux-IP: other auxin induced proteins; IAA-IP: other IAA induced proteins; GH3.9: putative indole-3-acetic acid-amido synthetase GH3.9; AEC: auxin efflux carrier component; BR: brassinosteroid; BRU1: brassinosteroid-regulated protein BRU1; BSL: serine/threonine-protein phosphatase BSL3-like; CK: cytokinin, GTF:
UDP-glycosyltransferase 85A1; ZEA-GTF: zeatin O-glucosyltransferase; CYT: cytokinin riboside 5'-monophosphate phosphoribohydrolase; CYH: cytokinin dehydrogenase; HK: histidine kinase; AHP: histidine-containing phosphotransfer protein; GA: gibberellin; DELLA: DELLA protein GAI1; GID2: F-box protein GID2; GA20ox: gibberellin 20 oxidase; GA3ox: gibberellin 3-beta-dioxygenase; GA2ox: gibberellin 2-beta-dioxygenase; GA-R: gibberellin-regulated protein; ET: ethylene, SAM-S:
S-adenosylmethionine synthase; ACO: 1-aminocyclopropane-1-carboxylate oxidase; EIN3: ethylene insensitive 3-like; ERF: ethylene-responsive transcription factor; JA: jasmonic acid; JA-MTF: jasmonate O-methyltransferase; TIFY: TIFY 9 protein; SA: salicylic acid; SA-MTF: salicylate O-methyltransferase; MAPKs: mitogen-activated protein kinase cascade: MAPK: mitogen-activated protein kinase; MAPKK: mitogen-activated protein kinase kinase
and degradation and cytochrome P450-related pathways were significantly affected during shade in both time points. DEG encoding phenylalanine ammonia-lyases (PALs) (EC 4.3.1.25) which catalyse the first step of phe-nylpropanoids biosynthetic pathway, and stilbene synthases (EC 2.3.1.95) were predominantly up-regulated. Genes encoding myrcene synthases (EC 4.2.3.20) were up-regulated while (3S)-linalool/(E)-nerolidol /(E,E)-geranyl linalool synthases (EC 4.2.3.25) were down-regulated. Fla-vonoids and diterpenoids biosynthetic pathways were, conversely, repressed. At the metabolomic level, oleano-late from terpenoids metabolism, feruoleano-late from phenylpro-panoid metabolism, and both α- and γ-tocopherols increased, while arbutrin (benzenoid) and salidroside (phenylpropanoid) were reduced in result of shaded inflorescences.
Shade altered the accumulation of non-enzymatic markers of oxidative stress, including increased reduced glutathione (GSH) relative content and decreased ascorbate-related metabolites (Additional file 9). The expression of genes encoding enzymatic antioxidants comprising superoxide dismutase, ascorbate oxidase, ascorbate peroxidase, glutathione peroxidase, peroxire-doxin, thioreperoxire-doxin, glutaredoxin and glutathione S-transferase was also significantly affected (Table 9). In addition, genes encoding laccase (EC 1.10.3.3), involved in ascorbate metabolism and lignin biosynthesis, were exclusively down-regulated in shade treatment.
Shade-responsive transcription factors
A high number of differentially expressed transcription factors induced by shade treatment was identified, pre-dominantly at 7d, including MYB, GATA, MADS-box, HEX, GT-2, WRKY, CCAAT, ZF-HD, HSF, WOX, E2F/ DP, bHLH, MOT2, MEIS1, RF2b and ZFF (Table 10). In particular, genes encoding MYB and GATA families were the most represented and were predominantly down- and up-regulated, respectively. Transcription fac-tors directly involved in hormone signal transduction pathways were represented in Table 8.
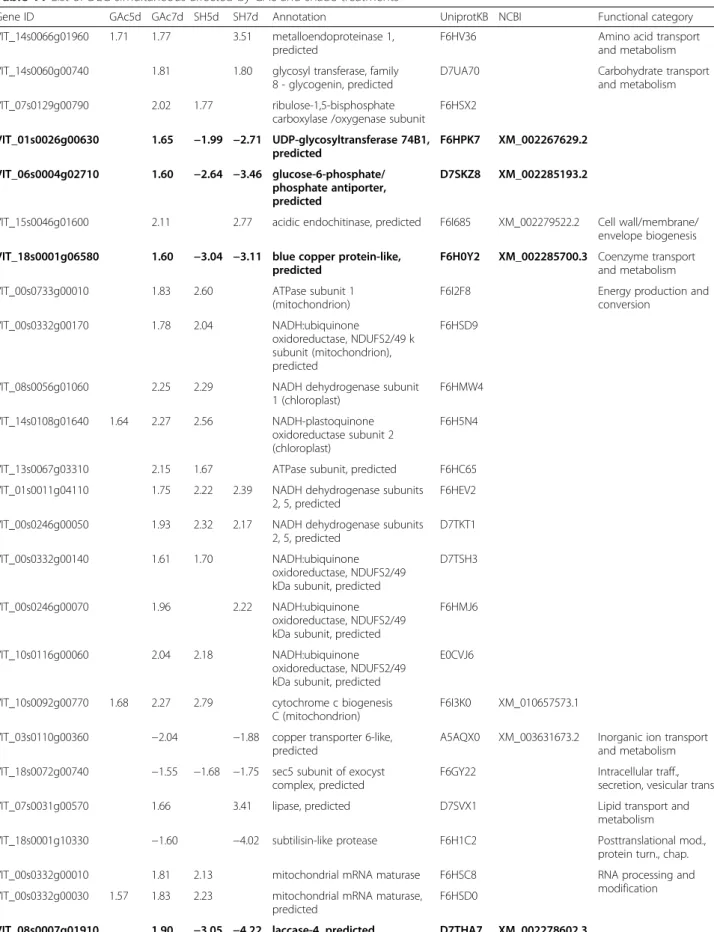
Common DEG and metabolites that significantly changed in response to GAc and shade
In addition to the DEG found to be specific for each treatment, 36 annotated genes were differentially expressed in both abscission inducing treatments, from which 5 DEG changed with a opposite expression pat-tern, whereas 31 changed followed the same trend (Table 11). The latter ones could be candidate genes in-volved in shared pathways leading to abscission and were predominantly up-regulated in response to both stimuli. Only five out of these genes, encoding a cooper transporter, subtilisin-like protease, cytochrome P450, a subunit of exocyst complex, and MYB transcription
factor, were down-regulated. Genes that showed an op-posite change in expression pattern encode a UGT74B1, glucose-6-phosphate translocator, blue Cu-protein and were up-regulated in GAc treatment and down-regulated in shade. Additionally, a gene encoding an ethylene-responsive transcription factor was up-regulated in shade while was repressed in samples from the GAc-treatment.
Among the 13 commonly altered metabolites in re-sponse to both thinning strategies, eight showed the same pattern in both imposed treatments, belonging mostly to the amino acids pathway (Table 12).
On other hand, the phospholipid phosphoethanolamine and nicotianamine decreased in GAc treated samples and increased in those from shaded vines, while putrescine, in-osine, arbutine and salidorise were increased in GAc- and reduced in shade-treated inflorescences (Tables 5 and 12). Other gene family, vacuolar H+-ATPase, was affected by GAc and shade treatments, although not exactly the same genes were involved (Additional file 6).
Discussion
What makes a flower to abscise?
Flower abscission depicted by –OMIC approaches dis-closed a complex regulation including adjustments of metabolism, gene expression and physiology. In grape-vine, natural flower drop occurs between 6 and 12 days after 100 % cap fall (d) [62] and peaks at 10 d under our experimental conditions (data not shown). Our data revealed that GAc and shade induced flower abscission by opposite effects on cell metabolism at 5 and 7 d, but converging on some common pathways leading to abscission.
As previously reported, polyamine metabolism path-way have a key role in reproductive organs abscission [12, 15, 16, 63, 64]. Changed putrescine inflorescence content varied with the imposed treatment, increasing and decreasing in result of GAc- and shade-treatment, respectively. Whereas putrescine catabolism, by conver-sion on N-acetylputrescine and/or biosynthesis of down-stream polyamines spermidine and spermine with the accumulation of 5-methylthioadenosine (MTA), was af-fected in the same direction in both treatments (Table 12). MTA is produced from S-adenosylmethionine (SAM) through the spermidine and spermine biosynthetic pathway, where it behaves as a powerful inhibitory prod-uct [65], suggesting that the regulation of the downstream polyamines biosynthetic step, but not the biosynthesis of its precursor putrescine, is a common signal of abscission. In addition, in inflorescences developing under shaded conditions, the observed up-regulation of a gene encoding SAM decarboxylase (EC 4.1.1.50) and repression of the subsequent step of spermidine biosynthesis, by the down-regulation of a putative SPERMIDINE SYNTHASE 2 gene
(VIT_17s0000g08030) indicates that this step of poly-amines metabolism was also regulated at transcriptome level (Additional file 6). This is in accordance with obser-vations of abscission inhibition by application of exogen-ous spermidine, but not of putrescine, prior to flowering [15]. MTA is also produced via ethylene biosynthetic pathway [66] which was significantly affected only by shade treatment (Table 8), while the expression of ERF RAP2-3 was induced by shade and repressed by GAc treatment, thus suggesting that the ethylene signal trans-duction pathway was differentially regulated according to the treatment (Table 11).
Two common events were the up-regulation of both genes involved in RNA metabolism, such as those encod-ing RNA polymerases and ribosomal proteins, and energy production related genes, such as NADH dehydrogenases, cytochrome c and ATPase (Table 11), suggesting an increased demand for energy. NADH:ubiquinone oxidore-ductase from NADH dehydrogenase family and cyto-chrome c are members of the respiratory chain, acting to generate a proton gradient which is thereafter used for ATP synthesis through H+-transporting ATPase. The
up-regulation of chloroplastic NADH dehydrogenases sug-gested that chlororespiration, which is associated with ROS alleviation around photosystems [67], is also induced as response to both treatments.
In addition to genes encoding serine/threonine protein kinases and calmodulin protein, which are components of signal transduction pathways, a gene encoding a subtilisin-like protease, described to be involved in protein turnover, generation and processing of peptide signals and programmed cell death [68–70], was commonly affected by abscission-inducing stimulus (Table 11). The higher transcript accumulation of a gene encoding a specific anti-oxidant 1-cys peroxiredoxin enzyme (EC 1.11.1.15), which is prone to be reduced by ascorbic acid or glutathione, was additionally found to be common after both abscising inducing treatments. This observation agrees with previ-ous works that described the multiple ROS roles in abscis-sion including signaling, ROS-sugar-hormone cross talk and induction of the expression of CW-degrading en-zymes [11, 14]. Other changes on enzymatic and non-enzymatic oxygen stress remediation mechanisms were found to be specific from each abscission-triggering
Table 9 DEG encoding oxidative stress-related enzymes in shade-treated inflorescences and respective fold-change
Gene family GID SH5d SH7d Gene family GID SH5d SH7d AO VIT_00s0253g00040 -2.19 GST VIT_01s0026g01340 -2.67 -4.08 VIT_06s0009g01320 -2.20 VIT_01s0026g01340 -2.67 -4.08 VIT_10s0116g01610 -2.80 VIT_05s0049g01090 -1.75 VIT_18s0001g00470 -2.46 VIT_05s0049g01120 -1.74
APX VIT_06s0004g03550 -1.86 VIT_05s0051g00180 2.01
PX VIT_02s0012g00540 2.04 VIT_05s0051g00240 2.87 VIT_03s0063g01040 2.63 2.90 VIT_06s0004g03690 -1.66 -2.78 VIT_05s0077g00880 -2.47 VIT_06s0004g05690 2.32 VIT_06s0004g07770 -2.05 VIT_06s0004g05700 2.11 VIT_07s0129g00360 1.91 VIT_07s0005g04880 2.41 VIT_07s0130g00220 -2.87 VIT_07s0005g04880 2.41 VIT_10s0116g01780 -1.81 -3.41 VIT_07s0005g04890 2.01 VIT_14s0066g01850 -2.70 VIT_07s0104g01800 -2.09 -3.16 VIT_19s0085g01040 -1.69 VIT_07s0104g01800 -2.09 -3.16
SOD VIT_16s0013g00260 -2.29 VIT_07s0104g01810 -2.43 -3.62
PXR VIT_05s0020g00600 1.91 VIT_07s0104g01810 -2.43 -3.62 VIT_11s0016g00560 -2.00 -3.69 VIT_07s0104g01820 -2.61 VIT_11s0016g03630 -2.47 VIT_07s0104g01820 -2.61 TR VIT_00s0532g00030 1.98 VIT_07s0104g01830 -1.77 VIT_03s0038g04160 2.18 VIT_08s0007g01420 -1.96 VIT_04s0008g02900 2.00 VIT_08s0007g01420 -1.96 VIT_04s0023g02700 -1.58 VIT_12s0028g00920 3.56 VIT_08s0007g07620 1.52 VIT_13s0067g03470 -1.80 VIT_17s0000g06370 1.66 VIT_16s0039g01070 2.53 VIT_18s0001g00820 -2.08 VIT_18s0001g00690 -2.03 VIT_18s0001g13240 -2.05 -2.08 VIT_18s0001g00690 -2.03 VIT_18s0001g15310 -2.93 -3.94 VIT_19s0015g02590 2.53 VIT_19s0014g05090 3.31 3.14 VIT_19s0015g02690 2.44 GR VIT_02s0025g01710 -4.39 -2.30 VIT_19s0015g02730 1.58 VIT_02s0025g02700 -3.42 VIT_19s0015g02730 1.58 VIT_04s0008g01120 -1.76 -1.81 VIT_19s0015g02880 2.60 VIT_05s0020g01750 3.18 VIT_19s0015g02890 1.54 VIT_05s0020g01760 2.63 3.18 VIT_19s0015g02890 1.54 VIT_07s0104g01390 -2.15 -3.33 VIT_19s0027g00460 2.00 VIT_07s0104g01400 2.37 VIT_19s0027g00460 2.00 VIT_08s0007g03220 -3.53 VIT_19s0093g00160 2.57 VIT_11s0052g00500 -1.64 VIT_19s0093g00220 1.98 VIT_13s0067g01650 1.68 VIT_19s0093g00220 1.98 VIT_13s0073g00520 -3.50 VIT_19s0093g00260 2.18 GPX VIT_05s0102g00120 -3.97 VIT_19s0093g00320 2.05 1.86
AO: ascorbate oxidase; APX: ascorbate peroxidase; PX: peroxidase; SOD: superoxide dismutase; PXR: peroxiredoxin; TR: thioredoxin; GR: glutaredoxin; GPX: glutathione peroxidase; GST: glutathione S-transferase
stimulus. In particular, the accumulation of the antioxi-dants arbutin, salidroside, and the expression of genes en-coding a laccase 4 and other blue Cu-protein were contrasting between the two treatments, indicating differ-ent ROS detoxification instrumdiffer-ents triggered by GAc or by shade treated inflorescences (Tables 11 and 12).
Regarding amino acid metabolism, the observed induc-tion of lysine and isoleucine biosynthetic pathways re-vealed that both treatments are abiotic stress-impacted. Lysine is a precursor for glutamate, an important signal-ing amino acid that regulates plant growth and
plant-environment responses [71]. On the other hand, isoleu-cine is accumulated as a compatible osmolyte, playing a role in plant stress tolerance [72]. In lipid-related path-ways, changes in glycerolipids and phospholipids metab-olism indicated alterations on cell membrane stability and signaling lipids content [73, 74], as candidates to common markers of abscission.
The common event of increased transcription of genes encoding glycogenin and RuBisCO enzymes, suggests that, in what concerns carbohydrate metabolism, conver-sion of glucose to the energy storage polymer glycogen
Table 10 DEG encoding transcription factors in shade-treated inflorescences and respective fold-change
GID SH5d SH7d GID SH5d SH7d
bHLH VIT_14s0128g00110 -1.86 -3.82 MOT2 VIT_13s0019g02510 -1.80 -2.42 VIT_18s0001g06650 -1.86 MEIS1 VIT_06s0009g00410 1.59
CCAAT VIT_00s0956g00020 -2.12 MYB VIT_00s0341g00050 -2.10
VIT_01s0010g03550 -4.39 VIT_00s1241g00010 -1.85 VIT_06s0080g00460 -2.19 VIT_02s0025g02210 -2.26 -3.75
VIT_09s0002g01590 1.71 VIT_02s0025g02220 -2.72
VIT_11s0016g01480 -1.85 VIT_04s0008g01800 -1.69 E2F/DP VIT_08s0007g00170 -1.94 VIT_04s0008g01810 -1.61 -3.81
VIT_17s0000g07630 -2.62 VIT_04s0008g01820 -1.82 VIT_18s0001g14110 -1.76 VIT_04s0008g01830 -1.90 GATA-4/5/6 VIT_01s0011g03520 2.09 2.96 VIT_04s0008g03780 -2.10 VIT_01s0011g04240 1.56 VIT_05s0020g01100 -1.74 VIT_01s0150g00410 1.81 VIT_05s0049g01020 2.13 VIT_02s0033g00300 -1.53 -2.76 VIT_05s0049g02260 2.26 VIT_03s0038g00340 -2.44 VIT_05s0077g00500 2.04 VIT_04s0023g01840 -2.19 VIT_06s0004g04140 2.20 1.96 VIT_08s0007g06310 1.65 1.59 VIT_07s0005g01210 -5.21 VIT_09s0002g03750 -2.60 VIT_07s0005g01950 2.16 VIT_09s0054g00530 -1.80 VIT_08s0007g00410 -1.69 VIT_09s0054g01620 1.91 VIT_08s0007g04830 2.90 VIT_11s0016g02210 1.92 VIT_09s0002g01380 -1.97 VIT_11s0103g00760 -2.24 VIT_09s0002g01670 -2.18 -3.21 VIT_11s0206g00060 1.50 VIT_10s0116g01760 1.52 VIT_12s0028g00980 1.85 VIT_11s0016g01300 -1.91 -2.50 VIT_12s0134g00400 -1.94 -2.12 VIT_11s0016g01320 -6.51 VIT_13s0067g03390 1.70 VIT_11s0016g03750 -2.02 VIT_15s0048g02540 1.83 VIT_12s0134g00490 -2.35 VIT_16s0098g00360 -2.03 -2.50 VIT_13s0064g00570 1.75 VIT_16s0098g00900 1.59 VIT_13s0067g01630 1.74 2.22 VIT_17s0000g06570 1.55 VIT_14s0006g01280 -2.03 VIT_18s0001g13520 1.54 VIT_14s0006g01290 -2.50 VIT_19s0014g05120 1.62 VIT_14s0006g01340 -2.40 GT-2 VIT_00s0558g00020 1.75 VIT_14s0006g01620 -2.73 -4.46 VIT_02s0025g03220 1.87 VIT_14s0066g01220 -2.09 VIT_04s0008g01850 -2.03 VIT_14s0083g00120 -1.88 VIT_08s0007g04180 -3.95 VIT_14s0108g01010 -1.63 -2.47 VIT_08s0058g00200 1.62 VIT_15s0046g00170 -2.65 -3.42 VIT_13s0084g00800 -2.26 VIT_17s0000g02660 -2.53 -3.53 VIT_17s0000g10420 -1.72 VIT_17s0000g03560 1.87 HSF VIT_04s0008g01110 -2.10 VIT_18s0117g00200 -1.84 -4.32 VIT_06s0009g02730 -2.25 VIT_18s0117g00210 -1.96 -2.47 VIT_12s0028g01410 2.03 RF2b VIT_06s0004g08070 -1.54
VIT_18s0001g10380 -3.12 WOX VIT_01s0011g05020 -1.92
HEX VIT_01s0026g01950 -1.80 VIT_17s0000g02460 -2.17
VIT_04s0023g01330 1.91 VIT_18s0001g10160 -1.55 -3.72
VIT_08s0007g04200 -4.21 WRKY VIT_01s0010g03930 2.70
VIT_10s0003g00380 1.93 VIT_06s0004g07500 2.59 VIT_13s0156g00260 1.60 VIT_07s0005g01710 2.29 VIT_14s0066g01440 -1.56 VIT_08s0058g00690 2.64 VIT_18s0001g06430 -2.65 VIT_09s0018g00240 3.26 MADS-box VIT_00s0211g00110 -2.40 -4.92 VIT_12s0059g00880 1.81 VIT_00s0211g00180 1.78 ZF-HD VIT_12s0035g00650 1.86 2.55 VIT_14s0068g01800 2.04 VIT_12s0035g01880 -1.76 VIT_14s0083g01030 -1.96 VIT_17s0000g00810 -2.10 VIT_16s0022g02380 1.84 VIT_18s0001g12580 2.10 VIT_17s0000g04990 1.86 ZFF VIT_06s0004g03180 2.06 VIT_17s0000g06340 1.72