How Analysts react to M&A
Announcements
Bernardo de Bastos Falcão
152418028
Dissertation written under the supervision of Fani Kalogirou
Dissertation submitted in partial fulfilment of requirements for the MSc in Finance, at the Universidade Católica Portuguesa
1
Abstract
This dissertation examines how analysts react to M&A announcements. Using Propensity Score Matching to increase the accuracy of the analysis, I build a sample of comparable observations to measure the impact of M&A when an analyst recommendation revision takes place. I find a negative influence of M&A deals on revision. Focusing on the specifics of each deal, I also analyze the impact of the type of financing being used to the acquisition as well as the under or over valuation of the acquirer’s stock. My results suggest that stock financed deals are generally perceived in a more pessimistic way. However, when the acquirer is overvalued, analysts react positively. I also find that the advisor selection on the target side plays an important role, as analysts tend to react more negatively when the sell-side is supported by tier-1 advisors. Lastly, in this study I also analyze the impact of knowledge-acquisition M&A in analysts’ recommendations, but no statistically significant results are found, suggesting a deeper analysis on the subject is required.
2
Resumo
Esta dissertação analisa a forma como as recomendações dos analistas reagem aos anúncios de M&A (fusões e aquisições) na empresa adquirente. Através do uso de Propensity Matching Score para aumentar a precisão da análise, construo uma amostra de observações comparáveis para estudar o impacto de M&A aquando das revisões das recomendações. Nas observações com M&A, encontro uma influência negativa nas revisões das recomendações. Focando nas características de cada aquisição, neste estudo também analiso o impacto do tipo de financiamento usado e eventual subavaliação/sobreavaliação do capital em bolsa da empresa adquirente, onde descubro uma relação negativa entre a revisão da recomendação e utilização das ações da empresa como forma de financiamento. No entanto, quando o adquirente está sobreavaliado, os analistas tendem a reagir positivamente. Também estudo o impacto da seleção do advisor por parte da empresa adquirida, e descubro que a escolha de um advisor melhor reputado (tier-1) impacta negativamente a revisão da recomendação no adquirente. Por último, também analiso as aquisições motivadas pela aquisição de conhecimento, mas não foram encontrados resultados estatisticamente significantes, sugerindo uma análise mais profunda ao tópico.
3
List of Contents
Abstract ... 1
Table of Contents ... 3
1. Introduction ... 5
2. Literature Review & Hypothesis Development ... 6
2.1 Mergers and Acquisitions Performance... 6
2.2 Analyst’s relevance and Recommendations ... 8
2.3 Hypothesis Development ... 10
3. Sample Construction, Data and Univariate Analysis ... 11
3.1 Data & Sample Construction ... 11
3.2 Univariate Analysis & Descriptive Statistics ... 12
3.2.1 All Sample ... 12
3.2.2 M&A Sample ... 14
4. Results and Discussion ... 14
4.1 Hypothesis 1 ... 15 4.1.1 Hypothesis 1A ... 15 4.1.2 Hypothesis 1B ... 16 4.2 Hypothesis 2 ... 16 4.3 Hypothesis 3 ... 17 4.4 Hypothesis 4 ... 18 5. Conclusion ... 19 6. References ... 21
7. Tables & Figures ... 24
7.1 Tables ... 24
4
List of Tables
Table I Sample Size Evolution ... 24
Table II Propensity Scores Distribution before and after Matching ... 24
Table III Recommendations Distribution before and after Revision ... 25
Table IV Number of Recommendations (NUMREC) per observation ... 26
Table V Firms' Age Distribution ... 26
Table VI Deals Distribution among Industry Major Groups ... 27
Table VII Deals Distribution among types of financing ... 27
Table VIII Deals Distribution for Starting Recommendations ... 27
Table IX M&A Impact on Recommendations Revision ... 28
Table X M&A impact on Recommendation Standard Deviation ... 28
Table XI Timing and Type of Financing Impact on Recommendations Revision ... 29
Table XII Sell-side Tier-1 Advisor Influence on Recommendation Revisions ... 29
Table XIII Analysts' reaction to knowledge-acquisition M&A deals ... 30
Table XIV Databases - Downloaded Variables Description ... 31
Table XV Databases – Built-in Variables Description ... 33
List of Figures Figure I Propensity Scores' distribution before matching ... 34
Figure II Number of Analysts per observation Distribution ... 34
Figure III Firm’s Age Distribution ... 35
Figure IV Deals Size Distribution ... 35
5
1. Introduction
The increase in M&A transactions over the past decades, both in number of trades and size, reinforces the need to comprehend these disruptive events. However, despite the high number of papers dedicated to this research area, findings are still inconclusive due to the different measures used which serve the purposes of each study, but make it almost impossible to draw clear conclusions on the impact of M&As (Das and Kapil ,2012). Motivated to add new evidence to this important research field, in this study I propose an innovative framework to study M&A deals using analysts’ recommendations as a proxy for expected future performance. Understanding analysts’ recommendations on M&A can be an important guide for investors when making investment decisions, and an important guide for managers when deciding the specificities on possible deals.
Focusing on the impact on shareholder’s wealth as an aggregate measure to study the impact on the firm as an all, Moeller, Schlingemann and Stulz (2005), one of the most relevant studies in the field, are able to prove a negative impact of M&A deals on stock prices. This basic premise of value destruction linked to M&A is, however, limited. Each deal has its own structure, with each aspect within it having its own influence. In this study, I focus on some of the most consensual findings among existent literature, i.e. the type of financing, deal advisory and deal reasoning.
But before going through the analysis, it is important to understand why the use of analysts’ recommendations might be a good instrument for this analysis. As explained in Thomas (1993) and Chung and Jo (1996), analysts have an important role in financial markets, playing almost as a supervisor and acting as a marketing team for firms’ decisions and their expected impact on firms future performance. Furthermore, the belief that analysts have a competitive advantage on accessing information, as shown in Conrad et al. (2006), increases the relevance of their opinion. This is also proven by Green (2006), that creates an investment portfolio based on analyst’s recommendations and finding profitability in analyst’s predictions. Given the simplicity of the recommendation, as a straightforward opinion of expected long-term performance (Ramnath, Rock and Shane, 2008), it allows a simpler analysis when compared to other methodologies, like the ones using returns, in which some assumptions regarding the time period post deal and the methodology to use play a fundamental role in the final results.
By using IBES analyst’s recommendations consensus data from 1993 to September, 2019, I construct a sample based on propensity score matching to find the most relevant peers for firms engaging in M&A transactions. This allows me to “zoom in” the deal effect on recommendations revisions after the announcement of a deal. As expected, the existence of a deal contributes negatively to the recommendation revision, which is consistent with the most relevant literature. However, despite this average pessimistic movement, the dispersion in analysts’ recommendations increases, which may be explained by the early stage of the deal (announcement) or the questions regarding synergies capturing.
When taking only in consideration observations with a M&A deal, the type of structure turns to be very relevant to analysts’ opinion. In line with what is found in current literature (Savor and Lu, 2009), analysts tend to punish deals made by overvalued firms or where acquirors are financing the deal through stock. However, and as anticipated, when the both conditions are met, analysts are more positive about it, confirming the “cheap currency” rationale. The target advisor also plays an important role. As Ismail (2009) reveals, despite finding no relation between the acquirer and its selected advisor on the long term performance of the acquirer, there is in fact a negative influence caused by the usage of a tier-1 advisor by the buy side (or
6
target firm). In this study I am also able to find what’s found by Ismail (2009), being able to prove that the existence of a tier-1 advisor decreases the prospects of performance by analysts. To conclude, this study also tests the reasoning of the deal, trying to discriminate the expected performance for firms engaging in knowledge-acquisition M&A, following the negative impact found in York and Wohar (2006). However, no statistically significant result is found, which might be explained by the selected proxy, or even by the fact that firms engaging in such deals are assuring future pipeline and sales. On one hand, they’re assuring their survival and future performance, but one the other hand it can also mean that their R&D investment is not being productive enough. This conundrum can confuse analysts and might explain the lack of direction on the results.
Overall, this study is able to reaffirm the importance of analysts’ recommendations, being able to find similar conclusions as the ones being found on the most relevant M&A literature, like the studies from Christensen, (2011) or Moeller, Schlingemann and Stulz (2005). These findings might be especially important for investors, as they can find in analysts a guide to
anticipate the expected performance of a firm when engaging in an M&A deal. This adds an
advantage relative to the use of returns, the most typical measure, as now investors may actually follow recommendations on companies engaging in M&A. Regarding literature, I also believe that the simplicity of the analysis can help.
The remainder of the dissertation proceeds as follows. Section 2 summarizes the most relevant literature regarding M&A performance, analysts and recommendations importance and finalizes with the hypothesis to test. Section 3 gives an overview of the process used, along with some descriptives on the sample used. Next, in section 4 empirical findings are analyzed and discussed, followed by section 5, where the conclusion can be found. References are listed in section 6, while all supporting tables and figures are present in section 7.
2. Literature Review & Hypothesis Development 2.1 Mergers and Acquisitions Performance
Used as a way to boost performance and increase business, M&A transactions have been more and more common on the last two decades. In fact, more than $2 trillion were being spent yearly on acquisitions (Christensen et al., 2011). In 2018, with more than 97,709 deals worldwide, these figures jumped to c. $5,3 trillion (Zephyr, 2019), showing the importance of these transactions in the economy. However, Christensen et al. (2011) point out a rate of failure between 70% and 90% when studying the long-term performance of these transactions.
The performance of M&A has been shown to be a very controversial topic, with different studies using different methodologies and reaching contradicting results, as can be seen in André, Kooli and L'Her (2004) or at Bild et al. (2002). Das and Kapil (2012) claim in their review that the “explanatory variables studied in the empirical works reflect primarily on researchers’ approach, construct, measurement techniques and data availability, leading to inconsistencies among the findings”. This lack of overlap between studies aggravates the comparability between them, leaving little space for proper and comprehensive conclusions.
Incentives to engage in an M&A transaction vary widely and hence should the measures to study them. As proposed by Berkovitch and Narayanan (1993), there are three main motives to this kind of investment: synergy, agency and hubris; with the first being the primary one. Mukherjee, Kiymaz and Baker (2004) also suggest tax considerations and tax diversification. This variety of motivations exacerbates the lack of consistency in current literature. Though,
7
there are still some studies helping to frame and analyze these events from different perspectives. In this study, I will focus on the impact of M&A on shareholders’ value.
Moeller, Schlingemann and Stulz (2005), a reference study in this research field, were able to prove that U.S. based acquiring shareholders lost more than $240 billion from 1998 to 2001, equivalent to 12 cents per dollar invested in M&A transactions, in line with what Christensen et al. (2011) state. Linking to the influence analysts’ recommendations have on capital markets, this overvaluation of deals might also be founded in their opinions. Moreover, studying their reactions to this type of events should be a complement to M&A literature, helping to frame analysts’ view with current knowledge. Haushalter and Lowry (2010) took the first step into this direction, studying investment banks’ investment decisions on M&A, when faced with different recommendations from their own analysts. They found a positive relation between the bank’s stockholdings of the acquirer and recommendation changes by its analysts after the merger announcement. This evidence reinforces the need to study analysts’ recommendation changes when reacting to acquisitions in a wider range. The belief that analysts’ have a competitive advantage over the market when setting their recommendations (Conrad et al. 2006) further supports the relevance of this analysis for the current M&A literature.
Savor and Lu (2009) found support for the “hypothesis that overvalued firms create value for long-term shareholders by using their equity as currency”, as long as the acquired firm is less overvalued than the one acquiring, also known as the market-timing theory. They compare overvalued stock to cheap currency, motivating the increase of value creation on the acquisition, due to the intrinsic discount caused by that cheap currency. They also give a famous example to illustrate that hypothesis, using the America Online’s (AOL) stock financed acquisition of Time Warner in the peak of the dot-com bubble. AOL paid almost 48% premium and saw its stock dropping by almost 17.5%. However, that deal was regarded as beneficial to AOL, as its stock was amazingly overvalued at the acquisition time. This capacity to acquire “hard assets” at discount is found to be beneficial to acquiring shareholders and represents a new addition to current literature, on motives to engage in M&A transactions, as it generates a new incentive for firms to momentarily “artificially boost their stock price” and for managers to go after deals where the “joint fundamental value of the acquirer’s and target’s assets is reduced by combining them in a single firm”. If able to do so, shareholders should profit from this M&A strategy. Savor and Lu (2009) also recommend future researchers to take in account those eventual overvaluations of the acquirer, to prevent any biases when studying M&A performance.
Sehgal, Banerjee and Deisting (2012) provide another angle to support the evidence that stock financed acquisitions create value for shareholders in the long term. They defend that the usage of stock as currency will also serve as a “risk sharing” tool, helping to assure the future performance of the target company, by motivating a superior commitment, mitigating the acquisition risk. This type of rationale is also used by most private equity firms when investing their capital.
As Loughran and Vijh (1997) evidence in their study, stock financing might also be linked to poorer performance of the acquirer. In fact, in their study, firms acquiring through equity are actually getting worth returns than those whose financing is made through cash. However, their study does not control for the possible under or over valuation of the acquirer, not capturing this effect in particular.
An important factor to determine M&A performance for shareholders is, of course, the price paid and the implied premium (or discount) over market value, where deal advisors play an important role. The advisor selection, as shown by Ismail (2009), can play an important role
8
onto closing price. On the buy-side his results are unclear, as he concludes that while acquirers guided by tier-1 advisors lost money, tier-2 gained. However, he also explains that those losses are mainly driven by huge losses incurred in a small number of “mega deals”. When controlling for those, his results indicate no difference regarding the use of tier-1 or tier-2 advisors. As for the sell-side, Ismail (2009) confirms a variance between being advised by tier-1 and tier-2, with the first ones being able to push more on the closing price, providing more gains to the seller. This result is in line with the superior deal hypothesis, defending that tier-1 advisors should outperform tier-2 and that the presence of a tier-1 advisor on one of the sides of an M&A deal should result in higher wealth for his client.
An additional factor to take into account when studying M&A performance, is the split between sectors. As referred before, there’s wide number of reasons to engage in M&A. Inside the “synergies” ramification, we can find, for instance, commercial, organizational or just growth. They depend on the specific firm strategy, and they impact the way firms perform. Innovative companies, or Scientific Firms, as defined by Griliches and Mairesse (1981), are R&D intensive firms with their pipeline depending on their ability to create new products and successfully introduce them to the market. However, since late ‘90s, R&D productivity has become less efficient, with firms breaking R&D investment records every year but keeping the same creation pace (Munos, 2009), i.e. the average cost per patent, one of the most used proxies for innovative performance literature (Hagedoorn and Cloodt, 2003), has increased over the last years. This increased inefficiency in R&D amplified the risk inherent to it, forcing managers to look for other ways to increase their pipeline, embracing M&A in what is called “Knowledge Motivated Acquisitions” (York and Wohar, 2006).
This type of acquisitions, however, seems to be punished by the market. York and Wohar (2006) find evidence of a negative impact on firm performance while Cloodt, Hagedoorn and Van Kranenburg (2006) prove that the innovative performance of those firms engaged in knowledge motivated acquisitions also decreases. However, despite those indications, Scientific firms seem to be more and more focused on pursuing an acquisitions-based strategy, to renovate their pipeline and assure future sales (Neville, 2019). The unclear conclusions by current literature enhance the need for more research into the topic, in which studying specialist’s reaction can add useful insights.
2.2 Analyst’s relevance and Recommendations
Analysts’ activity, since the beginning of the 1990s’, has been closely followed by institutional and private investors looking for a guide in the complex world of capital markets. Researchers have also explored analyst role albeit from a different angle. Thomas (1993) argues that analysts’ importance should be studied by discussing (1) their marginal influence, (2) their predictive power/accuracy, and (3) their incentives and conflicts of interest.
Chung and Jo (1996) addressed the first question in Thomas’ (1993) proposed framework, and were able to find evidence of the influence that security analysts’ monitoring and reporting have on firms’ market value and management decisions. They found that the monitoring role of analysts is seen like a supervisory function on firms’ decisions and results, marketing them to investors, enhancing their knowledge on the firms. As a result, they defend that analysts are able to affect firm’s market value by influencing manager’s decisions and by their ability to communicate it to the market, i.e., affecting investment decisions. This was a fundamental output, evidencing the need for more research on this field that will explore the different ramifications of Thomas’ framework. Also, Stickel (1995) was able to find evidence of
9
recommendation revisions on stock prices, arguing that the “short term price reaction is a function of the strength of the recommendation” and the magnitude of the change.
Shifting the usual way of studying analyst’s recommendations, Green (2006) created an investment portfolio based on analyst’s recommendations, to understand at which extension they actually provide benefits to investors who have immediate access to it. Their results were also in line with Chung and Jo (1996), as they found incremental investment value for investors who follow recommendations as an investment “trigger”.
Ramnath, Rock and Shane (2008), on an important exercise of summarizing and reviewing the current knowledge on this research field, defined not only the Analysts' Reporting Environment, but also the list of analysts’ reporting outputs: Earnings Forecasts, Price Forecasts, Conceptual Description of the Firm’s Prospects and Recommendations. The latters, recommendations, are placed in a special basket, as they epitomize the output, i.e. the “true meaning”, of the other three. Also Womack’s (1996) recommendations’ interpretation, “I have analyzed publicly available information, and the current stock price is (or is not) right”, helps sustaining this point of view about recommendations as the ultimate output analysts give to market.
Analysts and their recommendations play a fundamental role, guiding investors in different times and events. Their role as specialists is particularly important when disruptor news come, as their expertise and privately acquired information is expected to give them a competitive advantage when building their opinion. Conrad et al. (2006) are able to prove that indeed both institutional and individual investors believe in this competitive advantage of analysts compared to other players in the market.
Given that M&A transactions are major events in the stock markets, it is surprising to find that, to my knowledge, no further literature on the analysts’ recommendations relation with M&A events. Furthermore, given the unclear conclusions on the M&A transactions research field relative to their performance, examining patterns on how analysts think and behave when faced with these events, can provide new evidence to existent literature and might help to explain the existing conundrum.
Conrad et al. (2006) examined “how analysts respond to major news, using large price changes as a proxy for the shocks”, following Ryan and Taffler’s (2004) methodology. This study represented a first step into studying how analysts can help investors with firm specific news and other micro events, in which M&A is included. However, for the purposes of this study, their results cannot be completely extended for this study, as they do not differentiate several factors that might influence their outputs, such as macroeconomic news, political and world events and, especially, news related with future cash flows and discounts rates (Cutler, Poterba and Summers, 1989), putting them all in the same basket. In this study, as I focus on M&A events, I don’t want to include those effects.
Current literature has already extensively studied the potential conflicts of interest and external factors, intrinsic to the analysts’ activity, that can affect the output of their work. O'Brien, McNichols and Hsiou-Wei (2005) explored their potential impartiality caused by Investment Banking relationships, finding a certain level of discrepancy in downgrading timings when there is a relationship between the brokerage house/investment bank and the analyzed company. Conrad et al. (2006) also prove this behavior, exposing a higher probability in a recommendation upgrade when there is a relationship in place. However, those resistances analysts have, tend to happen in minor changes in the firm’s environment, and not in bigger occurrences (Jegadeesh and Kim, 2009). M&A events are always bigger events, disrupting the
10
firm’s environment and activity, and so, those referred findings cannot be extrapolated to the scope of this study.
2.3 Hypothesis Development
Building on what has already been established in the literature and aiming at finding new evidence to support management and investors’ decisions, this study will merge analysts and M&A literature and bring a comprehensive analysis on the role of analysts’ recommendations in M&A. To study what happens to analysts’ recommendations after deal announcements, this dissertation will test the following hypotheses:
H1a: Recommendation revisions after the announcement of an M&A transaction should result, on average, to the acquirer’s downgrade.
H1b: Dispersion of recommendations about the acquirer, on average, decreases after the announcement of an M&A.
Despite the existent conundrum facing M&A performance, current literature tends to find value destruction on M&A deals, as evidenced by Moeller, Schlingemann and Stulz (2005). This underperformance, leading to shareholder’s wealth losses, should be taken in account by analysts when setting their recommendations. Therefore, a pessimism towards M&A is expected to be found on analysts’ recommendations changes. Furthermore, the confusion among analysts is going to be studied, using revisions’ standard deviation as proxy.
H2: Recommendation revisions on overvalued acquirers should, on average, be more positive than fair compared to undervalued companies for stock financed M&As.
Loughran and Vijh (1997) found that, one average, firms engaging in stock financed deals perform worse than those who do not, i.e. using cash, a mix between cash and equity, or any other type. However, as shown by Savor and Lu (2009), overvalued companies engaging in stock financed transactions perform better, as their value creation spectrum is amplified by their “cheap currency”. Furthermore, the risk sharing perspective explained by Sehgal, Banerjee and Deisting (2012), should increase the propinquity to be more positive. Extending the Market Timing Theory, “Sell” (Buy) and “Strong Sell” (Strong Buy) recommendations are going to be used as a proxy for overvaluation (undervaluation). We expect to find more optimism on analysts’ recommendations when facing such deals.
H3: Recommendation revisions on companies acquiring firms advised by tier-1 advisors should, on average, be more negative than when advised by tier-2.
Following Ismail (2009) findings, there’s the expectation that analysts have target advisors in consideration when setting their opinions. Differentiating tier-1 and tier-2 advisors, analysts are expected to be more pessimistic when publishing their recommendations after the deal announcement.
11
H4: Recommendation revisions should be, one average, more pessimistic towards knowledge motivated acquisitions.
Subsequent to recent findings on innovative performance of scientific firms, along with their negative market performance after engaging in knowledge motivated acquisitions (York and Wohar, 2006), this study expects analysts to be more negative on M&A engaged by those types of firms, using a cross sectional approach.
3. Sample Construction, Data and Univariate Analysis 3.1 Data & Sample Construction
To successfully investigate analyst’s recommendations behavior facing M&A events throughout the years, different types of data are needed. I based this study on data from the following databases:
• IBES U.S. Consensus Recommendations – to get all consensus data regarding recommendations for U.S. based firms
• IBES U.S. Detail History – to access analysts EPS estimates
• Thomson Reuters Eikon Dealscreener – to reach data concerning M&A deals • CRSP – to get securities data
• Compustat – to access firm specific accounting data
The sample construction began with IBES U.S. Consensus Recommendations database, accessing all data available at the time, which spans from January 1993 to September 2019, and includes 457,707 monthly observations for 10,294 different firms. Each observation in the database encompasses the consensus data for a specific firm in a specific month, as consensus data points are only calculated from month to month (typically between the 17th and the 19th of each month). Consensus, or Summary Statistics, consists of a summary of each analyst data, and acts as a proxy for analysts’ general sentiment on each firm (IBES, 2016). Recommendations in the database are coded as numeric data, from 1 to 5, respectively going from Strong Buy to Strong Sell (1=Strong Buy, 2=Buy, 3=Hold, 4=Sell, 5=Strong Sell).
Next, M&A data was collected from Thomson Reuters Eikon Dealscreener database for the same time period, from 1993 to September to 2019. Only completed deals above $100 million, for U.S. based companies, resulting in majority holdings, were considered. In total, this refined search includes over 29,049 M&A deals.
To complete the data collection, CRSP, Compustat and IBES U.S. Detail History databases were used to collect firm specific information and to match each observation from IBES Recommendations.
All variables used are listed and explained in Table XIV and Table XV.
After having all data collected, all datasets were merged based on Official Ticker and Year, hereinafter mentioned as Firm-Year, controlling for possible changes in tickers along time. The difficulty in merging the four databases, each one with different identifiers and observations, has resulted in the loss of observations on both M&A and IBES recommendations data, as can be seen in Table I.
Data was further cleaned for missing variables: information on recommendations, EPS estimates, accounting data, and stock market values. This led to another downsizing of the sample. To prevent any possible bias from considering outliers, observations below the
12
percentile 1 and above percentile 99, on accounting variables and EPS estimates, were excluded, along with firms presenting a negative market value.
As can be noticed in Table I, the number of Firm-years encompassing M&A deals only represents c 2% of the all sample. This type of under representation can undermine results (Tucker, 2011) when studying the impact of M&As on analyst’s recommendations. To mitigate this selection bias problem, I followed the Propensity Score Matching methodology as explained in (Glen, 2017), selecting “Mahalanobis distance” as the optimal algorithm for matching. The propensity score was calculated under the following regression:
(1) 𝑫𝒆𝒂𝒍𝒕+𝟏,𝒊= 𝜶 + 𝜷𝟏𝑻𝑬𝑺𝑻𝒕𝒊+ 𝜷𝟐𝑹𝑬𝑪𝒕𝒊+ 𝜷𝟑𝑺𝑰𝒁𝑬𝒕𝒊+ 𝜷𝟒𝑰𝑵𝑫𝒕𝒊+ 𝜷𝟓𝑩𝑴𝑲𝒕𝒊+ 𝜷𝟔𝑹𝑶𝑨𝒕𝒊+ 𝜷𝟕𝑹𝑶𝑬𝒕𝒊+ 𝜷𝟖𝑵𝑼𝑴𝑹𝑬𝑪𝒕𝒊+ 𝜷𝟗𝑨𝑮𝑬𝒕𝒊+ 𝜺𝒕𝒊
where Test is a dummy variable that equals 1 if the firm-year has a deal, and zero if not. Firm-years from firms that already registered at least one deal were excluded to prevent matching within the same firm. Firms where Test equals 0, are included in the control group.
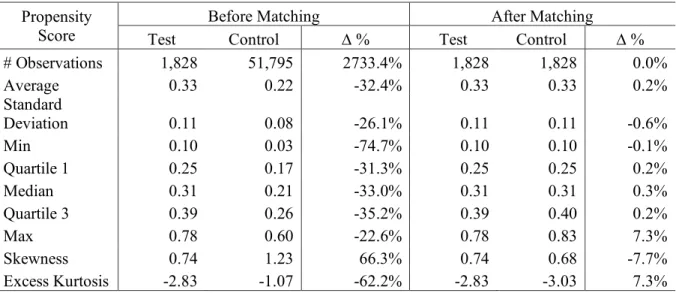
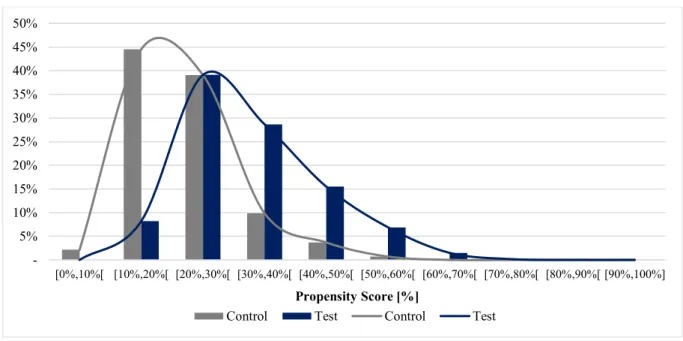
As can be seen in Figure I, there is in fact a separability in the data. Treated group has a higher propensity to engage in M&A, with over 80% of the observations falling between the 20% and 50% propensity interval. Table II shows the summary statistics for each group considered, Test and Control, before and after the matching process.
As can be noticed, before the matching process, the Control group (firm-years without M&A) presents a wider dispersion among scores, with an Excess Kurtosis of c. -2.83, compared to the -1.07 of the Test group (firm-years with M&A). We can also notice a disparity in skewness values, with the Control group registering a more positive value, of 1.23, confirming the longer right tail in the graph present in Figure I. These differences in the distribution led to a difference in average and median values, with the Control group presenting respectively values of c.22% and c.21%, below the Test Group with 33% and 31%. After the under-sampling caused by the matching process, both distributions turned to be very similar. The Control Group was reduced to the same amount of observations of the Test Group (best fitting pair for each observation in the sample), with just small differences in the average, standard deviation, skewness and excess kurtosis. These values confirm the success in the sample reduction to a more comparable sample, and led to the construction of the final database.
3.2 Univariate Analysis & Descriptive Statistics 3.2.1 All Sample
Table III provides a general overview among the distributions of recommendations before and after revision, for each type of recommendation, along with the type of revision (upgrades, downgrades or without a change), discriminating between firm-years with and without an M&A deal. It is important to refer that, since I’m using the consensus, revisions in recommendations for firms with a M&A deal might happen in 1 to 31 days after the deal is announced (consensus recommendations are published monthly between the 14th and 19th day of each month). The distribution of the number of days to revision, after the deal announcement, can be found on
Figure V, where a fair distribution among the brackets can be found. However, there is a higher concentration on the left side of the graph, meaning most revisions (c. 56%) were done closer to the deal announcement (until 15 days after).
13
For both before and after revisions, for all firm-years, there is a higher concentration among “Buy” of c. 63% of the sample, with an average recommendation of 2.27 and 2.26 respectively. These values are in line with what was found by Conrad et al. (2006) and Stickel (1995), evidencing a concentration around 2.1, which is approximately a “Buy”, confirming the representativity of the sample.
Following Stickel (1995), if analyst’s recommendations are indeed upwardly biased in the distribution, the average revision should be more limited for positive changes, as there is less room for improvement. This result leverages the importance to control for the starting recommendation, as it’s done in this analysis.
The difference in distributions between firm-years with and without M&A deals shows, however, a slight disparity. There is a higher concentration on “Buy” for firm-years with a deal, weighting around 72%, and “Hold”, with c. 25%. As for firm-years without M&A, we can still observe “Buy” as the most represented recommendation, with c. 54%, but with “Hold” gaining more relevance and weighting more than 37% of sample. More extreme recommendations, such as “Strong Buy” and “Strong Sell” have low representativity, which is also in line with the distribution found by Conrad et al. (2006).
Results in Table III also show that the sample is dominated by no changes in recommendations for the all sample (with and without M&A), weighting c. 55%, followed by downgrades and upgrades, respectively with c. 25% and 20%. When focusing on firm-years with M&A, we already start noticing some difference in the analyst’s response to M&A announcements, with Upgrades and Downgrades increasing in their weight. In fact, downgrades almost double their weight, to c. 31%, compared to firm-years without deals, c. 18%.
However, after revision, the distribution of recommendations for firm-years with M&A is still in line with was seen before revision, but with a slightly higher concentration among “Buy”. Notwithstanding, the average recommendation falls from 2.23 to 2.21, and the standard deviation of recommendations also decreases, from 0.78 to 0.77, indicating a smaller disparity in analysts’ opinion. Another interesting fact is the drop in “Sell” representation from c. 1.5% to c. 0.6% after revision.
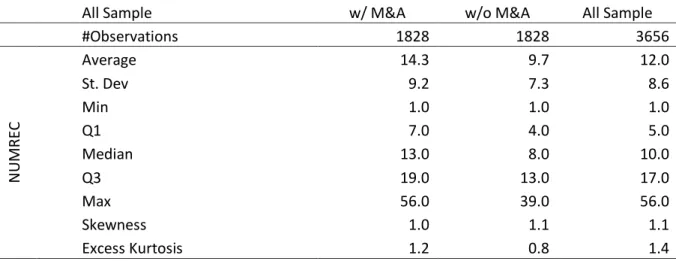
An equally interesting variable to study is the number of analysts following each stock (for each observation). As can be noticed in Figure II,there’s a wide dispersion among the number of following analysts, with a slight concentration on the left side (smaller number of analysts). This fact can be confirmed in Table IV(NUMREC descriptive statistics), where a high Standard Deviation of the number of recommendations per observation can be noticed, along with a positive Excess Kurtosis of 1.4, confirming the lower concentration observed in the graph. The skewness of the distribution can also be confirmed with its positive value of 1.1, explaining the right tail of the distribution. To deal with this platykurtic distribution, the number of recommendations per observation (or NUMREC) used in the multivariate analysis was normalized by using the normal logarithm.
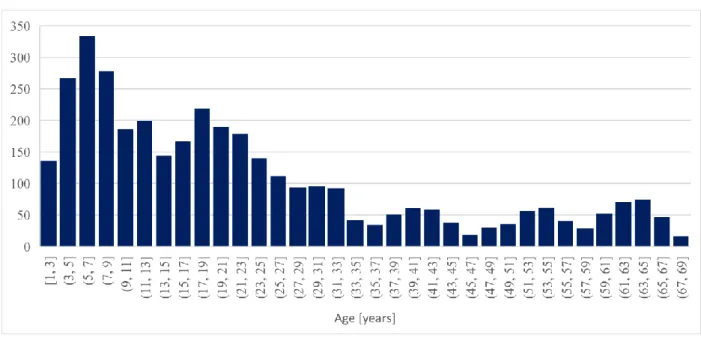
As for the age of firms in the sample, Figure III shows the distribution in the sample, complemented with the values of Table V, discriminating for observations with and without a deal. It is interesting to observe that firms with M&A have an average age higher than those without (the same can be said for the median). Both samples present similar skewness, but observations with M&A present a positive excess kurtosis of 0.5, while those without register the opposite, with -0.5, meaning that the distribution of observations with a deal presents fatter tails.
14
3.2.2 M&A Sample
Tables VII - VIII, only contain observations with M&A deals, to understand more about the 1,828 deals included in the sample. As referred in the beginning of the section, M&A deals with a volume lower than $100m were not considered.
Figure IV is a histogram with intervals of $100m, from $100 to $1,000, and gives a first glance at the distribution of the size of the deals considered. We can already notice the predominance of deals on the lower boundary of the graph, with more than 31% of the deals being announced with a value between $100m and $200m. From there, we can also observe a decrease in the number of observations as the deal size goes up. If the graph continued to plot intervals of $100m for deals above $1,000, this tendency would continue to be true.
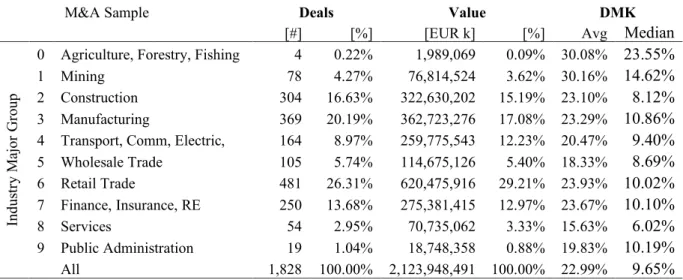
Table VI complements Figure IV, with a more insightful analysis, splitting the sample by Industry Major Group. We can see that c. 46% of the deals occurred within Manufacturing and Retail Trade – respectively weighting c. 20% and c. 26%. When looking at deal values, these two industries are still the most represented ones, but with Retail Trade gaining more weight, with c. 29%. This happens due to the average deal size, amounting to c. $1,310k in that industry, higher than the sample average of $1,161k. Another interesting variable to focus is Deal to Market Value of firm (DMK). The sample has a median of c. 9.65%, while Retail Trade has 10.86%, indicating a higher relative valuation of deals in this industry. On the other hand, Construction and Wholesale Trade, with medians of 8.12% and 8.69%, reveal a lower relative valuation than the sample. Deals among the Agriculture, Forestry, Fishing and Public Administration have low representativity in the sample, thus being biased for the present observations.
Table VII reveals the distributions of deals within different types of financing. The first thing to notice is the high reliance on Cash financed deals, with almost 60% of sample, while the alternative options share similar weights between 12% and 14%. Another interesting fact is that mix financing seems to be the most used option for larger deals, with an average deal of 2.5x higher the average deal size, of c. $1,161k, thus increasing its weight in the sample for more than 32% when taking into consideration the size of each deal. Regarding deal Size to acquirer market value (DMK), Mix Financing also stands out with the highest values.
In Table VIII we can observe the dispersion of deals among the different types of starting recommendation. We can start by noticing the low weight of more extreme recommendations, with “Strong Sell” not even having one recommendation. Even “Sell”, with just 1.53% of the sample, has a really low representation. On the other hand, “Hold” and “Buy”, together, represent more than 96% of the sample. As for DMK, “Strong Buy” and “Sell” present higher values than the sample, respectively with medians of 21.65% and 22.99%, almost doubling the median found in the sample of 9.65%.
All these changes in the origination of each deal announcement can impact analyst’s recommendations when analyzing firm, revealing the importance of including them in this study, guarantying more accuracy in the tested hypothesis in analyzed on the next section. 4. Results and Discussion
As explained in section 3.1, recommendations are grouped into five discrete categories, from 1 to 5. By using the Consensus database, however, this means that I have in my sample firms with a recommendation of 2.14, approximately a buy, or a 3.65, approximately a sell, meaning that these observations cannot be perfectly split by 5 categories. With regards to this
15
characteristic of data, the use of Ordinary Least Squares (OLS) analysis is acceptable. Furthermore, Conrad et al. (2006), the most similar study to this one, also followed this type of analysis (also including an ordered probit analysis).
This study will mainly use Recommendation levels after recommendation revisions as dependent variable (referred to RECt+1) and M&A related variables as the key independent variables. As already explained in section 2 and briefly explored in section 3, since recommendation levels can also be affected by other factors, all multivariate analysis are controlled for external factors and recommendation starting position (referred to as RECt), as explained further.
In this analysis I’m specifically looking onto the impact of explanatory variables in the revision recommendation and, also as in Conrad et al. (2006), pp. 37, I’ll work under the assumption of a “standardized unit normal distributed error term, i.e., ɛ ~ N (0,1)”.
4.1 Hypothesis 1 4.1.1 Hypothesis 1A
The main empirical question I try to answer in this study is related to the analyst’s response to M&A announcements. As previously explained in Section 2.2, recommendations are the main proxy of analyst’s sentiment on the firm current position (Womack, 1996) and are the ones being analyzed.
To measure this sensibility to such important market events like M&A transactions, recommendation levels before and after revision are measured for all the sample, which includes observations with and without M&A after under sampling through propensity scores, as explained in section 3.1.
To account for this, the following regression model is employed:
(2) 𝑹𝑬𝑪𝒕+𝟏,𝒊 = 𝜶 + 𝜷𝟏𝑫𝑬𝑨𝑳𝒕𝒊 + 𝜷𝟐𝑹𝑬𝑪𝒕𝒊+ 𝜷𝟑𝑺𝑰𝒁𝑬𝒕𝒊+ 𝜷𝟒𝑰𝑵𝑫𝒕𝒊+ 𝜷𝟓𝑩𝑴𝑲𝒕𝒊+ 𝜷𝟔𝑹𝑶𝑨𝒕𝒊+ 𝜷𝟕𝑹𝑶𝑬𝒕𝒊+ 𝜷𝟖𝑵𝑼𝑴𝑹𝑬𝑪𝒕𝒊+ 𝜷𝟗𝑨𝑮𝑬𝒕𝒊+ 𝜷𝟏𝟎𝑫𝑴𝑲𝒕𝒊+ 𝜺𝒕𝒊
where RECt+1 stands for the recommendation consensus level after revision, RECt is the recommendation consensus level before revision and DEAL is a dummy variable that equals 1 if the observation includes an M&A deal between RECt+1 and RECt. The remaining variables are used as controls and are explained in Table XIV and Table XV.
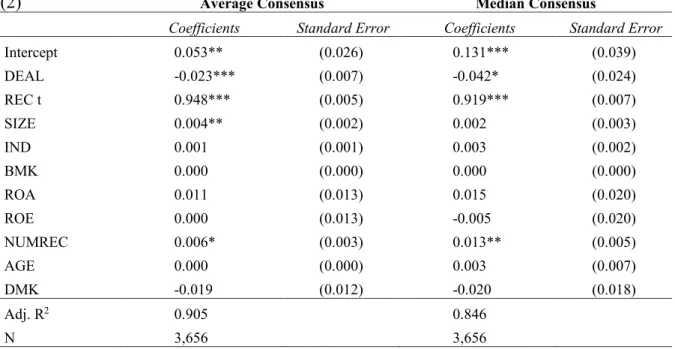
Table XI shows the coefficients and standard errors of equation (2). Using average recommendation consensus, DEAL denotes a statistically significant negative influence on the average revision of approximately -0.23%. The same influence is found where median recommendation values are used instead, although a little bit more impactful, with a value close to -0.42%, also statistically significant at 1% level.
These results are in line with current literature defending that on average M&A deals are value destroyers for acquirer shareholders. These results are also consistent with the belief that analysts have competitive advantages when setting their opinions, as shown in Conrad et al. (2006).
Knowing analysts’ predictions are coherent with future market performance of M&A deals opens a new spectrum of analysis regarding M&A and analyst’s recommendations, also imputing a new investment value to their recommendations. As shown in section 2.1, M&A
16
events are game changers in financial markets, as they disrupt previous stock price behavior, with the introduction of an “external organ” (Berkovitch and Narayana, 1993).
These results are also in line with what Haushalter and Lowry (2010) document in their study, that banks are actually adapting their stockholdings according to their analysts’ opinions on M&A.
4.1.2 Hypothesis 1B
This hypothesis is an extension from the rationale present in the first one. If analysts are indeed more negative towards M&A, then the dispersion level of recommendations should decrease, as they are converging their opinion onto the same direction.
As such, the standard deviation of the consensus was used as proxy for the level of dispersion and tested before and after the deal announcement, following the model below:
(3) 𝑹𝑬𝑪𝑺𝑫𝒕+𝟏,𝒊= 𝜶 + 𝜷𝟏𝑫𝑬𝑨𝑳𝒕𝒊 + 𝜷𝟐𝑹𝑬𝑪𝒕𝒊+ 𝜷𝟑𝑺𝑰𝒁𝑬𝒕𝒊+ 𝜷𝟒𝑰𝑵𝑫𝒕𝒊+ 𝜷𝟓𝑩𝑴𝑲𝒕𝒊+ 𝜷𝟔𝑹𝑶𝑨𝒕𝒊+ 𝜷𝟕𝑹𝑶𝑬𝒕𝒊+ 𝜷𝟖𝑵𝑼𝑴𝑹𝑬𝑪𝒕𝒊+ 𝜷𝟗𝑨𝑮𝑬𝒕𝒊+ 𝜷𝟏𝟎𝑫𝑴𝑲𝒕𝒊+ 𝜷𝟏𝟏𝑹𝑬𝑪𝑺𝑫𝒕𝒊+ 𝜺𝒕𝒊
Where RECSDt+1 stands for the recommendation consensus standard deviation after revision, RECSDt for the standard deviation before revision and DEAL is the same dummy found in equation (2). The remaining control variables are explained in detail in Table XIV and Table XV.
Results of equation (3) can be consulted on Table X, where coefficients and standard errors are reported. Using average consensus, results evidence a contrary relationship between the existence of deals and the consensus dispersion, as the statistically significant value of 0.8% shows. So, instead of converging opinions, analysts are actually diverging their recommendations when facing a deal announcement. However, using median consensus, there are no significant results and no conclusions can be made.
The same relationship was tested using Earnings per Share (EPS) standard deviation before and after revision, but no statistically significant results were found.
Despite being the opposite relationship than the one formulated in the hypothesis, the results founded in this test are still making sense.
The first factor to notice is that this study is analyzing the reaction to the deals’ announcements, and not closing. This first fact creates a first barrier to information flow, as many deal specifics are still to made public, or even to be discussed.
Each analyst can have a different opinion on value capturing, structure of the deal or even regarding the implied premium, as not all firms are publicly listed. As so, even considering that most M&A deals lead to value destruction, it is not surprising to find that per se, it is not enough to lead to a converging behavior in the opinion of all analysts.
4.2 Hypothesis 2
Now focusing on observations with an M&A deal only, it is important to try to differentiate different behaviors within the analyzed revisions.
This second hypothesis tests what’s evidenced by Savor and Lu (2009) regarding different timings and type of financing on the acquisitions. This analysis was undertaken through the following regression model:
17
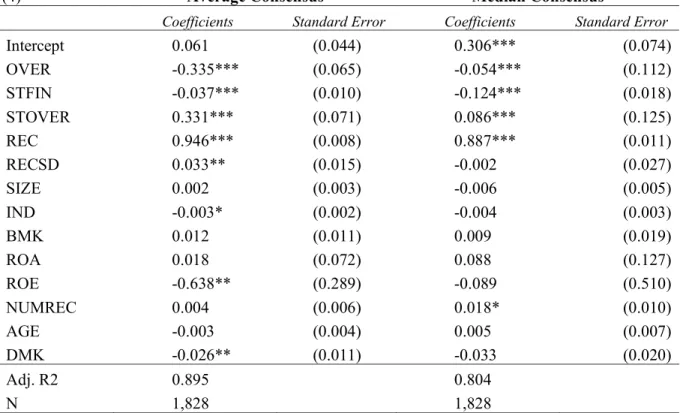
(4) 𝑹𝑬𝑪𝒕+𝟏,𝒊 = 𝜶 + 𝜷𝟏𝑶𝑽𝑬𝑹𝒕𝒊+ 𝜷𝟐𝑺𝑻𝑭𝑰𝑵𝒕𝒊+ 𝜷𝟑𝑺𝑻𝑶𝑽𝑬𝑹𝒕𝒊+ 𝜷𝟒𝑹𝑬𝑪𝒕𝒊+ 𝜷𝟓𝑹𝑬𝑪𝑺𝑫𝒕𝒊+ 𝜷𝟔𝑺𝑰𝒁𝑬𝒕𝒊+ 𝜷𝟕𝑰𝑵𝑫𝒕𝒊+ 𝜷𝟖𝑩𝑴𝑲𝒕𝒊+ 𝜷𝟗𝑹𝑶𝑨𝒕𝒊+ 𝜷𝟏𝟎𝑹𝑶𝑬𝒕𝒊+ 𝜷𝟏𝟐𝑵𝑼𝑴𝑹𝑬𝑪𝒕𝒊+ 𝜷𝟏𝟑𝑨𝑮𝑬𝒕𝒊+ 𝜷𝟏𝟒𝑫𝑴𝑲𝒕𝒊+ 𝜺𝒕𝒊
where OVER is a dummy variable, used as a proxy for overvalued firms, that equals 1 if the firm starting recommendation is approximately a “Sell” or “Strong Sell”, STFIN is a dummy variable that equals 1 if the deal was 100% financed through equity and STOVER is a dummy variable that equals 1 if the deal was done by an overvalued acquirer and stock financed. The remaining control variables are explained in detail in Table XIV and Table XV.
The results of this test are shown in Table XI. The first thing to notice is the statistically significance of the three explanatory variables analyzed. Looking at variable OVER, the coefficient of -0.335 reveals that being overvalued per se influences negatively revisions of recommendations. The same can be said for those deals using stock financing, as can be seen by the coefficient of the variable STFIN. However, and as expected, when both conditions are met at the same time, the average recommendation revision is positively influenced, as can be noticed by the positive value of 0.331.
These results evidence the positive influence of an overvaluation on the overlook of the acquirer, and also confirm the use of analysts’ recommendations as a proxy for an overvalued stock.
As shown in Loughran and Vijh (1997), acquirers financing deals through stock are linked to poorer performance. The referred results also confirm this theory, with analysts’ outlook being negatively affected by that type of financing. The same can be said about firms considered as overvalued, despite the fact of not existing at the moment (as to my knowledge) past literature regarding that behavior.
As to deals where the two conditions are met – being overvalued and financing the deal through equity – these results show a positive influence in analysts’ recommendations, which goes in line with what is referred by Savor and Lu (2009) and the rationale of using equity as cheap currency, or a way to buy hard assets at discount.
4.3 Hypothesis 3
Following the proposed hypothesis, the third test regards to the target side of the deal, i.e. the acquired firm. As evidenced in Ismail (2009), despite the fact of the non-existence of a significant influence on the M&A performance caused by the reputation of the acquirer advisor, there is in fact a relationship regarding the target advisor. According to him, the existence of a top adviser on the sell-side, increases the premium paid by the acquirer, diminishing its returns on the acquisition and hurting the firm’s long-term market performance.
As a way to understand how analysts respond to this event within M&A, the following regression was run within the observations with a M&A deal:
(5) 𝑹𝑬𝑪𝒕+𝟏,𝒊 = 𝜶 + 𝜷𝟏𝑻𝑰𝑬𝑹𝟏𝒕𝒊 + 𝜷𝟐𝑹𝑬𝑪𝒕𝒊+ 𝜷𝟑𝑹𝑬𝑪𝑺𝑫𝒕𝒊+ 𝜷𝟒𝑺𝑰𝒁𝑬𝒕𝒊+ 𝜷𝟓𝑰𝑵𝑫𝒕𝒊+ 𝜷𝟔𝑩𝑴𝑲𝒕𝒊+ 𝜷𝟕𝑹𝑶𝑨𝒕𝒊+ 𝜷𝟖𝑹𝑶𝑬𝒕𝒊+ 𝜷𝟗𝑵𝑼𝑴𝑹𝑬𝑪𝒕𝒊+ 𝜷𝟏𝟎𝑨𝑮𝑬𝒕𝒊+ 𝜷𝟏𝟏𝑫𝑴𝑲𝒕𝒊+ +𝜺𝒕𝒊
18
where TIER1 is a dummy variable that equals 1 if the target company being acquired is advised by TIER1 advisor, as defined in section 3.1. The remaining control variables are explained in detail in Table XIV and Table XV.
Table XII provides the results from equation 5, for the two versions of the dataset (using average and median consensus). As can be observed, both versions present significant results towards the same direction, with a negative impact of -0.02 on the recommendation revision of firms acquiring targets supported by Tier-1 advisors.
These results confirm the tested hypothesis and are consistent with what Ismail (2009) finds in his study, meaning that there is in fact a negative influence in the acquirer recommendation revision when he’s announcing a deal for a target advised by a Tier-1 advisory firm.
4.4 Hypothesis 4
My last hypothesis regards to M&A engaged in knowledge-acquisition purposes. As referred in section 2.1, the financial markets seem to punish firms who prefer to buy knowledge rather than developing by their own resources, provoking a negative market response on deal announcements.
To explore this fact, it’s interesting to perceive how analysts, as close followers of these companies, react to those deals. As so, the following equation is run to understand how this type of deals might impact their recommendations:
(6) 𝑹𝑬𝑪𝒕+𝟏,𝒊 = 𝜶 + 𝜷𝟏𝑺𝑭𝑰𝑹𝑴𝒕𝒊 + 𝜷𝟐𝑹𝑬𝑪𝒕𝒊+ 𝜷𝟑𝑹𝑬𝑪𝑺𝑫𝒕𝒊+ 𝜷𝟒𝑺𝑰𝒁𝑬𝒕𝒊+ 𝜷𝟓𝑩𝑴𝑲𝒕𝒊+ 𝜷𝟔𝑹𝑶𝑨𝒕𝒊+ 𝜷𝟕𝑹𝑶𝑬𝒕𝒊+ 𝜷𝟖𝑵𝑼𝑴𝑹𝑬𝑪𝒕𝒊+ 𝜷𝟗𝑨𝑮𝑬𝒕𝒊+ 𝜷𝟏𝟎𝑫𝑴𝑲𝒕𝒊+ 𝜺𝒕𝒊
where SFIRM, referring to Scientific Firms, is a dummy variable that equals 1 if the acquirer belongs to one of the industries defined by Griliches and Mairesse (1981) and the remaining are control variables explained in detail in Table XIV and Table XV.
Table XIII shows the results from equation (6), where no conclusions can be reached regarding the influence of knowledge-acquisition M&A deals on recommendation revisions.
The existence of non significant results may be led by some factors, as I’ll explain next. The first one regards the literature time period, as most most literature regarding this topic in specific is at least 15 years old. Since then, we underwent trough a crisis and a fast recovery period that might have behaved in a different way than the periods previously studied, requesting further literature on specific for this topic.
The second one concerns the deal Rationale and selected proxy. Following Griliches and Mairesse (1981), one of the top studies analyzing this topic, the proxy for a knowledge-acquisition deal was to be categorized as a Scientific Firm. This approach has two problems: defines a scientific firm as a firm belonging to a certain industry (explained in the next point), which may not be case, and does not control for the reasoning behind the deal, that may follow different motivations – knowledge acquisition, business horizontal or vertical growth, fiscal diversification or any other acceptable reason to engage in M&A.
Next, the Industry Selection might also play an important role. As referred, belonging to one of the industries referred in Griliches and Mairesse (1981) will act as the proxy “switcher” to be categorized as Scientific firm, i.e., to consider the deal as knowledge-acquisition. However, this categorization was defined almost 40 years ago, and includes, for example, companies in gas and oil industries, which at the time might have made sense, but today does not.
19
Lastly, the is the rationale behind the hypothesis. As referred in section 2.1, the acquisition of a firm (or a major part of it) can act as guarantee of future sales and performance, even if the implied premium on the deal is considered high. This conundrum between what’s the best solution for the firm, as explained in Neville (2019), might be interpreted in different ways by different analysts for different cases, impeding further conclusions on this topic.
5. Conclusion
The aim of this study is to introduce a new way of studying M&A deals, using the comprehensive skills and predictive power disclosed by analysts through recommendations. Current M&A literature is inconsistent, confusing and many times wrong, restraining the comparability of new evidence and blocking new findings.
Based on the most established findings in M&A, this study was able to prove the capability of analysts when forecasting future firms’ performance, being able to match this study’s findings with the referred literature.
As so, I can conclude that despite the increasing dispersion in recommendations after a revision, an M&A deal has in fact a negative impact on newly issued recommendations. This finding is line with most of the current literature, defending that overall, M&A activity is destroying value for shareholders.
Digging into M&A activity, some deal specifics were also tested and confirmed, again reinforcing analysts’ forecasting skills. I was able to prove that analysts also believe that being overvalued per se is a negative indicator of post-deal performance, and the same can be said for stock financed deals. However, and as predicted, the “cheap currency” rationale over the usage of overvalued stock to finance new deals was confirmed, with analysts reacting positively to deals of that kind.
The impact of the type of advisor chosen by the target firm was also analyzed, confirming the hypothesis that being supported by a tier-1 advisor has a negative impact on the acquirer, with analysts reacting in a more pessimistic way.
Lastly, the usage of M&A as knowledge acquisition was also tested, but no conclusions could be taken due to the limitations of the proxy used and data availability.
These findings open a new spectrum of analysis for both M&A and analyst’s recommendations. For M&A, by perceiving the meaning of recommendations on such special and disrupt events, investors might find in analyst’s opinion the needed guide when adapting their portfolios. As for managers, by understanding how analysts may react to certain facts, they can optimize their behavior to protect shareholder’s wealth.
To understand the relevance of this study, it is also important to refer the shortcomings of the analysis. Firstly, as the scope of this study is on American-based companies, the most covered market in the world, it cannot be extrapolated to other geographies. Secondly, regarding data usage, and as referred in section 2, I incurred in several data loss due to missing values or incompatibility between the 4 databases used. Another important factor concerns the time period between the deal announcement and the consensus revision date, as it changes from case to case (between 1 and 31 days) and might be impacted by other elements that may happen in between.
Following the results of this analysis, future research on the topic would complement this study and allow a more comprehensive view over M&A and the way analysts react to it. An interesting way to study the topic would be to follow the methodology by Green (2006), and create an investment strategy that would invest on firms announcing deals according to the
20
consensus recommendation. Also, understanding the change in analysts’ forecasts (ex. EPS) would add a deeper comprehension of the way they perceive each type of deal.
21
6. References
André, P., Kooli, M. and L'Her, J. (2004). The Long-Run Performance of Mergers and Acquisitions: Evidence from the Canadian Stock Market. Financial Management, pp.27-43. Bauer, F. and Matzler, K. (2013). Antecedents of M&A success: The role of strategic complementarity, cultural fit, and degree and speed of integration. Strategic Management Journal, 35(2), pp.269-291.
Berkovitch, E. and Narayanan, M. (1993). Motives for Takeovers: An Empirical Investigation. The Journal of Financial and Quantitative Analysis, 28(3), p.347. Bild, M., Guest, P., Cosh, A. and Runsten, M. (2002). Do Takeovers create Value? A Residual Income approach on U.K. Data. ESRC Centre for Business Research.
Bruner, R. (2002). Does M&A Pay? A Survey of Evidence for the Decision-Maker. Journal of Applied Finance, 12(1), pp.48-68.
Capron, L. and Pistre, N. (2002). When do acquirers earn abnormal returns?. Strategic Management Journal, 23(9), pp.781-794.
Cartwright, S. and Schoenberg, R. (2006). Thirty Years of Mergers and Acquisitions Research: Recent Advances and Future Opportunities. British Journal of Management, 17(S1), pp.S1-S5.
Chakrabarti, A. and Mitchell, W. (2004). A Corporate Level Perspective on Acquisitions and Integration.
Christensen, C., Alton, R., Rising, C. and Waldeck, A. (2011). The big idea: The new M&A playbook. Harvard Business Review.
Chung, K. and Jo, H. (1996). The Impact of Security Analysts' Monitoring and Marketing Functions on the Market Value of Firms. The Journal of Financial and Quantitative Analysis, 31(4), p.493.
Cloodt, M., Hagedoorn, J. and Van Kranenburg, H. (2006). Mergers and acquisitions: Their effect on the innovative performance of companies in high-tech industries. Research Policy, 35(5), pp.642-654.
Conrad, J., Cornell, B., Landsman, W. and Rountree, B. (2006). How Do Analyst Recommendations Respond to Major News?. Journal of Financial and Quantitative Analysis, 41(1), pp.25-49.
Cutler, D., Poterba, J. and Summers, L. (1989). What moves stock prices?. The Journal of Portfolio Management, 15(3), pp.4-12.
Das, A. and Kapil, S. (2012). Explaining M&A performance: a review of empirical research. Journal of Strategy and Management, 5(3), pp.284-330.
Gleason, C., Bruce Johnson, W. and Li, H. (2012). Valuation Model Use and the Price Target Performance of Sell-Side Equity Analysts*. Contemporary Accounting Research, 30(1), pp.80-115.
Glen, S. (2017). Propensity Score Matching. [online] Xlstat, Your data analysis solution. Available at: https://www.xlstat.com/en/solutions/features/propensity-score-matching [Accessed 30 Nov. 2019].
22
Green, T. (2006). The Value of Client Access to Analyst Recommendations. Journal of Financial and Quantitative Analysis, 41(1), pp.1-24.
Griliches, Z. and Mairesse, J. (1981). Productivity and R&D at the Firm Level. NBER Working Paper, (826).
Hackbarth, D. and Morellec, E. (2008). Stock Returns in Mergers and Acquisitions. The Journal of Finance, 63(3), pp.1213-1252.
Hagedoorn, J. and Cloodt, M. (2003). Measuring innovative performance: is there an advantage in using multiple indicators?. Research Policy, 32(8), pp.1365-1379.
Harford, J., Humphery-Jenner, M. and Powell, R. (2012). The sources of value destruction in acquisitions by entrenched managers. Journal of Financial Economics, 106(2), pp.247-261.
Haushalter, D. and Lowry, M. (2010). When Do Banks Listen to Their Analysts? Evidence from Mergers and Acquisitions. Review of Financial Studies, 24(2), pp.321-357.
Hong, H. and Kubik, J. (2003). Analyzing the Analysts: Career Concerns and Biased Earnings Forecasts. The Journal of Finance, 58(1), pp.313-351.
Houston, J., James, C. and Karceski, J. (2006). What a Difference a Month Makes: Stock Analyst Valuations Following Initial Public Offerings. Journal of Financial and
Quantitative Analysis, 41(1), pp.111-138. IBES (2016). IBES User Guide. IBES, p.25.
Ismail, A. (2009). Are good financial advisors really good? The performance of investment banks in the M&A market. Review of Quantitative Finance and Accounting, 35(4), pp.411-429.
Jegadeesh, N. and Kim, W. (2009). Do Analysts Herd? An Analysis of Recommendations and Market Reactions. Review of Financial Studies, 23(2), pp.901-937.
Jegadeesh, N., Kim, J., Krische, S. and Lee, C. (2004). Analyzing the Analysts: When Do Recommendations Add Value?. The Journal of Finance, 59(3), pp.1083-1124.
Lin, H. and McNichols, M. (1998). Underwriting relationships, analysts' earnings forecasts and investment recommendations. Journal of Accounting and Economics, 25(1), pp.101-127.
Loughran, T. and Vijh, A. (1997). Do Long-Term Shareholders Benefit From Corporate Acquisitions?. The Journal of Finance, 52(5), p.1765.
Lubatkin, M. (1987). Merger strategies and stockholder value. Strategic Management Journal, 8(1), pp.39-53.
Merkley, K., Michaely, R. and Pacelli, J. (2017). Does the Scope of the Sell-Side Analyst Industry Matter? An Examination of Bias, Accuracy, and Information Content of Analyst Reports. The Journal of Finance, 72(3), pp.1285-1334.
Michaely, R. and Womack, K. (1999). Conflict of Interest and the Credibility of
Underwriter Analyst Recommendations. Review of Financial Studies, 12(4), pp.653-686. Moeller, S., Schlingemann, F. and Stulz, R. (2005). Wealth Destruction on a Massive Scale? A Study of Acquiring-Firm Returns in the Recent Merger Wave. The Journal of Finance, 60(2), pp.757-782.
23
Mukherjee, T., Kiymaz, H. and Baker, H. (2004). Merger Motives and Target Valuation: A Survey of Evidence from CFOs. Journal of Applied Finance, 14.
Munos, B. (2009). Lessons from 60 years of pharmaceutical innovation. Nature Reviews Drug Discovery, 8(12), pp.959-968.
Neville, S. (2019). Patent panic gives green light to mega pharma deals. Financial Times. [online] Available at:
https://www.ft.com/content/bc847e04-9804-11e9-8cfb-30c211dcd229.
O'Brien, P., McNichols, M. and Hsiou-Wei, L. (2005). Analyst Impartiality and Investment Banking Relationships. Journal of Accounting Research, 43(4), pp.623-650.
Ramnath, S., Rock, S. and Shane, P. (2008). The financial analyst forecasting literature: A taxonomy with suggestions for further research. International Journal of Forecasting, 24(1), pp.34-75.
Savor, P. and Lu, Q. (2009). Do Stock Mergers Create Value for Acquirers?. The Journal of Finance, 64(3), pp.1061-1097.
Schipper, K. (1991). Analysts' Forecasts. Accounting Horizons, 5, pp.105-121.
Sehgal, S., Banerjee, S. and Deisting, F. (2012). The Impact of M&A Announcement and Financing Strategy on Stock Returns: Evidence from BRICKS Markets. International Journal of Economics and Finance, 4(11).
Stickel, S. (1995). The Anatomy of the Performance of Buy and Sell Recommendations. Financial Analysts Journal, 51(5), pp.25-39.
Taffler, R. and Ryan, P. (2004). What Firm-Specific News Releases Drive Economically Significant Stock Returns and Trading Volumes?. Journal of Business Finance &
Accounting, 31(1).
Thomas, J. (1993). Comments on ‘Earnings forecasting research: its implications for capital markets research’, by L. Brown. International Journal of Forecasting, 9(3), pp.325-330. Tucker, J. (2011). Selection Bias and Econometric Remedies in Accounting and Finance Research. Journal of Accounting Literature, [online] 29(31-57), pp.1-37. Available at: https://ssrn.com/abstract=1756911 [Accessed 30 Nov. 2019].
Womack, K. (1996). Do Brokerage Analysts' Recommendations Have Investment Value?. The Journal of Finance, 51(1), p.137.
York, A. and Wohar, M. (2006). Stock Market Reactions to knowledge-motivated acquisitions. Academy of Management Proceedings, 2006(1), pp.E1-E6.
Zephyr (2019). Global M&A Review 2018. [online] Bureau Van Dijk. Available at: https://www.bvdinfo.com/BvD/media/reports/Global-M-A-Review-2018.pdf [Accessed 5 Oct. 2019].
24
7. Tables & Figures 7.1 Tables
Table I Sample Size Evolution
Evolution of the number of observations throughout the process of sample construction. Data size was significantly affected by the usage of different databases and the difficulty to link the observations of each. The usage of propensity score matching also affected the sample by reducing the observations without a M&A deal to the best fitting pair.
Steps IBES Rec M&A M&A/IBES
[#] [#] [%]
1. Initial Data 457,707 29,049 6.35%
2. Merge IBES with Dealscreener 457,707 7,192 1.57%
3. Merge with Compustat 357,908 6,184 1.73%
4. Merge with CRSP 203,982 4,033 1.98%
5. Merge with IBES Detail 203,982 4,033 1.98%
6. Cleaning Missing Variables 103,972 1,953 1.88%
7. Winsorizing 90,637 1,828 2.02%
8. Propensity Score Matching 3,656 1,828 50.00%
Table II Propensity Scores Distribution before and after Matching
Distribution of each sample before and after the matching caused by the usage of Propensity Score Matching. This methodology selected the best fitting pair according to the equation (1), causing a convergence in both samples’ distribution and characteristics.
Propensity Score
Before Matching After Matching
Test Control ∆ % Test Control ∆ %
# Observations 1,828 51,795 2733.4% 1,828 1,828 0.0% Average 0.33 0.22 -32.4% 0.33 0.33 0.2% Standard Deviation 0.11 0.08 -26.1% 0.11 0.11 -0.6% Min 0.10 0.03 -74.7% 0.10 0.10 -0.1% Quartile 1 0.25 0.17 -31.3% 0.25 0.25 0.2% Median 0.31 0.21 -33.0% 0.31 0.31 0.3% Quartile 3 0.39 0.26 -35.2% 0.39 0.40 0.2% Max 0.78 0.60 -22.6% 0.78 0.83 7.3% Skewness 0.74 1.23 66.3% 0.74 0.68 -7.7% Excess Kurtosis -2.83 -1.07 -62.2% -2.83 -3.03 7.3%