https://doi.org/10.1007/s00380-018-1188-3
ORIGINAL ARTICLE
Prognostic value of age adjusted segment involvement score
as measured by coronary computed tomography: a potential marker
of vascular age
Chadi Ayoub
1,2,3· Leonard Kritharides
3,4· Yeung Yam
1· Li Chen
1· Alomgir Hossain
1· Stephan Achenbach
5·
Mouaz H. Al‑Mallah
6· Daniele Andreini
7· Daniel S. Berman
8· Matthew J. Budoff
9· Filippo Cademartiri
10·
Tracy Q. Callister
11· Hyuk‑Jae Chang
12· Kavitha Chinnaiyan
13· Ricardo C. Cury
14· Augustin Delago
15·
Allison Dunning
16· Gudrun Feuchtner
17· Millie Gomez
18· Heidi Gransar
8· Martin Hadamitzky
19·
Joerg Hausleiter
19· Niree Hindoyan
18· Philipp A. Kaufmann
20· Yong‑Jin Kim
21· Jonathon Leipsic
22· Erica Maffei
10·
Hugo Marques
23· Gianluca Pontone
7· Gilbert Raff
13· Ronen Rubinshtein
24· Leslee J. Shaw
25· Todd C. Villines
26·
James K. Min
18· Benjamin J. W. Chow
1,27Received: 14 September 2017 / Accepted: 18 May 2018 / Published online: 24 May 2018 © Springer Japan KK, part of Springer Nature 2018
Abstract
Extent of coronary atherosclerotic disease (CAD) burden on coronary computed tomography angiography (CCTA) as
meas-ured by segment involvement score (SIS) has a prognostic value. We sought to investigate the incremental prognostic value
of ‘age adjusted SIS’ (aSIS), which may be a marker of premature atherosclerosis and vascular age. Consecutive patients
were prospectively enrolled into the CONFIRM (Coronary CT Angiography EvaluatioN For Clinical Outcomes: An
InteR-national Multicentre) multiInteR-national observational study. Patients were followed for the outcome of all-cause death. aSIS
was calculated on CCTA for each patient, and its incremental prognostic value was evaluated. A total of 22,211 patients
[mean age 58.5 ± 12.7 years, 55.8% male) with a median follow-up of 27.3 months (IQR 17.8, 35.4)] were identified. After
adjustment for clinical factors and presence of obstructive CAD, higher aSIS was associated with increased death on
mul-tivariable analysis, with hazard ratio (HR) 2.40 (1.83–3.16, p < 0.001), C-statistic 0.723 (0.700–0.756), net reclassification
improvement (NRI) 0.36 (0.26–0.47, p < 0.001), and relative integrated discrimination improvement (IDI) 0.33 (p = 0.009).
aSIS had HR 3.48 (2.33–5.18, p < 0.001) for mortality in those without obstructive CAD, compared to HR 1.79 (1.25–2.58,
p = 0.02) in those with obstructive CAD. In conclusion, aSIS has an incremental prognostic value to traditional risk factors
and obstructive CAD, and may enhance CCTA risk stratification.
Keywords
Coronary · Computed tomography · Atherosclerosis · Prognosis
Introduction
Coronary computed tomography angiography (CCTA) is
recommended in symptomatic individuals for the detection
and exclusion of coronary artery disease (CAD) [
1
], and
has a prognostic value [
2
–
4
]. Increasing extent of coronary
atherosclerosis, as quantified by segment involvement score
(SIS) or the synonymous total plaque score (TPS), has been
shown to be a predictor of clinical events [
5
–
7
]. Rate of
development of atherosclerotic disease has been shown to
be a better predictor of adverse clinical outcomes [
8
–
10
].
Hence we devised a score ‘age adjusted SIS’ (aSIS), which
standardizes SIS to the number of evaluable segments and
normalizes it to patient age. We hypothesize that aSIS is a
surrogate marker of ‘vascular age’, as it gives greater
weight-ing to segments involved in those who are younger, and so
may account for premature atherosclerotic disease.
Previous work demonstrated that aSIS (or as previously
termed %TPS/age) had an incremental prognostic value
over risk factors and obstructive CAD for MACE [
11
]. We
sought to externally validate the prognostic value of aSIS in
the large prospective multinational CONFIRM (COronary
* Benjamin J. W. Chow [email protected]
Computed Tomography Angiography Evaluation for
Clini-cal Outcomes: An InteRnational Multicentre Registry)
cohort.
Materials and methods
Study population
Consecutive patients undergoing CCTA were prospectively
enrolled into the CONFIRM (COroNary CT
Angiogra-phy Evaluation For Clinical Outcomes: An InteRnational
Multicenter Registry). The design of the registry has been
described in depth previously [
12
]. Inclusion criteria were
adults (≥ 18 years) referred for clinically suspected CAD
who underwent ≥ 64-detector row CCTA examination
between February 2003 and September 2010 in twelve
cent-ers in six countries (Canada, Germany, Italy, Korea,
Swit-zerland, and the United States). This study complies with
the Declaration of Helsinki, and all centers had institutional
review board approval for patient enrollment and follow-up.
Only patients who provided informed consent were included.
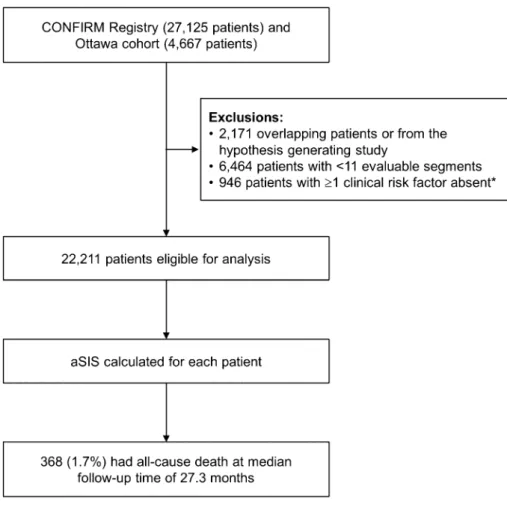
Patients with a history of heart transplantation and
congenital heart disease were excluded. To ensure there
was no duplication of patients, we removed patients who
had been analyzed in our previous study [
11
]. In
addi-tion, patients with < 11 segments reported (n = 6464) and
patients who had missing information about clinical risk
factors were removed from analysis. After excluding 7410
patients, a total of 22,211 patients were available for
analy-sis (Fig.
1
).
Clinical data
Patient demographic data, medical history, risk factors,
physical data, and indications for CCTA were collected
before each CCTA examination in site-specific case report
forms. Standardized definitions for cardiovascular risk
factors were used [
12
]. National Cholesterol Education
Program (NCEP) risk was calculated using age, gender,
symptoms, and risk factors (smoking, hypertension,
dys-lipidemia, diabetes, and family history of premature CAD)
[
13
–
15
].
CCTA image acquisition and analysis
CCTAs were performed with ≥ 64-detector row scanner, and
included both single-source and dual-source scanners. Image
acquisition, post-processing, and interpretation for CCTAs
in the CONFIRM cohort were in compliance with each site’s
institutional policy or SCCT guidelines [
12
,
16
]. CAC scores
were calculated by the method of Agatston [
17
]. Standard
post-processing techniques were used to determine the
pres-ence and extent of CAD, with obstructive CAD defined as a
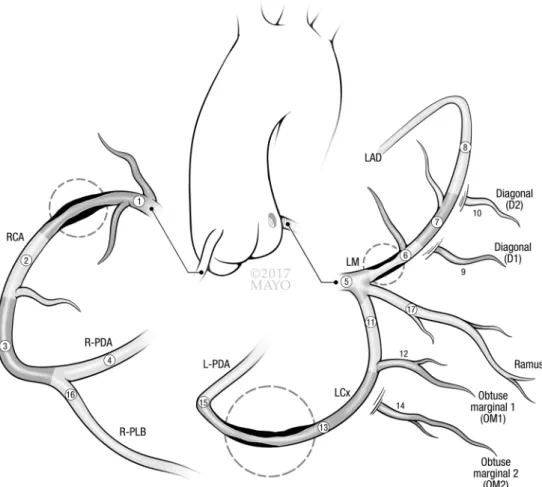
luminal diameter stenosis ≥ 50%. Coronary artery anatomy
and the extent of atherosclerotic plaque were assessed using
a 17-segment model of the coronary arteries (Fig.
2
) [
16
].
Calculation of aSIS
SIS was calculated as the total number of coronary
seg-ments with atherosclerotic plaque (irrespective of
sever-ity). aSIS was calculated as the quotient between SIS and
the total number of segments that was evaluable for plaque,
multiplied by 100, and adjusted by dividing by patient age
(aSIS = ([SIS/total number of evaluable segments] × 100)/
age) (Fig.
2
). To obtain clinically applicable
categoriza-tion, the cohort was divided into four categories of aSIS.
All aSIS = 0 (no atherosclerosis) were assigned into the first
category, and the remaining were divided into 3 categories
based on cutoffs derived from our previous single-center
study [
11
].
Patient follow‑up and outcome measure
All patients were followed for all-cause death, the
pre-spec-ified outcome for the CONFIRM registry, by local
institu-tions through a dedicated physician or research nurse or both
[
12
]. Death was ascertained by query of the National Death
Index in US sites, and in non-US sites by direct interview
or telephone contact with the patient’s immediate family or
primary physician or review of medical records [
12
]. As the
National Death Index data do not include the cause of death,
no data for cardiac death were available for analysis.
Statistical analysis
Absolute counts and percentages were presented for
cat-egorical variables, and continuous variables were
pre-sented as mean ± standard deviation (SD) for normally
distributed data and medians [interquartile range (IQR)]
for skewed data. The Wilcoxon rank sum test was used for
continuous variables and Chi-square test for categorical
variables. Univariable and multivariable analyses were
Fig. 2 Coronary artery tree,
17 segment model. In a case of a 45-year-old who has plaque in 3 of 17 segments (circled), SIS would be 3 and aSIS 0.39. Whilst current data would suggest SIS < 5 portends lower risk than SIS ≥ 5 [2, 5], applying aSIS re-stratifies this younger patient into the highest risk category, suggesting more extensive CAD for age
performed to assess the prognostic value of aSIS for
all-cause death. Any risk factor or CT parameter that had
sta-tistically significant (p < 0.05) association for mortality on
univariable analysis was included in the subsequent
multi-variable modeling. Cox proportional hazard models were
performed for risk-adjusted analyses to evaluate the
inde-pendent prognostic value of aSIS and construct adjusted
survival curves. Statistically significant increases in the
global Chi-square value and comparisons with global
model fit using likelihood ratio tests were used to assess
the incremental prognostic value of models with and
with-out aSIS.
C-index of Harrell was assessed to determine the ability
of models with aSIS to predict mortality [
18
].
Improve-ment in the prediction performance for mortality of a
model that adds aSIS to clinical risk factors and presence
of obstructive CAD was evaluated with the net
reclassifi-cation improvement (NRI) index [
19
]. Category-free NRI
which defines upward and downward movement as any
change in the predicted probabilities was reported as a
measure of discrimination with 95% confidence intervals,
as it is not influenced by correct scaling of the model and
is more generalizable [
20
]. The integrated
discrimina-tion improvement (IDI) and relative IDI were calculated
to quantify the added predictive ability of models that
included obstructive CAD and aSIS sequentially to clinical
predictors. SAS Version 9.3 software (SAS Institute Inc.,
Cary, NC) was used to perform statistical calculations,
with statistical significance defined as p < 0.05.
Results
Patient characteristics
A total of 22,211 patients (mean age 58.5 ± 12.7 years,
55.8% male) were identified with median follow-up time of
27.3 months (IQR 17.8, 35.4) (Table
1
). The follow-up rate
for mortality was 96.5% in the CONFIRM cohort. Patients
included in the analysis had a median aSIS of 0.16 (IQR
0.00, 0.47), and median SIS of 1.0 (IQR 0.0, 4.0). There
was no visible coronary atherosclerosis (SIS and aSIS = 0)
in 8763 (39.5%) patients.
Based on the previous work, patients were stratified into
4 categories (aSIS = 0, 0.001–0.314, 0.314–0.699, ≥ 0.700)
[
11
]. Patients falling into, respectively, higher aSIS
cat-egory had increasing rates of cardiovascular risk factors
(diabetes, hypertension, hypercholesterolemia,
smok-ing, and family history) and were more likely to be male
(Table
1
). Additionally, those in the highest aSIS
cate-gory (≥ 0.700) were more likely to have obstructive CAD
(72%).
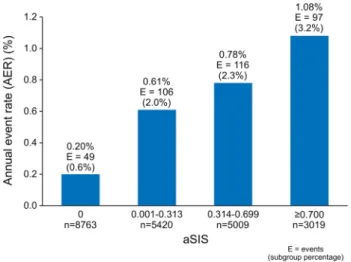
Clinical outcome
A total of 368 patients had the clinical outcome of death
(Figs.
3
,
4
). Forty-nine (0.6%) events were observed in the
aSIS = 0 category (AER = 0.20%). 106 events (2.0%) were
observed in the aSIS < 0.314 category (AER = 0.61%), 116
(2.3%) in the aSIS 0.314–0.699 category (AER = 0.78%),
and 97 (3.2%) in the aSIS ≥ 0.700 category (AER = 1.08%)
(Fig.
4
).
Univariable analysis
Comparing patients with and without the clinical outcome,
those who died were more likely to have hypertension [HR
1.93 (1.56–2.40), p < 0.001], diabetes [HR 1.74 (1.38–2.19),
p < 0.001], and smoking history [HR 1.88 (1.52–2.32),
p < 0.001] (Table
2
). History of dyslipidemia and chest
pain appeared to have lower mortality. In patients with
dyslipidemia, this observation might be attributed to statin
therapy. The protective nature of chest pain may be due to
higher prevalence of non-cardiac chest pain, and treatment
of symptomatic CAD with either optimal medical therapy
or revascularization.
Number of segments with obstructive CAD (≥ 50%
ste-nosis) was associated with HR 1.28 (1.23–1.33) for all-cause
mortality, which was similar to, but slightly more predictive
than that of SIS, with HR 1.22 (1.18–1.25), both p < 0.001.
aSIS was most predictive of mortality with HR 3.68
(2.97–4.56), p < 0.001, followed by presence of
obstruc-tive CAD, with HR 3.11 (2.54–3.82), p < 0.001 (Table
2
).
In subjects ≤ 50 years of age (n = 5702, 36 deaths) aSIS
had HR 4.62 (2.62–8.15), whereas in those > 50 years old
(n = 16,509, 332 deaths) HR was 3.22 (2.53–4.11), both
p < 0.001.
Multivariable analysis
Cox proportional hazard modeling was performed to assess
the prognostic value of aSIS over clinical predictors and
obstructive CAD (Table
3
). aSIS had HR 2.40 (1.83–3.16)
for all-cause death, p < 0.001, and Harrell C-statistic 0.723
(0.700–0.756) when applied in addition to clinical risk
factors and obstructive CAD (≥ 50%). Use of aSIS
cat-egory to predict all-cause death was associated with HR
of 1.52 (1.36–1.71), p < 0.001 and Harrell C-statistic 0.735
(0.707–0.762).
Reclassification statistics
Category-free NRI was used to examine the ability of
aSIS to appropriately reclassify patient risk for death.
aSIS as a continuous variable had a category-free NRI of
0.36 (0.26–0.47), p < 0.001, for all-cause death when used
in addition to clinical predictors and obstructive CAD
(Table
3
). IDI and relative IDI are also reported in Table
3
,
and taken together, addition of obstructive CAD has a
sig-nificant incremental reclassification effect over the model
of clinical risk factors only, and the addition of aSIS has a
further significant incremental reclassification effect over the
model of clinical risk factors and obstructive CAD.
Higher aSIS category was also incremental over
clini-cal predictors and obstructive CAD with NRI of 0.34
(0.24–0.44), p < 0.001. In 2 separate models used to compare
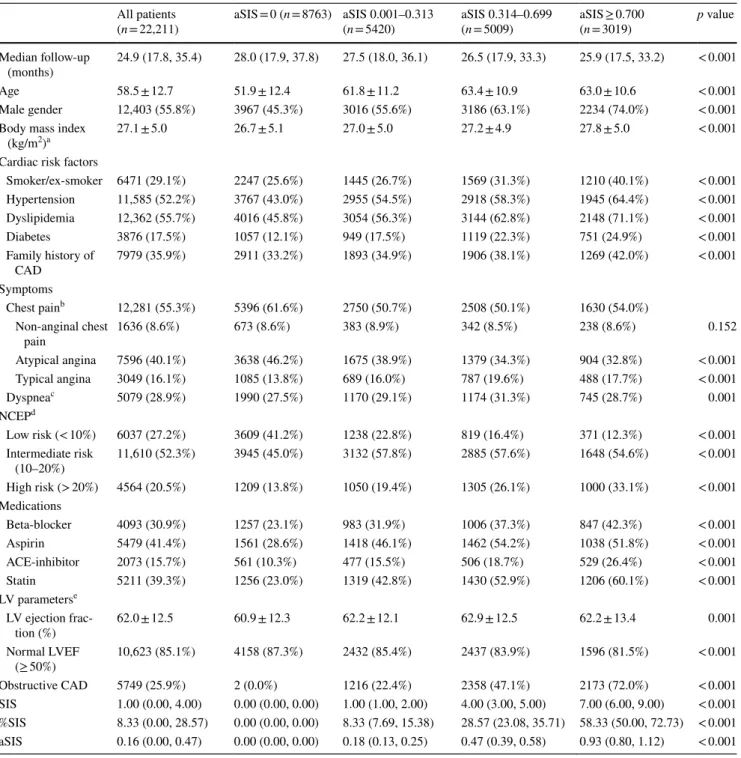
Table 1 Patient characteristics
a n = 17,730 b n = 18,754 c n = 17,601
d 10-year absolute risk of cardiovascular event e n = 12,476
All patients
(n = 22,211) aSIS = 0 (n = 8763) aSIS 0.001–0.313 (n = 5420) aSIS 0.314–0.699 (n = 5009) aSIS ≥ 0.700 (n = 3019) p value Median follow-up
(months) 24.9 (17.8, 35.4) 28.0 (17.9, 37.8) 27.5 (18.0, 36.1) 26.5 (17.9, 33.3) 25.9 (17.5, 33.2) < 0.001
Age 58.5 ± 12.7 51.9 ± 12.4 61.8 ± 11.2 63.4 ± 10.9 63.0 ± 10.6 < 0.001
Male gender 12,403 (55.8%) 3967 (45.3%) 3016 (55.6%) 3186 (63.1%) 2234 (74.0%) < 0.001 Body mass index
(kg/m2)a 27.1 ± 5.0 26.7 ± 5.1 27.0 ± 5.0 27.2 ± 4.9 27.8 ± 5.0 < 0.001
Cardiac risk factors
Smoker/ex-smoker 6471 (29.1%) 2247 (25.6%) 1445 (26.7%) 1569 (31.3%) 1210 (40.1%) < 0.001 Hypertension 11,585 (52.2%) 3767 (43.0%) 2955 (54.5%) 2918 (58.3%) 1945 (64.4%) < 0.001 Dyslipidemia 12,362 (55.7%) 4016 (45.8%) 3054 (56.3%) 3144 (62.8%) 2148 (71.1%) < 0.001 Diabetes 3876 (17.5%) 1057 (12.1%) 949 (17.5%) 1119 (22.3%) 751 (24.9%) < 0.001 Family history of CAD 7979 (35.9%) 2911 (33.2%) 1893 (34.9%) 1906 (38.1%) 1269 (42.0%) < 0.001 Symptoms Chest painb 12,281 (55.3%) 5396 (61.6%) 2750 (50.7%) 2508 (50.1%) 1630 (54.0%) Non-anginal chest pain 1636 (8.6%) 673 (8.6%) 383 (8.9%) 342 (8.5%) 238 (8.6%) 0.152 Atypical angina 7596 (40.1%) 3638 (46.2%) 1675 (38.9%) 1379 (34.3%) 904 (32.8%) < 0.001 Typical angina 3049 (16.1%) 1085 (13.8%) 689 (16.0%) 787 (19.6%) 488 (17.7%) < 0.001 Dyspneac 5079 (28.9%) 1990 (27.5%) 1170 (29.1%) 1174 (31.3%) 745 (28.7%) 0.001 NCEPd Low risk (< 10%) 6037 (27.2%) 3609 (41.2%) 1238 (22.8%) 819 (16.4%) 371 (12.3%) < 0.001 Intermediate risk (10–20%) 11,610 (52.3%) 3945 (45.0%) 3132 (57.8%) 2885 (57.6%) 1648 (54.6%) < 0.001 High risk (> 20%) 4564 (20.5%) 1209 (13.8%) 1050 (19.4%) 1305 (26.1%) 1000 (33.1%) < 0.001 Medications Beta-blocker 4093 (30.9%) 1257 (23.1%) 983 (31.9%) 1006 (37.3%) 847 (42.3%) < 0.001 Aspirin 5479 (41.4%) 1561 (28.6%) 1418 (46.1%) 1462 (54.2%) 1038 (51.8%) < 0.001 ACE-inhibitor 2073 (15.7%) 561 (10.3%) 477 (15.5%) 506 (18.7%) 529 (26.4%) < 0.001 Statin 5211 (39.3%) 1256 (23.0%) 1319 (42.8%) 1430 (52.9%) 1206 (60.1%) < 0.001 LV parameterse LV ejection frac-tion (%) 62.0 ± 12.5 60.9 ± 12.3 62.2 ± 12.1 62.9 ± 12.5 62.2 ± 13.4 0.001 Normal LVEF (≥ 50%) 10,623 (85.1%) 4158 (87.3%) 2432 (85.4%) 2437 (83.9%) 1596 (81.5%) < 0.001 Obstructive CAD 5749 (25.9%) 2 (0.0%) 1216 (22.4%) 2358 (47.1%) 2173 (72.0%) < 0.001 SIS 1.00 (0.00, 4.00) 0.00 (0.00, 0.00) 1.00 (1.00, 2.00) 4.00 (3.00, 5.00) 7.00 (6.00, 9.00) < 0.001 %SIS 8.33 (0.00, 28.57) 0.00 (0.00, 0.00) 8.33 (7.69, 15.38) 28.57 (23.08, 35.71) 58.33 (50.00, 72.73) < 0.001 aSIS 0.16 (0.00, 0.47) 0.00 (0.00, 0.00) 0.18 (0.13, 0.25) 0.47 (0.39, 0.58) 0.93 (0.80, 1.12) < 0.001
risk reclassification in addition to traditional clinical risk
factors, aSIS demonstrated similar ability to reclassify
patient risk as the presence of obstructive CAD, with NRI of
0.46 (0.36–0.56) for the model ‘clinical risk + aSIS’ versus
0.48 (0.37–0.58) for the model ‘clinical risk + obstructive
CAD’, p < 0.001.
Sub‑analysis in patients with obstructive
and non‑obstructive CAD
aSIS was associated with highest risk for mortality, with
highest hazard ratios for both patients with non-obstructive
CAD and obstructive CAD (Tables
4
,
5
,
6
). Importantly, in
the population with non-obstructive CAD, aSIS had
signifi-cantly higher HR for mortality than SIS or age alone.
Discussion
Using the CONFIRM registry, the independent and
incre-mental prognostic value of aSIS was validated over routine
clinical measures and CCTA measure of obstructive CAD.
Higher aSIS categories were associated with increased risk
of all-cause mortality (HR 2.40 (1.83–3.16), p < 0.001, and
NRI of 0.36 (0.26–0.47), p < 0.01).
Previous work demonstrated that aSIS (also termed
%TPS/age) score has an incremental prognostic value for
MACE over traditional risk factors and conventional CCTA
assessment of coronary atherosclerosis [
11
]. We
hypothe-sized that this novel measure, which can be quickly and
eas-ily derived from routine clinical CCTA, may be a surrogate
marker of coronary vascular age. Although the prevalence
of traditional risk factors and obstructive CAD increased
with aSIS category, two-thirds of patients in the highest
aSIS category had low or intermediate NCEP risk (Table
1
);
hence confirming the potential limitations of routine clinical
risk predictors and the potential utility of aSIS to reclassify
patient risk.
CCTA, extent of CAD, and prognosis
Framingham risk factors have only moderate correlation
with atherosclerosis burden; a significant proportion of
patients with low and intermediate Framingham risk have
coronary atherosclerosis demonstrated by CCTA [
21
].
Ana-tomic evaluation of coronary arteries by CCTA allows early
identification of coronary artery disease that may be
subclin-ical and undetectable by functional testing, but is often the
substrate of MACE [
22
,
23
]. The presence of
non-obstruc-tive CAD on CCTA is associated with higher mortality even
adjusting for CAD risk factors, with highest risk seen in
those with greater extent of non-obstructive CAD [
2
,
4
,
5
].
SIS is a simple and reproducible semiquantitative measure
quantifying the extent of CAD burden on CCTA
(irrespec-tive of degree of stenosis). Extent of CAD is a strong
predic-tor of events [
24
], and SIS ≥ 5 on CCTA has been shown to
have worse prognosis that is comparable to the presence of
obstructive CAD [
2
,
5
].
Coronary vascular age and atherosclerosis
that is extensive for age
SIS and extent of CAD increase with age [
25
,
26
].
Ath-erosclerosis begins in the early decades of life [
27
], and
may remain clinically silent for decades until plaque
ero-sion and rupture result in clinical events or leero-sions become
obstructive resulting in ischemia. However, individuals with
more rapid development of coronary atherosclerosis have
Fig. 3 Annual event rates for mortality by aSIS category for the entire cohort (n = 22,211). Mortality comparison between aSIS categories had p < 0.001 for all comparisons, except between 0.001–0.313 cat-egory and 0.314–0.699 catcat-egory (p = 0.05)
Fig. 4 Risk-adjusted survival curves by aSIS category, p < 0.001. aSIS = 0 category, whilst included in the continuous variable analysis, was not included in this figure as it was used as a reference for out-comes for the other aSIS categories
an increased rate of adverse outcomes [
8
–
10
,
28
]. Absolute
plaque measurements may estimate 10-year risk which is
independent of age; however, adjusting plaque burden to
age gives a greater weighting for each involved segment if
younger and may be a potential estimate of lifetime risk.
For example, a 30-year-old and 60-year-old who have the
same plaque burden and CAC theoretically may have the
same 5–10 year risk; however, the 30-year-old would have
atherosclerotic disease that has developed more rapidly and
is more extensive for their age, and aSIS may act as a marker
of vascular age and provide enhanced prediction of lifetime
risk.
Clinical implications
The simplicity of SIS gives the potential for it to be
calcu-lated by automated software algorithms. Itss adjustment to
age as aSIS may offer a method of enhanced risk
stratifica-tion and prognosticastratifica-tion by CCTA. With advancements in
CT technology and novel scanning algorithms promising
ongoing reduction in radiation dose and increasing use of
CCTA, aSIS uses information readily available and easily
calculable from clinical scans that may identify patients with
‘greater vascular age’ or atherosclerosis that is more
exten-sive for age, and at greater risk of mortality. Additionally,
aSIS may be a sensitive marker of subclinical
(non-obstruc-tive) disease, removing a false sense of security for some
at-risk patients, and so improve adherence to preventative
measures.
CT evaluation of coronary atherosclerosis impacts
downstream testing and management, influences physician
behavior, and results in better risk factor modification and
increased medical therapy [
29
–
31
]. The use of statins has
been associated with reduced risk for mortality in patients
with non-obstructive disease on CCTA [
32
,
33
]. Bittencourt
et al. have shown that extent of plaque detected by CCTA
enhances risk assessment, and even patients with
non-obstructive disease and SIS > 4 had significant increase in
events; it is thus possible that statins may reduce mortality
in patients with higher aSIS [
5
].
Whilst there is a lack of prospective data, aSIS could
be a useful tool for triaging medical therapy. Further
prospective studies are needed to understand the clinical
role of aSIS, and potential economic benefits. However,
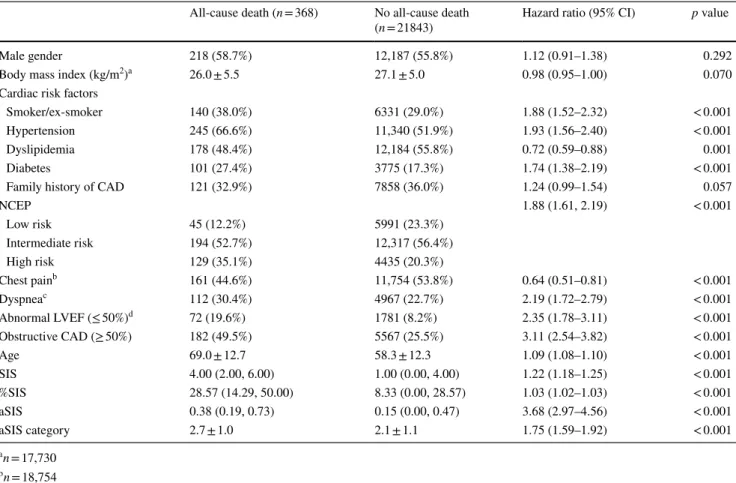
Table 2 Univariable analysis for mortality
a n = 17,730 b n = 18,754 c n = 17,601 d n = 12,476
All-cause death (n = 368) No all-cause death
(n = 21843) Hazard ratio (95% CI) p value
Male gender 218 (58.7%) 12,187 (55.8%) 1.12 (0.91–1.38) 0.292
Body mass index (kg/m2)a 26.0 ± 5.5 27.1 ± 5.0 0.98 (0.95–1.00) 0.070
Cardiac risk factors
Smoker/ex-smoker 140 (38.0%) 6331 (29.0%) 1.88 (1.52–2.32) < 0.001
Hypertension 245 (66.6%) 11,340 (51.9%) 1.93 (1.56–2.40) < 0.001
Dyslipidemia 178 (48.4%) 12,184 (55.8%) 0.72 (0.59–0.88) 0.001
Diabetes 101 (27.4%) 3775 (17.3%) 1.74 (1.38–2.19) < 0.001
Family history of CAD 121 (32.9%) 7858 (36.0%) 1.24 (0.99–1.54) 0.057
NCEP 1.88 (1.61, 2.19) < 0.001 Low risk 45 (12.2%) 5991 (23.3%) Intermediate risk 194 (52.7%) 12,317 (56.4%) High risk 129 (35.1%) 4435 (20.3%) Chest painb 161 (44.6%) 11,754 (53.8%) 0.64 (0.51–0.81) < 0.001 Dyspneac 112 (30.4%) 4967 (22.7%) 2.19 (1.72–2.79) < 0.001 Abnormal LVEF (≤ 50%)d 72 (19.6%) 1781 (8.2%) 2.35 (1.78–3.11) < 0.001 Obstructive CAD (≥ 50%) 182 (49.5%) 5567 (25.5%) 3.11 (2.54–3.82) < 0.001 Age 69.0 ± 12.7 58.3 ± 12.3 1.09 (1.08–1.10) < 0.001 SIS 4.00 (2.00, 6.00) 1.00 (0.00, 4.00) 1.22 (1.18–1.25) < 0.001 %SIS 28.57 (14.29, 50.00) 8.33 (0.00, 28.57) 1.03 (1.02–1.03) < 0.001 aSIS 0.38 (0.19, 0.73) 0.15 (0.00, 0.47) 3.68 (2.97–4.56) < 0.001 aSIS category 2.7 ± 1.0 2.1 ± 1.1 1.75 (1.59–1.92) < 0.001
Table 3 Co x models f or mor tality Onl y v ar iables wit h a univ ar iate p < 0.05 w er e included in t he Co x r eg ression model a Continuous var iable Hazar d r atios (95% CI) p v alue
Global Chi- squar
e Har rell C-s tatis tic (95% CI) NRI NRI p v alue Absolute IDI Relativ e IDI IDI p v alue Clinical 98.71 0.679 (0.645–0.712) – – – – – Smok er/e x-smok er 1.86 (1.51–2.30) < 0.001 Hyper tension 1.92 (1.54–2.39) < 0.001 Dy slipidemia 0.64 (0.52–0.78) < 0.001 Diabe tes 1.56 (1.24–1.97) < 0.001 Clinical + obs tr uctiv e CA D 184.63 0.710 (0.679–0.741) 0.478 (0.375–0.581) < 0.001 0.005 (0.004–0.007) 1.88 < 0.001 Smok er/e x-smok er 1.65 (1.34–2.05) < 0.001 Hyper tension 1.77 (1.42–2.21) < 0.001 Dy slipidemia 0.60 (0.49–0.74) < 0.001 Diabe tes 1.34 (1.06–1.69) 0.016 Obs tructiv e C AD (≥ 50%) 2.76 (2.24–3.40) < 0.001 Clinical + obs tr uctiv e CAD + aSIS a 220.24 0.723 (0.700–0.756) 0.362 (0.259–0.465) < 0.001 0.003 (0.001–0.005) 0.33 0.009 Smok er/e x-smok er 1.56 (1.26–1.93) < 0.001 Hyper tension 1.72 (1.37–2.14) < 0.001 Dy slipidemia 0.55 (0.45–0.68) < 0.001 Diabe tes 1.34 (1.06–1.69) 0.015 Obs tructiv e C AD (≥ 50%) 1.85 (1.45–2.38) < 0.001 aSIS a 2.40 (1.83–3.16) < 0.001
findings from this study placed in the context of available
CT data would suggest that higher aSIS warrants closer
clinical surveillance and follow-up, and more aggressive
institution of preventative measures including lifestyle
modifications, more aggressive risk factor control, and
consideration of statin therapy [
5
,
11
,
29
,
30
,
33
].
Limitations
Ideally direct measures of plaque progression would
pro-vide us with information regarding true rates of change
and how they may be attenuated with medical therapy. In
the absence of such tests, aSIS may be a reasonable marker
Table 4 Univariable analysis for mortality in patients with non-obstructive CAD and obstructive CAD
a n = 4453 b n = 4584 c n = 4405
Non-obstructive CAD
Hazard ratio (95% CI) p value Obstructive CADHazard ratio (95% CI) p value Male gender 0.99 (0.73–1.34) 0.932 0.96 (0.72–1.27) 0.754 Body mass index (kg/m2)a 0.92 (0.88–0.96) < 0.001 1.01 (0.97–1.04) 0.738
Cardiac risk factors
Smoker/ex-smoker 1.52 (1.13–2.04) 0.005 1.78 (1.31–2.42) < 0.001 Hypertension 1.33 (0.98–1.81) 0.070 2.18 (1.61–2.95) < 0.001 Dyslipidemia 0.66 (0.49–0.88) 0.005 0.67 (0.50–0.89) 0.006 Diabetes 1.12 (0.82–1.54) 0.474 1.93 (1.39–2.69) < 0.001 Family history of CAD 0.84 (0.61–1.15) 0.281 1.51 (1.11–2.04) 0.009
NCEP 1.41 (1.13–1.76) 0.003 1.96 (1.61–2.40) < 0.001 Low risk Intermediate risk High risk Chest painb 0.80 (0.57–1.11) 0.184 0.54 (0.39–0.76) < 0.001 Dyspneac 1.68 (1.20–2.36) 0.003 2.36 (1.68–3.31) < 0.001 SIS 1.13 (1.08–1.18) < 0.001 1.22 (1.16–1.28) < 0.001 Age 1.07 (1.06–1.09) < 0.001 1.08 (1.07–1.09) < 0.001 %SIS 1.02 (1.01–1.02) < 0.001 1.03 (1.02–1.03) < 0.001 aSIS 1.72 (1.20–2.45) 0.003 3.84 (2.59–5.70) < 0.001 aSIS category 1.37 (1.13–1.67) 0.002 1.59 (1.39–1.83) < 0.001
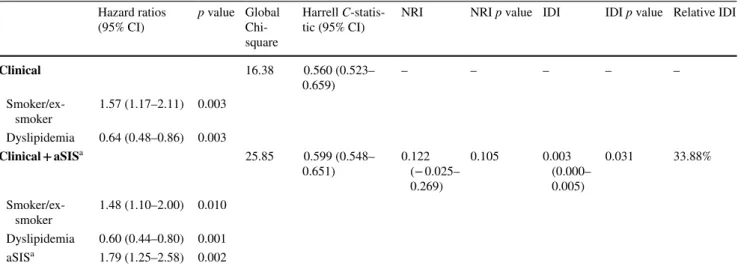
Table 5 Cox models for mortality in patients with obstructive CAD
Only variables with a univariate p < 0.05 including all patients were included in the Cox regression model
a Continuous variable
Hazard ratios
(95% CI) p value Global Chi-square
Harrell
C-statis-tic (95% CI) NRI NRI p value IDI IDI p value Relative IDI
Clinical 16.38 0.560 (0.523– 0.659) – – – – – Smoker/ex-smoker 1.57 (1.17–2.11) 0.003 Dyslipidemia 0.64 (0.48–0.86) 0.003 Clinical + aSISa 25.85 0.599 (0.548– 0.651) 0.122 (− 0.025– 0.269) 0.105 0.003 (0.000– 0.005) 0.031 33.88% Smoker/ex-smoker 1.48 (1.10–2.00) 0.010 Dyslipidemia 0.60 (0.44–0.80) 0.001 aSISa 1.79 (1.25–2.58) 0.002
of premature atherosclerosis that is extensive for age. Age
was removed from the multivariable analysis to avoid
col-linearity with aSIS, as age is part of the score; however, in
the univariable analysis, aSIS score was a superior
predic-tor of mortality than age, SIS or %SIS alone with much
higher hazard ratios. Further studies are needed to better
understand how such measures can be used to guide
medi-cal therapy. Although aSIS was prognostic for MACE in
our previous study, not all CONFIRM centers were able
to collect MACE. Therefore, all-cause mortality was the
pre-specified primary end point for the CONFIRM registry
[
12
]. Breakup of cause of death was not available from the
query of the National Death Index for US sites.
Conclusion
aSIS may be a surrogate marker for vascular age and has
independent and incremental prognostic value for all-cause
mortality over traditional risk factors, obstructive CAD on
CCTA. Further studies are needed to understand how it can
be incorporated into clinical practice and how it might direct
preventative measures.
Acknowledgements The assistance of the Mayo Clinic Medical illus-trations Unit with the figures is acknowledged with much thanks.
Benjamin Chow receives research support from CV Diagnostix, and research and educational support from TeraRecon Inc. and holds the Saul & Edna Goldfarb Research Chair in Cardiac Imaging. There is no funding associated with this work.
Compliance with ethical standards
Conflict of interest There is no funding associated with this work. Dr. Min received the modest speakers’ bureau and medical advisory board compensation and significant research support from GE Health-care. Dr. Achenbach received grant support from Siemens and Bayer Schering Pharma and has served as a consultant for Servier. Dr. Al-Mallah received support from the American Heart Association, BCBS Foundation of Michigan, and Astellas. Dr. Cademartiri received grant support from GE Healthcare and has served on the Speakers’ Bureau of Bracco and as a consultant for Servier; Dr. Maffei received grant support from GE Healthcare. Dr. Chinnaiyan received grant support from Bayer Pharma and Blue Cross Blue Shield Blue Care MI. Dr. Chow received research and fellowship support from GE Healthcare, research support from Pfizer and AstraZeneca, and educational sup-port from TeraRecon. Dr. Hausleiter received a research grant from Siemens Medical Systems. Dr. Kaufmann received institutional re-search support from GE Healthcare and grant support from Swiss Na-tional Science Foundation. Dr. Maffei received grant support from GE Healthcare Dr. Raff received grant support from Siemens, Blue Cross Blue Shield Blue Care MI, and Bayer Pharma. Dr. Leipsic has received research support and serves on the speaker’s bureau for GE Healthcare. All other authors have reported that they have no relationships relevant to the contents of this paper to disclose.
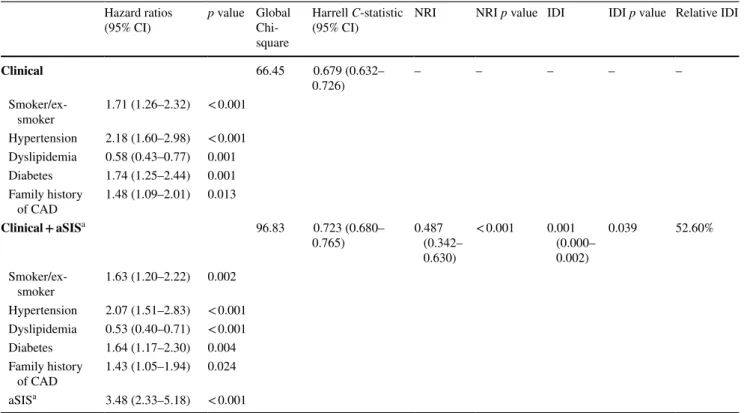
Table 6 Cox models for mortality in patients with non-obstructive CAD
Only variables with a univariate p < 0.05 including all patients were included in the Cox regression model
a Continuous variable
Hazard ratios
(95% CI) p value Global Chi-square
Harrell C-statistic
(95% CI) NRI NRI p value IDI IDI p value Relative IDI
Clinical 66.45 0.679 (0.632– 0.726) – – – – – Smoker/ex-smoker 1.71 (1.26–2.32) < 0.001 Hypertension 2.18 (1.60–2.98) < 0.001 Dyslipidemia 0.58 (0.43–0.77) 0.001 Diabetes 1.74 (1.25–2.44) 0.001 Family history of CAD 1.48 (1.09–2.01) 0.013 Clinical + aSISa 96.83 0.723 (0.680– 0.765) 0.487 (0.342– 0.630) < 0.001 0.001 (0.000– 0.002) 0.039 52.60% Smoker/ex-smoker 1.63 (1.20–2.22) 0.002 Hypertension 2.07 (1.51–2.83) < 0.001 Dyslipidemia 0.53 (0.40–0.71) < 0.001 Diabetes 1.64 (1.17–2.30) 0.004 Family history of CAD 1.43 (1.05–1.94) 0.024 aSISa 3.48 (2.33–5.18) < 0.001
Ethical standards All procedures performed in studies involving human participants were in accordance with the ethical standards of the institutional and/or national research committee and with the 1964 Helsinki Declaration and its later amendments or comparable ethical standards.
Informed consent Informed consent was obtained from individual participants included in the study or was waived by the institutional research board.
References
1. Taylor AJ, Cerqueira M, Hodgson JM, Mark D, Min J, O’Gara P, Rubin GD, American College of Cardiology Foundation Appro-priate Use Criteria Task F, Society of Cardiovascular Com-puted T, American College of R, American Heart A, American Society of E, American Society of Nuclear C, North American Society for Cardiovascular I, Society for Cardiovascular A, Interventions, Society for Cardiovascular Magnetic R (2010) ACCF/SCCT/ACR/AHA/ASE/ASNC/NASCI/SCAI/SCMR 2010 appropriate use criteria for cardiac computed tomography. A report of the American College of Cardiology Foundation Appropriate Use Criteria Task Force, the Society of Cardiovas-cular Computed Tomography, the American College of Radiol-ogy, the American Heart Association, the American Society of Echocardiography, the American Society of Nuclear Cardiol-ogy, the North American Society for Cardiovascular Imaging, the Society for Cardiovascular Angiography and Interventions, and the Society for Cardiovascular Magnetic Resonance. J Car-diovasc Comput Tomogr 4(6):407 e1–407 e33
2. Chow BJ, Wells GA, Chen L, Yam Y, Galiwango P, Abraham A, Sheth T, Dennie C, Beanlands RS, Ruddy TD (2010) Prognos-tic value of 64-slice cardiac computed tomography severity of coronary artery disease, coronary atherosclerosis, and left ven-tricular ejection fraction. J Am Coll Cardiol 55(10):1017–1028 3. Min JK, Shaw LJ, Devereux RB, Okin PM, Weinsaft JW, Russo
DJ, Lippolis NJ, Berman DS, Callister TQ (2007) Prognostic value of multidetector coronary computed tomographic angiog-raphy for prediction of all-cause mortality. J Am Coll Cardiol 50(12):1161–1170
4. Lin FY, Shaw LJ, Dunning AM, Labounty TM, Choi JH, Weinsaft JW, Koduru S, Gomez MJ, Delago AJ, Callister TQ, Berman DS, Min JK (2011) Mortality risk in symptomatic patients with non-obstructive coronary artery disease: a prospective 2-center study of 2,583 patients undergoing 64-detector row coronary computed tomographic angiography. J Am Coll Cardiol 58(5):510–519 5. Bittencourt MS, Hulten E, Ghoshhajra B, O’Leary D, Christman
MP, Montana P, Truong QA, Steigner M, Murthy VL, Rybicki FJ, Nasir K, Gowdak LH, Hainer J, Brady TJ, Di Carli MF, Hoffmann U, Abbara S, Blankstein R (2014) Prognostic value of nonobstructive and obstructive coronary artery disease detected by coronary computed tomography angiography to identify car-diovascular events. Circ Cardiovasc Imaging 7(2):282–291 6. Hadamitzky M, Distler R, Meyer T, Hein F, Kastrati A,
Mar-tinoff S, Schomig A, Hausleiter J (2011) Prognostic value of coronary computed tomographic angiography in comparison with calcium scoring and clinical risk scores. Circ Cardiovasc Imaging 4(1):16–23
7. Ayoub C, Erthal F, Abdelsalam MA, Murad MH, Wang Z, Erwin PJ, Hillis GS, Kritharides L, Chow BJW (2017) Prog-nostic value of segment involvement score compared to other measures of coronary atherosclerosis by computed tomography:
a systematic review and meta-analysis. J Cardiovasc Comput Tomogr 11(4):258–267
8. Raggi P, Callister TQ, Shaw LJ (2004) Progression of coronary artery calcium and risk of first myocardial infarction in patients receiving cholesterol-lowering therapy. Arterioscler Thromb Vasc Biol 24(7):1272–1277
9. Waters D, Craven TE, Lesperance J (1993) Prognostic signifi-cance of progression of coronary atherosclerosis. Circulation 87(4):1067–1075
10. Nicholls SJ, Hsu A, Wolski K, Hu B, Bayturan O, Lavoie A, Uno K, Tuzcu EM, Nissen SE (2010) Intravascular ultrasound-derived measures of coronary atherosclerotic plaque burden and clinical outcome. J Am Coll Cardiol 55(21):2399–2407 11. Ayoub C, Yam Y, Chen L, Arasaratnam P, Chow CK, Hillis
GS, Kritharides L, Chow BJ (2016) The prognostic value of percentage total plaque score adjusted to age: a potential marker of coronary vascular age. Angiology 7(10):916–926
12. Min JK, Dunning A, Lin FY, Achenbach S, Al-Mallah MH, Berman DS, Budoff MJ, Cademartiri F, Callister TQ, Chang HJ, Cheng V, Chinnaiyan KM, Chow B, Delago A, Hadamitzky M, Hausleiter J, Karlsberg RP, Kaufmann P, Maffei E, Nasir K, Pencina MJ, Raff GL, Shaw LJ, Villines TC (2011) Rationale and design of the CONFIRM (COronary CT Angiography Eval-uatioN For Clinical Outcomes: an InteRnational Multicenter) Registry. J Cardiovasc Comput Tomogr 5(2):84–92
13. National Cholesterol Education Program Expert Panel on Detec-tion, Evaluation and Treatment of High Blood Cholesterol in Adults Adult Treatment Panel III (2002) Detection, evaluation, and treatment of high blood cholesterol in adults (adult treat-ment panel III) final report. Circulation 106(25):3143–3421 14. Chaitman BR, Bourassa MG, Davis K, Rogers WJ, Tyras DH,
Berger R, Kennedy JW, Fisher L, Judkins MP, Mock MB, Killip T (1981) Angiographic prevalence of high-risk coronary artery disease in patient subsets (CASS). Circulation 64(2):360–367 15. Gibbons RJ, Chatterjee K, Daley J, Douglas JS, Fihn SD, Gardin
JM, Grunwald MA, Levy D, Lytle BW, O’Rourke RA, Schafer WP, Williams SV, Ritchie JL, Cheitlin MD, Eagle KA, Gardner TJ, Garson A Jr, Russell RO, Ryan TJ, Smith SC Jr (1999) ACC/ AHA/ACP-ASIM guidelines for the management of patients with chronic stable angina: a report of the American College of Cardiology/American Heart Association Task Force on Prac-tice Guidelines (Committee on Management of Patients With Chronic Stable Angina). J Am Coll Cardiol 33(7):2092–2197 16. Leipsic J, Abbara S, Achenbach S, Cury R, Earls JP, Mancini
GJ, Nieman K, Pontone G, Raff GL (2014) SCCT guidelines for the interpretation and reporting of coronary CT angiography: a report of the Society of Cardiovascular Computed Tomog-raphy Guidelines Committee. J Cardiovasc Comput Tomogr 8(5):342–358
17. Agatston AS, Janowitz WR, Hildner FJ, Zusmer NR, Viamonte M Jr, Detrano R (1990) Quantification of coronary artery cal-cium using ultrafast computed tomography. J Am Coll Cardiol 15(4):827–832
18. Pencina MJ, D’Agostino RB (2004) Overall C as a measure of dis-crimination in survival analysis: model specific population value and confidence interval estimation. Stat Med 23(13):2109–2123 19. Pencina MJ, D’Agostino RB Sr, D’Agostino RB Jr, Vasan RS
(2008) Evaluating the added predictive ability of a new marker: from area under the ROC curve to reclassification and beyond. Stat Med 27(2):157–172 (discussion 207–212)
20. Pencina MJ, D’Agostino RB Sr, Steyerberg EW (2011) Exten-sions of net reclassification improvement calculations to measure usefulness of new biomarkers. Stat Med 30(1):11–21
21. Pen A, Yam Y, Chen L, Dennie C, McPherson R, Chow BJ (2013) Discordance between Framingham Risk Score and atherosclerotic plaque burden. Eur Heart J 34(14):1075–1082
22. Stone GW, Maehara A, Lansky AJ, de Bruyne B, Cristea E, Mintz GS, Mehran R, McPherson J, Farhat N, Marso SP, Parise H, Tem-plin B, White R, Zhang Z, Serruys PW, Investigators P (2011) A prospective natural-history study of coronary atherosclerosis. N Engl J Med 364(3):226–235
23. Burke AP, Kolodgie FD, Farb A, Weber DK, Malcom GT, Smi-alek J, Virmani R (2001) Healed plaque ruptures and sudden coro-nary death: evidence that subclinical rupture has a role in plaque progression. Circulation 103(7):934–940
24. Proudfit WL, Bruschke VG, Sones FM Jr (1980) Clinical course of patients with normal or slightly or moderately abnormal coro-nary arteriograms: 10-year follow-up of 521 patients. Circulation 62(4):712–717
25. Choi TY, Li D, Nasir K, Zeb I, Sourayanezhad S, Gupta M, Hacioglu Y, Mao SS, Budoff MJ (2013) Differences in coro-nary atherosclerotic plaque burden and composition according to increasing age on computed tomography angiography. Acad Radiol 20(2):202–208
26. Tota-Maharaj R, Blaha MJ, Rivera JJ, Henry TS, Choi EK, Chang SA, Yoon YE, Chun EJ, Choi SI, Blumenthal RS, Chang HJ, Nasir K (2012) Differences in coronary plaque composition with aging measured by coronary computed tomography angiography. Int J Cardiol 158(2):240–245
27. Enos WF, Holmes RH, Beyer J (1986) Landmark article, July 18, 1953: coronary disease among United States soldiers killed in action in Korea. Preliminary report. By William F. Enos, Robert H. Holmes and James Beyer. JAMA 256(20):2859–2862 28. Kaski JC, Chester MR, Chen L, Katritsis D (1995) Rapid
angio-graphic progression of coronary artery disease in patients with angina pectoris. The role of complex stenosis morphology. Cir-culation 92(8):2058–2065
29. Cheezum MK, Hulten EA, Smith RM, Taylor AJ, Kircher J, Surry L, York M, Villines TC (2013) Changes in preventive medical
therapies and cv risk factors after CT angiography. JACC Cardio-vasc Imaging 6(5):574–581
30. Uretsky S, Rozanski A, Supariwala A, Thotakura G, Kanneganti S, Satyanarayana N, Mantrala P, Yeturi SR, Peters MR, Fisher E, Wolff SD (2013) Clinical outcomes following a strategy of optimized medical management and selective “downstream” pro-cedures following coronary computed tomography angiography. Int J Cardiol 165(3):468–473
31. Rozanski A, Gransar H, Shaw LJ, Kim J, Miranda-Peats L, Wong ND, Rana JS, Orakzai R, Hayes SW, Friedman JD, Thomson LE, Polk D, Min J, Budoff MJ, Berman DS (2011) Impact of coro-nary artery calcium scanning on corocoro-nary risk factors and down-stream testing the EISNER (Early Identification of Subclinical Atherosclerosis by Noninvasive Imaging Research) prospective randomized trial. J Am Coll Cardiol 57(15):1622–1632 32. Chow BJ, Small G, Yam Y, Chen L, McPherson R, Achenbach S,
Al-Mallah M, Berman DS, Budoff MJ, Cademartiri F, Callister TQ, Chang HJ, Cheng VY, Chinnaiyan K, Cury R, Delago A, Dunning A, Feuchtner G, Hadamitzky M, Hausleiter J, Karls-berg RP, Kaufmann PA, Kim YJ, Leipsic J, LaBounty T, Lin F, Maffei E, Raff GL, Shaw LJ, Villines TC, Min JK, Investigators C (2015) Prognostic and therapeutic implications of statin and aspirin therapy in individuals with nonobstructive coronary artery disease: results from the CONFIRM (COronary CT Angiography EvaluatioN For Clinical Outcomes: an InteRnational Multicenter registry) registry. Arterioscler Thromb Vasc Biol 35(4):981–989 33. Hwang IC, Jeon JY, Kim Y, Kim HM, Yoon YE, Lee SP, Kim
HK, Sohn DW, Sung J, Kim YJ (2015) Statin therapy is associated with lower all-cause mortality in patients with non-obstructive coronary artery disease. Atherosclerosis 239(2):335–342
Affiliations
Chadi Ayoub
1,2,3· Leonard Kritharides
3,4· Yeung Yam
1· Li Chen
1· Alomgir Hossain
1· Stephan Achenbach
5·
Mouaz H. Al‑Mallah
6· Daniele Andreini
7· Daniel S. Berman
8· Matthew J. Budoff
9· Filippo Cademartiri
10·
Tracy Q. Callister
11· Hyuk‑Jae Chang
12· Kavitha Chinnaiyan
13· Ricardo C. Cury
14· Augustin Delago
15·
Allison Dunning
16· Gudrun Feuchtner
17· Millie Gomez
18· Heidi Gransar
8· Martin Hadamitzky
19·
Joerg Hausleiter
19· Niree Hindoyan
18· Philipp A. Kaufmann
20· Yong‑Jin Kim
21· Jonathon Leipsic
22· Erica Maffei
10·
Hugo Marques
23· Gianluca Pontone
7· Gilbert Raff
13· Ronen Rubinshtein
24· Leslee J. Shaw
25· Todd C. Villines
26·
James K. Min
18· Benjamin J. W. Chow
1,271 Department of Medicine (Cardiology), University of Ottawa
Heart Institute, 40 Ruskin Street, Ottawa, ON K1Y 4W7, Canada
2 Department of Cardiovascular Medicine, Cleveland Clinic,
Cleveland, OH, USA
3 University of Sydney, Sydney, NSW, Australia
4 Department of Cardiology, Concord Hospital, Sydney Local
Health District, Sydney, NSW, Australia
5 Department of Medicine, University of Erlangen, Erlangen,
Germany
6 King Abdullah International Medical Research Center, King
AbdulAziz Cardiac Center, Riyadh, Saudi Arabia
7 Department of Clinical Sciences and Community Health,
University of Milan, Centro Cardiologico Monzino, IRCCS Milan, Milan, Italy
8 Department of Imaging, Cedars Sinai Medical Center,
Los Angeles, CA, USA
9 Department of Medicine, Harbor UCLA Medical Center,
Los Angeles, CA, USA
10 Cardiovascular Imaging Unit, Giovanni XXIII Hospital,
Monastier, Treviso, Italy
11 Tennessee Heart and Vascular Institute, Hendersonville, TN,
USA
12 Division of Cardiology, Severance Cardiovascular Hospital
and Severance Biomedical Science Institute, Yonsei University College of Medicine, Seoul, South Korea
13 William Beaumont Hospital, Royal Oaks, MI, USA 14 Baptist Cardiac and Vascular Institute, Miami, FL, USA 15 Capitol Cardiology Associates, Albany, NY, USA
16 Duke Clinical Research Institute, Durham, NC, USA 17 Department of Radiology, Medical University of Innsbruck,
Innsbruck, Austria
18 Dalio Institute of Cardiovascular Imaging, Weill Cornell
Medical College and New York-Presbyterian Hospital, New York, NY, USA
19 Division of Cardiology, Deutsches Herzzentrum Munchen,
Munich, Germany
20 University Hospital, Zurich, Switzerland
21 Seoul National University Hospital, Seoul, South Korea 22 Department of Medicine and Radiology, University of British
Columbia, Vancouver, BC, Canada
23 Department of Surgery, Curry Cabral Hospital, Lisbon,
Portugal
24 Department of Cardiology, Lady Davis Carmel Medical
Center, Technion-Israel Institute of Technology, Haifa, Israel
25 Division of Cardiology, Emory University School
of Medicine, Atlanta, GA, USA
26 Department of Medicine, Walter Reed Medical Center,
Washington, DC, USA
27 Department of Radiology, University of Ottawa, Ottawa,