J. Adamczewski-Musch4, G. Agakishiev7, O. Arnold9,10, E.T. Atomssa15, C. Behnke8, J.C. Berger-Chen9,10,
J. Biernat3, A. Blanco2, C. Blume8, M. Böhmer10, P. Bordalo2, S. Chernenko7, C. Deveaux11, J. Dreyer6,
A. Dybczak3, E. Epple9,10, L. Fabbietti9,10,∗, O. Fateev7, P. Fonte2,a, C. Franco2, J. Friese10, I. Fröhlich8,
T. Galatyuk5,b, J. A. Garzón17, K. Gill8, M. Golubeva12, F. Guber12, M. Gumberidze5,b, S. Harabasz5,3,
T. Hennino15, S. Hlavac1, C. Höhne11, R. Holzmann4, A. Ierusalimov7, A. Ivashkin12, M. Jurkovic10, B. Kämpfer6,c,
T. Karavicheva12, B. Kardan8, I. Koenig4, W. Koenig4, B. W. Kolb4, G. Korcyl3, G. Kornakov5, R. Kotte6,
A. Krása16, E. Krebs8, H. Kuc3,15, A. Kugler16, T. Kunz10, A. Kurepin12, A. Kurilkin7, P. Kurilkin7, V. Ladygin7,
R. Lalik9,10,∗, K. Lapidus9,10, A. Lebedev13, L. Lopes2, M. Lorenz8, T. Mahmoud11, L. Maier10, S. Maurus9,10,
A. Mangiarotti2, J. Markert8, V. Metag11, J. Michel8, S. Morozov12, C. Müntz8, R. Münzer9,10, L. Naumann6,
M. Palka3, Y. Parpottas14,d, V. Pechenov4, O. Pechenova8, V. Petousis14, J. Pietraszko4, W. Przygoda3, S. Ramos2,
B. Ramstein15, L. Rehnisch8, A. Reshetin12, A. Rost5, A. Rustamov8, A. Sadovsky12, P. Salabura3, T. Scheib8,
K. Schmidt-Sommerfeld10, H. Schuldes8, P. Sellheim8, J. Siebenson10, L. Silva2, Yu.G. Sobolev16, S. Spataroe,
H. Ströbele8, J. Stroth8,4, P. Strzempek3, C. Sturm4, O. Svoboda16, A. Tarantola8, K. Teilab8, P. Tlusty16,
M. Traxler4, H. Tsertos14, T. Vasiliev7, V. Wagner16, C. Wendisch4, J. Wirth9,10, Y. Zanevsky7, P. Zumbruch4
(HADES collaboration) 1
Institute of Physics, Slovak Academy of Sciences, 84228 Bratislava, Slovakia 2
LIP-Laboratório de Instrumentação e Física Experimental de Partículas , 3004-516 Coimbra, Portugal 3Smoluchowski Institute of Physics, Jagiellonian University of Cracow, 30-059 Kraków, Poland
4
GSI Helmholtzzentrum für Schwerionenforschung GmbH, 64291 Darmstadt, Germany 5
Technische Universität Darmstadt, 64289 Darmstadt, Germany
6Institut für Strahlenphysik, Helmholtz-Zentrum Dresden-Rossendorf, 01314 Dresden, Germany 7
Joint Institute for Nuclear Research, 141980 Dubna, Russia 8
Institut für Kernphysik, Goethe-Universität, 60438 Frankfurt, Germany 9Excellence Cluster ’Origin and Structure of the Universe’, 85748 Garching, Germany 10
Physik Department E12, Technische Universität München, 85748 Garching, Germany 11
II.Physikalisches Institut, Justus Liebig Universität Giessen, 35392 Giessen, Germany 12Institute for Nuclear Research, Russian Academy of Sciences, 117312 Moscow, Russia
13Institute for Theoretical and Experimental Physics, 117218 Moscow, Russia 14
Department of Physics, University of Cyprus, 1678 Nicosia, Cyprus 15
Institut de Physique Nucléaire (UMR 8608), CNRS/IN2P3 - Université Paris Sud, F-91406 Orsay Cedex, France 16Nuclear Physics Institute, Czech Academy of Sciences, 25068 Rez, Czech Republic
17
LabCAF. F. Física, Univ. de Santiago de Compostela, 15706 Santiago de Compostela, Spain a also at ISEC Coimbra, Coimbra, Portugal
b
also at ExtreMe Matter Institute EMMI, 64291 Darmstadt, Germany c
also at Technische Universität Dresden, 01062 Dresden, Germany dalso at Frederick University, 1036 Nicosia, Cyprus e
also at Dipartimento di Fisica and INFN, Università di Torino, 10125 Torino, Italy ∗
corresponding authors: [email protected], [email protected]
The inclusive production of Λ hyperons in proton-proton collisions at √s = 3.18GeV was mea-sured with HADES at the GSI Helmholtzzentrum für Schwerionenforschung in Darmstadt. The experimental data are compared to a data-based model for individual exclusive Λ production chan-nels in the same reaction. The contributions of intermediate resonances such as Σ(1385), ∆++ or N∗are considered in detail. In particular, the result of a partial wave analysis is accounted for the abundant pK+
Λfinal state. Model and data show a reasonable agreement at mid rapidities, while a difference is found for larger rapidities. A total Λ production cross section in p+p collisions at √
s = 3.18GeV of σ(pp → Λ + X) = 207.3 ± 1.3+6.0−7.3(stat.) ± 8.4 (syst.) +0.4
−0.5(model)µb is found. The study of strange hadrons produced in
nucleon-nucleon collisions in the few-Gev energy range pro-vides information about their production mechanisms [1]. The understanding of the interaction between strange hadrons and nucleons at different densities can have con-sequences also for the modelling of the interior of neutron stars since several scenarios include the possible presence
of hyperons and kaons within the dense core [2–5]. Ex-periments at beam energies of a few GeV are particularly suited for these studies; while elementary reactions pro-vide a rather clean environment [6], heavy-ion collisions allow for a sizeable compression of nuclear matter (up to 3ρ0) [7] and hence allow to probe dense baryonic matter.
Prior to an interpretation of data from heavy-ion
sions, where more exotic production mechanisms could occur, one should study strange hadrons, among oth-ers Λs, in nucleon-nucleon collisions. In particular, the energy regime of a few GeV is characterised by the ap-pearance of intermediate baryon resonances that compete with the non-resonant production of many final states [8]. A finite nuclear density larger than ρ0and a sizable
tem-perature of the system might modify the properties of the hadrons and also their production mechanisms [9] so that precise references data are necessary to quantify the expected in-medium effects.
Transport models [10, 11] are often used to interpret the measurement of nucleus-nucleus collisions in the few-GeV energy range and these need experimentally constrained differential cross sections for the different reaction chan-nels. Most of the models treat heavy-ion collisions as a superposition of individual nucleon-nucleon reactions, as far as the production of secondary particles is concerned. The question can be asked whether this approximation is appropriate or more complex correlations and interfer-ences are built. A detailed comparison of the differential spectra of strange hadrons produced in p+p and A+A collisions can certainly help in resolving this issue [1, 12]. The HADES collaboration has already carried out several exclusive measurements of final states containing strange hadrons. These studies in p+p collisions at a kinetic beam energy of 3.5 GeV have so far focused on the exclu-sive production of K0
S[13, 14], K∗[15], Λ [16], Σ(1385) +
[13, 17, 18] and Λ(1405) [17, 19], where for some of these channels also measurements of the angular distributions were possible. One of the goals of these works was to study the contribution of intermediate resonances cou-pling to the different final states, and in certain cases a clear signature of the impact of these resonances was found [17, 20]. As for Λ hyperons, a partial wave anal-ysis (PWA) was employed to analyse the exclusive re-action pp → pK+Λ and the contribution of the
reso-nances N∗
(1650, 1710, 1720, 1850, 1900, 1950) was evalu-ated. The important contribution of N∗ resonances to
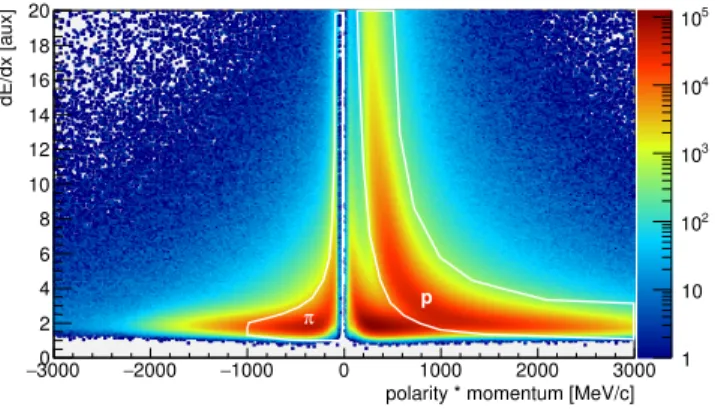
polarity * momentum [MeV/c] 3000 − −2000 −1000 0 1000 2000 3000 dE/dx [aux] 0 2 4 6 8 10 12 14 16 18 20 1 10 2 10 3 10 4 10 5 10 p π
Figure 1: (Color online). Energy loss dE/dx as a func-tion of the momentum multiplied by the charge for all particle candidates. The two-dimensional graphical cuts (white curves) are used for the particle identification.
the pK+Λfinal state was already pointed out in previous
analyses [21, 22] but the PWA allows for a more quan-titative determination of the contributing resonant and non-resonant channels. In addition to the pp → pK+Λ
exclusive reaction, many other channels contribute to the inclusive Λ production in p + p collisions. In the present work, we propose a model for inclusive Λ production which combines the information extracted from the PWA of the pK+Λfinal state [21, 22] with the measurements of
other exclusive channels containing a Λ [13, 16–18, 21, 23] and uses estimates for unmeasured channels. All chan-nels have been simulated independently; the pK+Λyield
is obtained from PWA while all other channels are added in an incoherent way. This cocktail is then used to fit the experimental data and to extract the cross section for the Λproduction and for its various contributing channels. Our paper is organized as follows. In Section I the ex-perimental data are described. Section II presents the production model used for the comparison to the exper-imental data and the evaluation of the efficiency and ac-ceptance corrections. The latter ones are described in Section III. In sections Sections IV and V the compari-son of the model to the experimental data and the extrac-tion of the inclusive Λ producextrac-tion cross secextrac-tion in p+p collisions at 3.5 GeV are discussed.
I. EXPERIMENTAL DATA
The experimental data were obtained with the High Acceptance Di-Electron Spectrometer (HADES) at the heavy-ion synchrotron SIS18 at GSI Helmholtzzen-trum für Schwerionenforschung in Darmstadt, Germany. HADES is a charged-particle detector consisting of a six identical detection sections (with a nearly complete az-imuthal coverage) centred on the beam axis and covering polar angles between 18° and 85°, and a six-coil toroidal magnet located between two pairs of tracking chambers. Each sector is equipped with a Ring-Imaging Cherenkov (RICH) detector followed by Multi-wire Drift Chambers (MDCs) – two in front of and two behind the magnetic field – as well as the two scintillator hodoscopes TOF and TOFino and a PreShower detector. The hadron identi-fication is based on the correlation between momentum and specific energy-loss information obtained from the MDC tracking detectors. In the following, the TOF-TOFino-PreShower system is referred to as Multiplicity Electron Trigger Array (META). A detailed description of HADES can be found in [24].
During an experimental campaign in 2007, a proton beam of about 106particles/s with 3.5 GeV kinetic energy
was incident on a liquid hydrogen target of 50 mm thick-ness corresponding to 0.7 % interaction probability. The data readout was started by a first-level trigger (LVL1) requiring a charged-particle multiplicity, MUL ≥ 3, in the META system. A total of 1.14 × 10⁹ events were
recorded under these experimental conditions. A dedi-cated calibration run without target was also carried out
]
2M [MeV/c
1100
1150
0 500 1000 1500 < -0.6 cm -0.8 < y < 450 [MeV/c] t 375 < p]
2M [MeV/c
1100
1150
0 5000 10000 < -0.2 cm -0.4 < y < 450 [MeV/c] t 375 < p]
2M [MeV/c
1100
1150
0 200 400 < 0.2 cm 0.0 < y < 450 [MeV/c] t 375 < pcounts [a.u.]
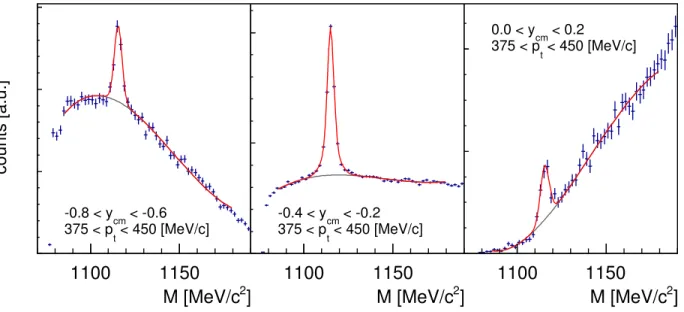
Figure 2: (Color online). Invariant mass spectrum for proton-pion pairs for three different ycms bins. The red solid
line shows the signal+background fit, the black dashed line shows the background component of the fit. and 1.2 × 10⁵ events were analysed to study the
contri-bution by off-target reactions. Λ hyperons were recon-structed exploiting the decay Λ → pπ−, BR = 63.9 %
[25]. Since cτΛ = 78.9mm, it was possible to apply
topological cuts to reduce the background contribution. The first step of the analysis consisted in the selection of the proton and negative pion candidates. This was done applying graphical cuts on the energy loss distribu-tion measured in the MDC (see white curves in Fig. 1) as a function of the particle momentum. The Λ decay point (called secondary vertex (SV)) was associated to the point of closest approach between the proton and pion tracks. The reconstructed Λ track was then extrap-olated to the target region and the intersection point with all other reconstructed tracks in the same event was com-puted. This intersection point was associated to the pri-mary vertex (PV) of the pp reaction. If no other tracks were available for a given event, the intersection between the Λ track candidate and the average beam trajectory was used. The latter is recalculated for each day of data taking. The resolution for the reconstruction of the pri-mary vertex was extracted by analyzing the empty-target data and taking the Kapton windows that enclose the LH2 target as a reference. A resolution of 3.8 mm in the z-direction was found. The resolution in the beam direction of the Λ secondary vertex reconstruction was evaluated with simulations and a value of 1.8 mm was determined.
A further analysis of the empty-target events showed the presence of a contamination stemming from hyperons produced in the 50 µm thick Kapton windows (weight fractions: 69 % of 12C, 21 % of 16O, 7 % of 14N and 3 %
of 1H) at both ends of the LH
2target. The total
contri-bution of these processes was estimated, considering the
relative thickness and density of the targets and assum-ing a scalassum-ing of the cross section with the atomic number A, to be between 3 % and 6 % [26].
The dimensions of the LH2 target extended within −65mm < z < −15 mm in length and r < 5 mm in radius. Only events with a reconstructed primary ver-tex localized within the volume defined as a tube of −50mm < z < −30 mm length and with a radius of r < 5mm, were considered further in the analysis to minimize the contribution of the Kapton windows. This selection of the z-coordinate reduces the off-vertex con-tribution from the Kapton windows to a level of less than one per mille.
In order to minimize the combinatorial background emerging from misidentified or uncorrelated pπ− pairs,
three topological cuts were applied:(1) the z-coordinate of the decay vertex must be larger than the z-coordinate of the primary vertex. This cut reduces the background by a factor of two and affects the signal only by 2 %, (2) the distance of closest approach (DCA) between the pand π− tracks should be smaller than 10 mm, (3) the pointing angle (PA) between the spatial vector connect-ing PV and SV and the momentum vector of Λ should be smaller than 0.1 rad. Additionally, the missing mass (MM) of the reaction pp → Λ + X should be larger than 1400MeV/c2.
Figure 2 shows the resulting pπ− invariant mass
dis-tribution for three bins in the pp centre-of-mass rapidity together with the fit used to extract the signal strength. The Λ peak was fitted with the weighted sum of two Gaussian distributions G(x, µ, σ) with a common mean value µ and two different width parameters σ1 and σ2
and a relative contribution c:
cm θ cos 1 − −0.5 0 0.5 1 ] -1 [MeV c cm p 0 1 3 10 × ] -1 [1/MeV c cm dp cm θ N/dcos 2 d 0 100 200 300 400 500 600 700 800 cm y 1 − −0.5 0 0.5 1 ] -1 [MeV c t p 0 1 3 10 × ] -1 [1/MeV c t dp cm N/dy 2 d 0 100 200 300 400 500
Figure 3: (Color online). Phase space distributions of Λ candidates prior to efficiency corrections. Left panel: Λ momentum in the p-p cms as a function of the polar angle cos θcms. Right panel: transverse Λ momentum as a
function of the cms rapidity ycms.
where N is the total amplitude of the signal. The back-ground distribution was modelled using the sum of a polynomial of fifth order and an exponential function. The signal yield and the error were extracted from the fit parameters and their errors. The signal to back-ground ratio was calculated integrating the fitted signal and the background functions over a µ±3σ range, where σ = cσ1+ (1 − c)σ2.
For the integrated pπ− invariant mass distribution
the mean value µ of the reconstructed Λ mass is 1115.122 ± 0.009MeV/c2 and the parameters σ1, σ2
and c are found to be equal to 4.075 ± 0.094 MeV/c2,
1.665 ± 0.023MeV/c2 and 0.487 ± 0.015, respectively. The reconstructed Λ mass is in good agreement with the PDG value [25]. The total yield of reconstructed Λs amounts to (258.2 ± 1.2) × 103 with a signal to
back-ground ratio of 0.47.
Thanks to the large statistics, two differential analyses of the Λ yield were carried out :(1) as a function of the par-ticle momentum and cosine of the polar angle, and (2) as a function of the transverse momentum and the rapid-ity. All the kinematic variables were calculated in the beam+target (p+p) centre-of-mass system (cms). The resulting phase space distributions are shown in Fig. 3 after applying an additional cut on the Λ invariant mass 1102MeV/c2 < Mpπ− < 1130MeV/c2. These
distribu-tions are not corrected for acceptance and efficiency. The geometrical acceptance of HADES allows the reconstruc-tion of Λ hyperons with a momentum between 300 MeV/c and 930 MeV/c measured in the center of mass system of the p+p collision system. The polar coverage of 18° to 85° in the laboratory system translates into 53° to 180° in the proton-proton cms (i.e. cosine between −1 to 0.6). In order to obtain differential distributions of the Λ hy-peron signal, the phase space distributions were divided into discrete bins of equal size. For the cos θcmsand pcms
variables, the intervals between [−1.0, 0.6] and [0, 1.0] GeV/c were divided into 8 and 10 bins, respectively. For
the ycmsand ptvariables, the intervals between [−0.8, 0.4]
and [0, 1.0] GeV/c were divided into 6 and 13 bins, re-spectively. A pπ−invariant mass spectrum was obtained
for each of the selected bins by applying the topological selections mentioned above and the same fit procedure as for the integrated spectrum. The signal and the cor-responding errors were also calculated in the same way. These values stay consistent within a few percent with respect to the total invariant mass spectrum fit.
II. PRODUCTION MODEL
A model for Λ production in p+p collisions at √s = 3.18GeV was built based partially on exclusive measure-ments carried out by HADES [13, 16–18, 23], and par-tially relying on a resonance model [27, 28] and results by the COSY collaboration [21]. The various contributions in the model can be divided into five categories:a) three-body direct production (pKY), b) associated resonance production (∆KY), c) intermediate resonance production (pKY∗), d) double resonance production (∆KY∗), e) 4-,
5-body, and higher order phase space production. Each channel is characterized by a total production cross sec-tion σ(id)
0 and the coefficients a0, a (id) 2 , a
(id)
4 that are
as-sociated to Legendre polynomials Pi(x) to describe the
anisotropy of the angular distributions. The employed parametrisation is: σ(x)(id)= σ (id) 0 2 n a0P0(x) + a (id) 2 P2(x) + a (id) 4 P4(x)o , (2) where x ≡ cos(θcms). The 1/2 factor is for
normalisa-tion of the shape component and a0 is fixed to 1. In
the proton-proton cms a symmetric angular distribution with respect to x = 0 must hold true and, therefore, odd-order polynomials were ignored and only the three first even terms were used.
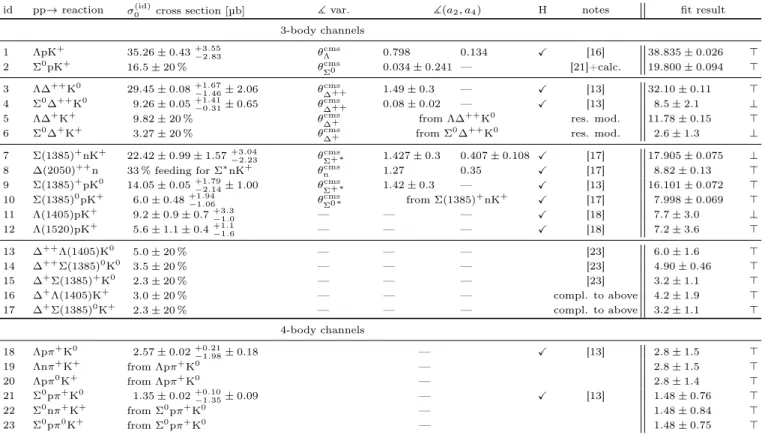
Table I: List of channels included in the production model for Λs in p+p collisions at √s = 3.18GeV. The total cross section and asymmetry parameters a2,4 are listed for each channel. The column labelled by H denotes channels
exclusively measured by HADES. The "notes" column shows source references, for the other comments please refer to the text for details. The last column lists the cross section resulting from a model fit to the data.
id pp→ reaction σ(id)0 cross section [µb] ] var. ](a2, a4) H notes fit result
3-body channels 1 ΛpK+ 35.26 ± 0.43+3.55 −2.83 θcmsΛ 0.798 0.134 X [16] 38.835 ± 0.026 > 2 Σ0pK+ 16.5 ± 20% θcms Σ0 0.034 ± 0.241 — [21]+calc. 19.800 ± 0.094 > 3 Λ∆++K0 29.45 ± 0.08+1.67 −1.46± 2.06 θcms∆++ 1.49 ± 0.3 — X [13] 32.10 ± 0.11 > 4 Σ0∆++K0 9.26 ± 0.05+1.41−0.31± 0.65 θcms ∆++ 0.08 ± 0.02 — X [13] 8.5 ± 2.1 ⊥
5 Λ∆+K+ 9.82 ± 20% θcms∆+ from Λ∆++K0 res. mod. 11.78 ± 0.15 >
6 Σ0∆+K+ 3.27 ± 20% θcms ∆+ from Σ 0∆++K0 res. mod. 2.6 ± 1.3 ⊥ 7 Σ(1385)+nK+ 22.42 ± 0.99 ± 1.57+3.04−2.23 θcmsΣ+∗ 1.427 ± 0.3 0.407 ± 0.108 X [17] 17.905 ± 0.075 ⊥ 8 ∆(2050)++n 33% feeding for Σ∗nK+ θcms n 1.27 0.35 X [17] 8.82 ± 0.13 > 9 Σ(1385)+pK0 14.05 ± 0.05+1.79 −2.14± 1.00 θcmsΣ+∗ 1.42 ± 0.3 — X [13] 16.101 ± 0.072 > 10 Σ(1385)0pK+ 6.0 ± 0.48+1.94−1.06 θΣ0cms∗ from Σ(1385)+nK+ X [17] 7.998 ± 0.069 > 11 Λ(1405)pK+ 9.2 ± 0.9 ± 0.7+3.3−1.0 — — — X [18] 7.7 ± 3.0 ⊥ 12 Λ(1520)pK+ 5.6 ± 1.1 ± 0.4+1.1 −1.6 — — — X [18] 7.2 ± 3.6 > 13 ∆++Λ(1405)K0 5.0 ± 20% — — — [23] 6.0 ± 1.6 > 14 ∆++Σ(1385)0K0 3.5 ± 20% — — — [23] 4.90 ± 0.46 > 15 ∆+Σ(1385)+K0 2.3 ± 20% — — — [23] 3.2 ± 1.1 > 16 ∆+Λ(1405)K+ 3.0 ± 20% — — — compl. to above 4.2 ± 1.9 > 17 ∆+Σ(1385)0K+ 2.3 ± 20% — — — compl. to above 3.2 ± 1.1 > 4-body channels 18 Λpπ+K0 2.57 ± 0.02+0.21−1.98± 0.18 — X [13] 2.8 ± 1.5 > 19 Λnπ+K+ from Λpπ+K0 — 2.8 ± 1.5 > 20 Λpπ0K+ from Λpπ+K0 — 2.8 ± 1.4 > 21 Σ0pπ+K0 1.35 ± 0.02+0.10−1.35± 0.09 — X [13] 1.48 ± 0.76 > 22 Σ0nπ+K+ from Σ0pπ+K0 — 1.48 ± 0.84 > 23 Σ0pπ0K+ from Σ0pπ+K0 — 1.48 ± 0.75 >
Table I shows a complete list of the different production channels included in the model. The channels with a tag in the column H are those measured exclusively in the same data sample by HADES [13, 16–18, 23]. For reac-tions which are not measured at HADES energies, either theoretical predictions from a resonance model [27, 28] are used or isospin symmetries are exploited to estimate the cross sections.
An exclusive measurement of the channel pp → pK+Λ
allowed to study the contribution of different N∗
reso-nances to this final state [16]; the results differ strongly from a phase space model [29]. In our analysis the solu-tions of a PWA fit were used in the model for the channel pp → pK+Λ. The cross section for this channel was eval-uated in [16]. The parameters for the angular distribu-tion shown in Table I were obtained by fitting the Λ polar angle distribution obtained from the PWA. The reaction pp → Σ0pK+ (id=2) was measured by the COSY-TOF
experiment at √s ≈ 2.7GeV [21]. These data and the other measurements listed in [30] show an average ra-tio of about 2.2 between the Λ and Σ0 cross sections.
For that reason, the cross section for channel id=2 was evaluated by dividing the cross section for channel id=1 by a factor 2.2 and assuming an uncertainty of 20 %. For the angular distribution, the anisotropy parameters mea-sured by the COSY collaboration [21] were used for this
channel.
Channels with an associated ∆++ resonance
produc-tion (id=3–4) were measured exclusively by HADES and also the angular distributions were extracted [13]. No data are available for the associated production with a ∆+ resonance (id=5–6), hence these cross sections were
constrained to the known cross section for the respective ∆++ channels applying the following isospin relations: σ(pp → Y∆++K0)/σ(pp → Y∆+K+) = 3. An error of
20% was assumed. The angular coefficients for channels 5 and 6 were assumed to be equal to those of the corre-sponding ∆++ channels (id=3,4).
Channels with an intermediate resonance decaying into a final state containing a Λ hyperon are listed in Ta-ble I with id=7–12 and all of them were measured exclu-sively by HADES [13, 17, 18]. The angular anisotropy for the reaction Σ(1385)+nK+, followed by the decay
Σ(1385)+ → Λπ+, was measured for the Σ(1385) and
the same distribution was used to simulate this channel. The isospin symmetric reactions with id=7,9 and 10 were assigned the same angular coefficients for the Λ in the fi-nal state. An isotropic angular distribution was assumed for the channels with an intermediate production of a Λ(1405)or a Λ(1520), since the exclusive measurement of these channels did not show any significant anisotropy [18]. Nevertheless, one should mention that the
statis-tics of the exclusive measurement of these channels was rather limited and hence the assumption could be wrong. The channels with id=13–17 represent the Λ production via an intermediate resonance with an associated ∆ pro-duction. The cross sections for the channels 13–15 were extracted from a fit to an inclusive measurement of K0 S
spectra, also performed by HADES at the same energy [23]. Channels with id=16 and 17 were considered to have the same yield as channel id=15. An estimated error of 20 % was assigned to all these cross section val-ues and no angular distributions were implemented. The four-body phase space production was analysed only in the neutral kaon channel for Λ and Σ0[13]. The
produc-tion threshold for the neutral kaon channel is only 9 MeV higher than the one for the charged kaon channels. This justifies the assumption that the phase space distribution and production cross sections should be the same for all Λ or Σ0 four-body processes. Therefore, only channels
with id=18 and 21 were considered in the global model and their cross section was scaled by a factor of three to take into account the contribution from channels with id=19–20 and id=22–23, respectively.
Other channels, with a larger number of particles in the final state, were neglected since their total contribution is expected to be negligible at energies below a few GeV.
III. CORRECTIONS AND ERROR
ESTIMATION
The production model with its input values for the cross sections σ(id)
0 and angular coefficients a (id) 2,4 as
listed in Table I was used to determine an acceptance correction matrix. Each channel was simulated using the Pluto event generator [31]. First, isotropic distributions of the different final states were simulated and in a second step weights were introduced for each simulated event to account for the channel cross section and the angular distribution. For each reconstructed Λ candidate the weight is calculated according to Eq. (2) using the θ angle depending on the specific channel as indicated in the fourth column of Table I, where the σ0 scaling factor and a
(id) 2 and a
(id)
4 coefficients are
taken also from Table I. The resulting events are then passed through a full-scale simulation composed of a Geant3 [32] part taking care of the particle interaction Table II: Cuts and their variations for the systematical
uncertanity evaluation.
Cuts variant DCA [mm] PA [rad] MM [MeV/c2]
Regular cuts < 10 < 0.10 > 1400
Loose cuts < 12 < 0.12 > 1260
Strict cuts < 8 < 0.08 > 1540
in the different sub-detectors and a digitisation part that accounts for the sub-detector response. For the simulated events the same analysis steps were followed as for the experimental data. The resulting contributions of the different channels are summed up according to their specific cross sections.
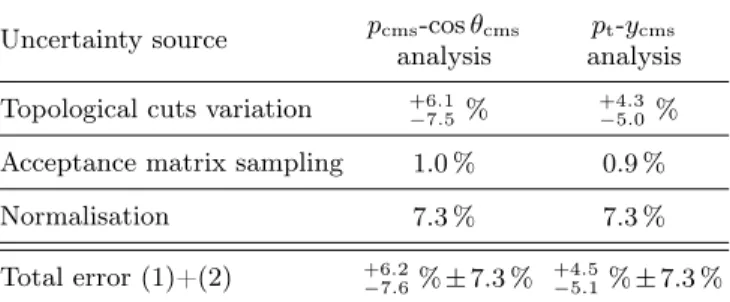
In order to compare the experimental data to the production model, corrections for the geometrical acceptance and reconstruction efficiency had to be applied. The correction matrices were obtained by dividing the discrete phase space distribution of the simulated data after the full scale analysis and the input provided by the production model before the filtering. This matrix was employed to correct the experimental data and an additional normalisation factor extracted from elastic pp events [33] allowed to evaluate the differential cross sections for the inclusive Λproduction. The normalization error is equal to 7.28 %. Systematic errors were evaluated by varying the topo-logical cuts DCA, PA and MM by ±20 % such as to ob-tain more strict or more loose selections as summarised in Table II. The errors were evaluated independently for the different phase space bins. Furthermore, the depen-dence of the acceptance correction upon the production model was tested by sampling 1000 iterations of the cor-rection matrixes obtained varying each channel cross sec-tion within the producsec-tion model according to a Gaus-sian function with sigma equal to the channel error. The angular distributions were varied only for two extreme cases, one assuming the least anisotropic distribution for all the channels listed in Table I and one assuming the most anisotropic distributions. Each channel was sam-pled independently. For each iteration a new correction matrix was evaluated and applied to the experimental data. The systematic error for the acceptance correc-tions is deduced in each bin from the RMS of the dis-tribution of reconstructed differential cross sections us-ing the different correction matrices. A summary of all systematical uncertainties is given in Table III. The sys-tematic errors due to the topological cuts reported in Table III are obtained averaging over all the pcmsand pt
bins, respectively. The total errors quoted in Table III were obtained by adding up the topological and accep-tance/efficiency correction errors quadratially.
Table III: Systematic uncertainty evaluation.
Uncertainty source pcms-cos θcms
analysis analysispt-ycms
Topological cuts variation +6.1
−7.5%
+4.3 −5.0%
Acceptance matrix sampling 1.0% 0.9%
Normalisation 7.3% 7.3%
Total error (1)+(2) +6.2
−7.6% ± 7.3 % +4.5
< -0.8 cms θ -1.0 < cos < 0.0 cms θ -0.2 < cos < -0.6 cms θ -0.8 < cos < 0.2 cms θ 0.0 < cos < -0.4 cms θ -0.6 < cos < 0.4 cms θ 0.2 < cos < -0.2 cms θ -0.4 < cos < 0.6 cms θ 0.4 < cos
]
-1b/MeV c
µ
[
cms/dp
σ
d
0 0.1 0.2 0.3]
-1b/MeV c
µ
[
cms/dp
σ
d
0 0.1 0.2 0.3[GeV/c]
cmsp
0 0.5[GeV/c]
cmsp
0 0.5[GeV/c]
cmsp
0 0.5[GeV/c]
cmsp
0 0.5 HADES pp Prod. model Prod. model fit(PWA) + +p+K Λ + +K + ∆ + Λ 0 +K ++ ∆ + Λ + +p+K 0 Σ + +K + ∆ + 0 Σ 0 +K ++ ∆ + 0 Σ + (1385)+n+K + Σ +n ++ (2050) ∆ 0 (1385)+p+K + Σ + (1385)+p+K 0 Σ + (1405)+p+K Λ + (1520)+p+K Λ 0 (1405)+K Λ + ++ ∆ 0 (1385)+K 0 Σ + ++ ∆ 0 (1385)+K + Σ + + ∆ + (1405)+K Λ + + ∆ + (1385)+K 0 Σ + + ∆
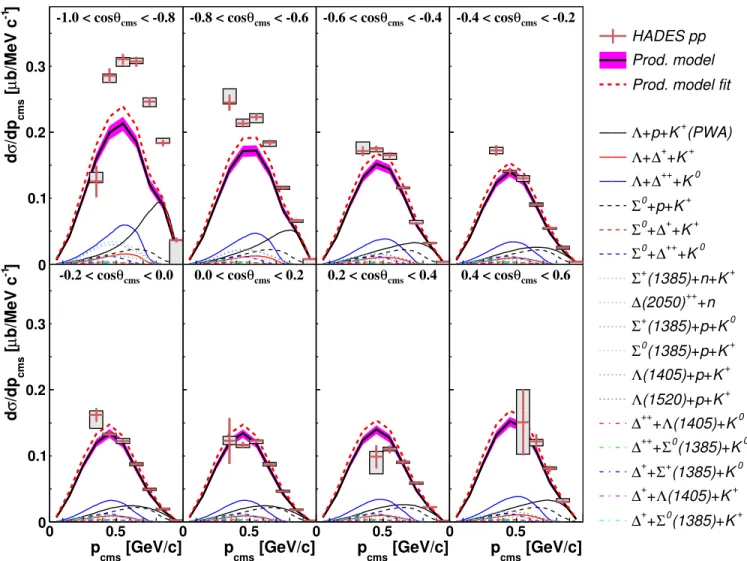
Figure 4: (Color online). Corrected experimental data and production model of the differential cross section dσ/dpcms
for different bins of cos θcms. Statistical and systematic errors are depicted by crosses and boxes, respectively. The
solid black and red dashed curves represent the original and refitted production model, respectively. The contribution by the different channels to the original model are depicted by the different curves labeled in the figure legend.
IV. EXPERIMENTAL RESULTS AND
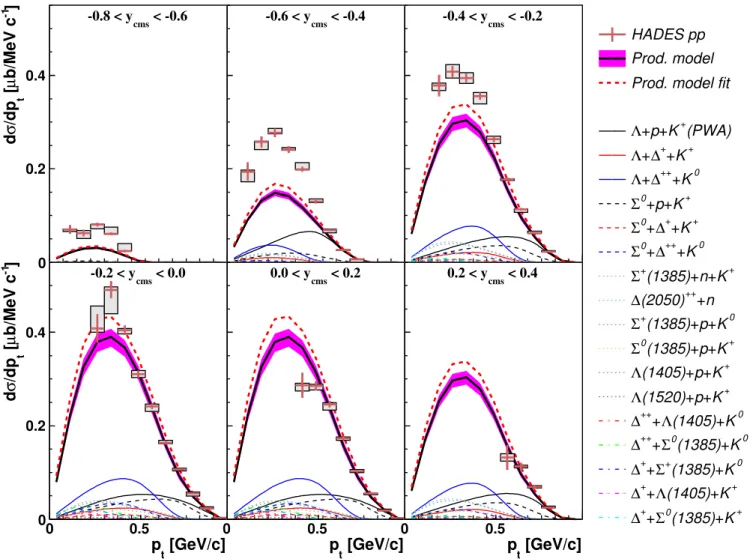
COMPARISON TO THE PRODUCTION MODEL Figures 4 and 5 show the acceptance and efficiency corrected, and normalized data as a function of the mo-mentum and polar angle (or transverse momo-mentum and rapidity) for the Λ hyperon calculated in the cms. The normalization error is equal to 7.28 %.
Figures 4 and 5 show the comparison of the accep-tance and efficiency corrected experimental data to the total production model, as a function of the cms mo-mentum pcms for different polar angle cos θcms bins, and
transverse momentum ptfor different rapidity ycms bins,
respectively. The red symbols depict the corrected ex-perimental data with the systematic errors shown by the
grey boxes. The normalisation error of 7.28 % is not shown in Figs. 4 and 5 but is considered in the evalu-ation of the error on the total production cross section. The thick black curve shows the resulting distributions from the production model taking the cross section and anisotropy parameters listed in Table I and the error band corresponds to the total errors calculated adding up the cross section errors of the different channels as independent errors. The different contributions to the model are depicted with colour styled curves. One can see a good agreement between the production model and the experimental data for all cos θcms bins except for the
most backward direction. One can also notice that the low momentum range and very forward rapidities are not covered by the HADES acceptance.
The region of cos(θcms) < −0.8 shows an enhancement
of the experimental data with respect to the model, es-pecially in the high momentum region. The sources that
< -0.6 cms -0.8 < y < 0.0 cms -0.2 < y < -0.4 cms -0.6 < y < 0.2 cms 0.0 < y < -0.2 cms -0.4 < y < 0.4 cms 0.2 < y
]
-1b/MeV c
µ
[
t/dp
σ
d
0 0.2 0.4]
-1b/MeV c
µ
[
t/dp
σ
d
0 0.2 0.4[GeV/c]
tp
0 0.5[GeV/c]
tp
0 0.5[GeV/c]
tp
0 0.5 HADES pp Prod. model Prod. model fit(PWA) + +p+K Λ + +K + ∆ + Λ 0 +K ++ ∆ + Λ + +p+K 0 Σ + +K + ∆ + 0 Σ 0 +K ++ ∆ + 0 Σ + (1385)+n+K + Σ +n ++ (2050) ∆ 0 (1385)+p+K + Σ + (1385)+p+K 0 Σ + (1405)+p+K Λ + (1520)+p+K Λ 0 (1405)+K Λ + ++ ∆ 0 (1385)+K 0 Σ + ++ ∆ 0 (1385)+K + Σ + + ∆ + (1405)+K Λ + + ∆ + (1385)+K 0 Σ + + ∆
Figure 5: (Color online). Same as Fig. 4 for dσ/d pt for different bins of ycms.
mostly contribute in this region of the phase space are the three-body channels ΛpK+ and Σ0pK+ (id=1 and
2 in Table I). Since the Σ0 channel was never measured
for this beam energy, we have scaled the cross section of this channel taking channel 1 as reference and the pre-scription from √s = 2.7GeV for the Λ to Σ0 ratio and
assumed the same anisotropy as for the measurements at lower beam energies [21]. Large systematic errors due to both assumptions cannot be excluded.
Possible candidates for the missing yield are channels with double resonance production (id=13 to 17), which were not measured exclusively but their yield was ex-tracted by fitting simulated data to experimental distri-butions [27, 28]. In this case, no assumptions could be made on the corresponding angular distributions that are hence supposed to be flat. The same problem occurs for the channels 18–23 where the cross sections could be es-timated but no information about the angular distribu-tions are available.
The contribution of the missing higher order final states in the production model was estimated by fitting the data
measured at higher energies [30] with the phase space parametrisation discussed in [14] and extrapolating to the beam energy of this measurement. The total contri-bution of these channels was found to be only 1 µb. In a second step, the cross section of the different chan-nels in the production model were varied to optimize the description of the experimental data. The cocktail was fit to the experimental data with the cross sections of all the channels as free parameters. The boundary for each cross section was set to the quadratic sum of all the errors (statistical and systematic) of each channel. The resulting model obtained after fitting is shown by the red dashed curve in Figs. 4 and 5. The corresponding cross section for each channel is shown in the last column of Table I. The error band associated to the result of the fit represents the total error of the model obtained by sum-ming the cross section errors of the different channels. Since the initial cocktail underestimated the corrected experimental spectra in the low momentum region, a gen-eral increase of the cross section is expected after the fit. To compensate the yield increase in the higher pcms (pt)
cm
θ
cos
1
−
−
0.5
0
0.5
1
b]
µ
[
cmθ
/dcos
σ
d
0
100
200
σ(x) = σ0/2 [ a0P0(x)+a2P2(x)+a4P4(x) ] 1.1 ± = 207.7 0 σ 0.000 ± = 1.000 0 a 0.014 ± = 0.812 2 a 0.017 ± = 0.168 4 a cmy
0.8
−
−
0.4
0
0.4
0.8
b]
µ [
cm/dy
σd
0
100
200
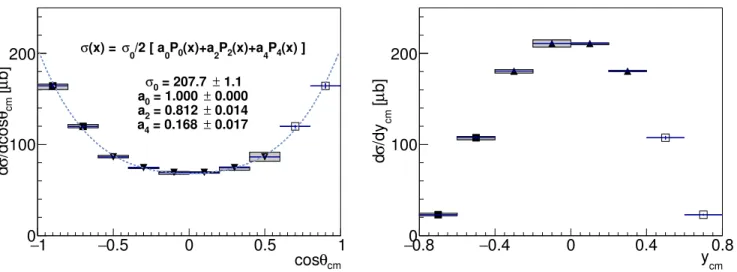
Figure 6: Differential cross section distribution dσ/dcos θcms (left panel) and dσ/dycms (right panel) extrapolated to
the whole phase space and integrated over the pcmsand pt variables, respectively. The full square symbols represent
measured data, the empty squares refer to mirrored data and the full triangle correspond to average between mirrored and measured data.
ranges a few channels experienced a decrease of the cross section. All fitted cross sections reached their boundary values (denoted as > and ⊥ for upper and lower limits, respectively).
V. CROSS SECTION EXTRACTION
The HADES acceptance does not cover the whole phase space region, hence extrapolations must be ap-plied to the experimental data to extract the 4π yield and the total cross section. In particular, the spec-trometer does not cover the forward direction (low po-lar angles, cos θcms> 0.6) and low momenta (pcms/pt<
300MeV/c). For the region of pcms/pt< 300MeV/c, the
Table IV: Summary of the extracted cross section in µb. The labels EXP and SIM refer to the contribution to the total cross section from the measured values (EXP) and extrapolation of the not covered phase space region with simulation (SIM), whereas tot refers to the total cross section. The statistical and systematic errors refer to the experimental data and also the total errors on the
production model are listed.
phase space σEXP σSIM σtot δstat δsyst δmodel
pcms-cos θcms 115.0 27.8 205.8 ±1.5 +7.1−8.7± 8.4 +0.3−0.4 pt-ycms 113.8 27.0 208.8 ±1.1 +5.0−5.8± 8.3 +0.5−0.6 Total inclusive 201.2 — 201.2 ±4.1 +7.6 −8.0± 14.7 — Model — 165.7 — — — +7.6 −8.2
production model is used to evaluate the Λ yield. The cos θcms and ycms distributions are obtained integrating
the cross section shown in Figs. 4 and 5 over all cms mo-menta and transverse momo-menta values, respectively. Due to the symmetry of forward and backward direc-tions for the cms variables in pp collisions, the cos θcms
and ycmsdistributions were mirrored at cos θcms= 0and
ycms = 0, respectively. If after mirroring two different
data points are associated to the same cos θcmsor ycmsbin
a new bin content is calculated by the average weighted with the relative error of each data point. The error asso-ciated to the average was estimated considering the two errors as independent.
The two panels of Fig. 6 show the differential cross sec-tions as a function of the polar angle and rapidity in the cms. The full square symbols represent the measured data, the empty squares refer to the mirrored data and the full triangles correspond to the averaged bins between mirrored and experimental data. For each phase space representation a cross section value was extracted sepa-rately, resulting in
σ(pp → Λ + X) = 205.8 ± 1.5+7.1−8.7± 8.4+0.3 −0.4µb,
σ(pp → Λ + X) = 208.8 ± 1.1+5.0−5.8± 8.3+0.5−0.6µb, (3) for the cos θcms and ycmsdistributions, respectively. The
cross sections values were obtained by considering both the measured and mirrored bins. Table IV shows the dif-ferent contributions to the total cross sections extracted from the two phase space representations. The EXP and SIM labels refer to the contribution to the total cross sec-tion from the measured values (EXP) and the extrapola-tion in the phase space region not covered by the HADES
geometrical acceptance via the production model (SIM) before the fit procedure described in Section IV. σtot
rep-resents the total cross section extracted with the two dif-ferential analyses and the difference between SIM+EXP values and σ stems from the mirrored bins. One can see that the fraction of the extrapolated yield adds up to about 14 % of the total yield and that the mirror-bins contribute with about 30 %. The shown errors refer to the statistical errors, systematic errors due to the cut varia-tion, normalization error and the model error is equal to the sum of all the errors on the cross sections of the differ-ent channels. The final total cross section was obtained by averaging of both distributions and is equal to
σ(pp → Λ + X) = 207.3 ± 1.3+6.0−7.3± 8.4+0.4−0.5 µb. (4) Table IV contains also the value of the total inclusive Λ cross section obtained repeating all analysis steps on the whole non-differential data sample in the same way as described above for the differential analyses. This cross-check delivers a cross section value compatible with both the results of the differential analyses.
The cross section predicted by the production model is also shown in Table IV, it equals to σ = 165.7 +7.6
−8.2 µb,
about 42 µb lower than the experimental value. The cross section value obtained after the fit of the differ-ent channels to the experimdiffer-ental data amounts to σ = 186.0+8.8−9.2 µb.
To describe the anisotropy of the total Λ distribution in the cos θcms representation, Eq. (2) was employed to fit
the distribution shown in the left panel of Fig. 6. The obtained coefficients a2 and a4 of the Λ anisotropy
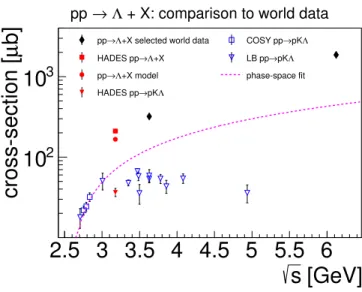
dis-tribution are listed in Table V. In Fig. 7, the cross sec-tion values from our experimental data (red filled square) and from the model before the fitting (red filled circle) are compared to the systematics measured previously [34, 35] (black diamonds) and are found to follow a consis-tent trend. The exclusive measurements of the reaction pp → pK+Λ are also shown in Fig. 7 by the empty blue symbols [21, 36] and the red full triangle [16, 30]. This channel is the first contributing to the total Λ yield in p+p reactions and, while by increasing the beam energy the pK+Λcross section saturates at a value of the order
of 30 µb to 40 µb, the phase space is gradually opened for various other channels as discussed in this work. The dashed curve shows the parametrisation by Fäldt and Wilkin [36] for pK+Λ[21].
Table V: Angular distribution coefficients a0,2,4.
σ0 [µb] a0 a2 a4 207.7 ± 1.1 1.0 0.812 ± 0.014 0.168 ± 0.017
[GeV]
s
2.5 3 3.5 4 4.5 5 5.5 6
b]
µ
cross-section [
210
310
+X selected world data Λ → pp COSY pp→pKΛ +X Λ → HADES pp LB pp→pKΛ +X model Λ → pp phase-space fit Λ pK → HADES pp
+ X: comparison to world data Λ
→ pp
Figure 7: Compilation of the total pp → Λ + X pro-duction cross section measurements. The empty sym-bols refer to the measurements of the exclusive channel pp → pK+Λ, the full symbols show the measurements of the inclusive Λ production and the dashed curve depicts a phase space fit for the pK+Λ exclusive channel in [21].
VI. DISCUSSION AND SUMMARY
We have measured the inclusive production of Λ in p+p collisions at a kinetic beam energy of 3.5 GeV in a fixed target experiment. A total cross section of 207.3 ± 1.3 +6.0−7.3± 8.4 +0.4
−0.5 µb is extracted. A
produc-tion model, composed of exclusive channels measured by HADES and simulations for the non measured pro-duction mechanisms, is compared to the experimental data after efficiency and acceptance corrections for the reconstruction efficiency and the geometrical acceptance of the spectrometer. A moderate agreement is found. The differential distributions obtained with the produc-tion model underestimate the measured ones in the re-gion of large rapidity. The total cross section from the measurement and from the production model differs by 20%. If a fit of the simulated channels to the experimen-tal data is performed, by varying only the production cross sections within the measured or estimated errors, the difference between the model and the experimental data decreases to 15 %.
Beside the lower cross section, there is also a qualita-tive difference in the angular distribution between the experimental data and the production model. This dis-agreement could be due to the fact that the cross section and angular distribution for the rather abundant pK+Σ0
channel were only estimated.
Other possible candidates for the missing yield are those channels where Λ production is accompanied by a ∆ reso-nance. Processes where ∆s and Λs are produced directly can be currently estimated only with the help of models. Missing higher order final states should contribute with
only 1 µb according to estimations based on the available phase space. It is clear that the two crucial aspects are then the direct measurement of the Σ0 channels and the
exclusive measurement of the ∆ channels. The current comparison of the production model and inclusive data allowed to extract improved cross section values for the different production channels.
The upcoming upgrade of HADES with an Electromag-netic Calorimeter and a Forward Detector will provide the possibility to measure Σ0 → Λγ decays and
recon-struct particles emitted in the very forward direction (cos θcms > 0.75). New measurements of pp reactions
at the same and similar energies will give the chance to investigate the missing channels and improve the qual-ity of the production model. Additionally, future p + p measurements will include the employment of a start de-tector to improve on the identification of charged kaons
and hence will allow for exclusive measurements of pro-duction channels with ∆ resonances.
ACKNOWLEDGMENTS
The HADES collaboration gratefully acknowledges the support by the grants LIP Coimbra, Coimbra (Por-tugal) PTDC/FIS/113339/2009, UJ Kraków (Poland) NCN 2013/10/M/ST2/00042, TU München, Garching (Germany) MLL München: DFG EClust 153, VH-NG-330 BMBF 06MT9156 TP5 GSI TMKrue 1012 NPI AS CR, Rez, Rez (Czech Republic) GACR 13-06759S, NPI AS CR, Rez, USC - S. de Compostela, Santiago de Com-postela (Spain) CPAN:CSD2007-00042, Goethe Univer-sity, Frankfurt (Germany): HA216/EMMI HIC for FAIR (LOEWE) BMBF:06FY9100I GSI F&E, IN2P3/CNRS (France).
[1] C. Hartnack, H. Oeschler, Y. Leifels, E. L. Bratkovskaya, and J. Aichelin, Phys. Rept. 510, 119 (2012).
[2] D. Lonardoni, A. Lovato, S. Gandolfi, and F. Pederiva, Phys. Rev. Lett. 114, 092301 (2015), 1407.4448. [3] J. Schaffner-Bielich and A. Gal, Phys. Rev. C62, 034311
(2000).
[4] H. J. Schulze, A. Polls, A. Ramos, and I. Vidana, Phys. Rev. C73, 058801 (2006).
[5] S. Weissenborn, D. Chatterjee, and J. Schaffner-Bielich, Nucl. Phys. A881, 62 (2012), 1111.6049.
[6] J. Adamczewski-Musch et al. (2016), 1602.08880. [7] B.-A. Li, Phys. Rev. C61, 021903 (2000).
[8] L. Fabbietti (HADES), in 11th Conference on Quark Confinement and the Hadron Spectrum (Confinement XI) St. Petersburg, Russia, September 8-12, 2014(2015). [9] G. Agakishiev et al. (HADES), Eur. Phys. J. A50, 81
(2014), 1404.3014.
[10] S. Bass, M. Belkacem, M. Bleicher, M. Brandstetter, L. Bravina, et al., Prog.Part.Nucl.Phys. 41, 255 (1998). [11] O. Buss, T. Gaitanos, K. Gallmeister, H. van Hees,
M. Kaskulov, O. Lalakulich, A. B. Larionov, T. Leit-ner, J. Weil, and U. Mosel, Phys. Rept. 512, 1 (2012), 1106.1344.
[12] N. Bastid et al. (FOPI), Phys. Rev. C76, 024906 (2007). [13] G. Agakishiev et al. (HADES), Phys. Rev. C90, 015202
(2014), 1403.6662.
[14] G. Agakishiev et al. (HADES), Phys. Rev. C90, 054906 (2014), 1404.7011.
[15] G. Agakishiev et al. (HADES), Phys. Rev. C92, 024903 (2015), 1505.06184.
[16] G. Agakishiev et al. (HADES), Phys. Lett. B 742, 242 (2015).
[17] G. Agakishiev et al. (HADES), Phys. Rev. C85, 035203 (2012), 1109.6806.
[18] G. Agakishiev et al. (HADES), Phys. Rev. C87, 025201 (2013), 1208.0205.
[19] J. Siebenson and L. Fabbietti, Phys. Rev. C88, 055201 (2013), 1306.5183.
[20] G. Agakishiev et al. (HADES), Phys. Lett. B742, 242 (2015).
[21] M. Abdel-Bary et al. (COSY-TOF), Eur. Phys. J. A46, 27 (2010), [Erratum: Eur. Phys. J.A46,435(2010)]. [22] L. Fabbietti and E. Epple, Nucl. Phys. A835, 333 (2010),
proceedings of the 10th International Conference on Hy-pernuclear and Strange Particle Physics.
[23] G. Agakishiev et al. (HADES), Phys. Rev. C90, 054906 (2014), 1404.7011.
[24] G. Agakishiev et al. (HADES), Eur. Phys. J. A41, 243 (2009), 0902.3478.
[25] K. A. Olive et al. (Particle Data Group), Chin. Phys. C38, 090001 (2014).
[26] R. Lalik, in 53rd International Winter Meeting on Nu-clear Physics (PoS, 2015), vol. PoS(Bormio2015)009. [27] K. Tsushima, A. Sibirtsev, and A. W. Thomas, Phys.
Lett. B390, 29 (1997), ISSN 0370-2693.
[28] K. Tsushima, A. Sibirtsev, A. W. Thomas, and G. Q. Li, Phys. Rev. C59, 369 (1999), [Erratum: Phys. Rev.C61,029903(2000)].
[29] L. Fabbietti et al., Nucl. Phys. A914, 60 (2013). [30] A. Baldini, V. Flaminio, W. G. Moorhead, and D. R. O.
Morrison (1988), vol. 12b of Landolt-Börnstein - Group I Elementary Particles, Nuclei and Atoms, chap. Reaction 1 - 32.
[31] I. Frohlich et al., PoS ACAT2007, 076 (2007), 0708.2382.
[32] R. Brun, R. Hagelberg, M. Hansroul, and J. C. Lassalle, Simulation program for particle physics experiments,
GEANT: user guide and reference manual (CERN,
Geneva, 1978).
[33] A. Rustamov and T. H. Collaboration, AIP Conference Proceedings 1257, 736–740 (2010).
[34] R. Eisner, W. Fickinger, S. Glickman, J. Malko, J. Owens, D. Robinson, S. Dado, A. Engler, G. Keyes, T. Kikuchi, et al., Nucl. Phys. B123, 361 (1977). [35] K. Alpgård, V. Andersen, A. Frodesen, V.-M. Hagman,
P. Hulth, U. Svedin, J. Tuominiemi, P. Villanen, and N. Yamdagni, Nucl. Phys. B105, 349 (1976).
[36] G. Fäldt and C. Wilkin, Zeitschrift für Physik A Hadrons and Nuclei 357, 241 (2014).