The economic challenges of the
refugee crisis in the European
Union
A thesis submitted in the modality of dissertation to the Católica Porto Business School to obtain the Master’s degree in Finance
by
Rafael Pizarro Bravo Ferreira de Castro
Under the orientation of Prof. Carlos Seixas
Católica Porto Business School July 2018
iii
Acknowledgments
This work wouldn’t be possible without the contribution of several people. Sadly, only some of whom I can mention here. I am especially gratefull to:
Professor Carlos Seixas, for the guidance given throughout this work and the valuable feedback.
The good working people of the Portuguese Permanent Representation to the European Union, with whom I did my internship, in particular to Dr. António Jorge Portas for his testemony given in this work and for all the support and willingness to assist me.
My grandparents, for always being there when I needed.
My brother, for continuasly challenging me to be better in my everyday life.
My parents, my rolemodels who shaped me into the person I am today. This work is yours as much as it is mine. I am forever gratefull to you both.
Abstract
The unexpected outbreak of asylum seekers in the recent years set multiple challenging tasks to be fulfilled. We focus our analysis on the challenges the European Union, as a conglomerate of countries willing to provide the immediate cares to these masses, faces when welcoming a great number of refugees into its population.
The European Union has suffered a considerable increase in its share of older population which results in a meaningful pressure on the welfare systems (and on the population in general) of multiple MS. The refugee surge appears as a favourable event on this matter as it is mainly characterized by an influx of population aged between 16 and 65 years of age.
When reviewing the literature on immigration, we find that in several past experiences the immigration of workforce, specifically from population fleeing war or political conflicts, resulted in a significant economic growth for the host region/country.
The swift integration of refugees is a key drive to assure the well-functioning of the labour market and inherently, of the labour market conditions that regard the native population.
The major challenges that the EU face both in the short and in the medium-long run are also addressed in this thesis, and the most proeminent challenge, that concerns the cost the member states incur when accepting the refugees in their countries, appears as succesfully completed as the influx of asylum seekers already reached its climax and are expected to decrease in the upcoming years.
Resumo
O surto inesperado de requerentes de asilo dos últimos anos resultou em vários desafios exigentes para serem cumpridos. A nossa análise foca-senos desafios que a União Europeia, como um aglomerado de países dispostos a oferecer os cuidados imediatos a estas massas, enfrenta, ao acolher um grande número de refugiados na sua população.
A União Europeia sofreu um aumento considerável na sua população idosa que resulta numa pressão substancial nos sistemas de proteção social (e na população em geral) dos diversos estados membros. O surto de refugiados apresenta-se como um evento favorável neste âmbito caracterizando-se, maioritariamente, por um influxo de população na faixa etária dos 16 aos 65 anos de idade.
Ao revermos a literatura sobre a imigração, concluímos que em diversas experiências passadas a imigração de mão de obra, especialmente devido a guerras ou conflitos políticos, resultou num significante crescimento económico no país anfitrião.
A rápida integração dos refugiados é um fator crucial para assegurar o bom funcionamento do mercado de trabalho e, consequentemente, das condições da população nativa no mercado de trabalho.
Os maiores desafios que a União Europeia enfrenta acurto e a médio-longo prazo, são também abordados nesta tese, sendo o desafio mais proeminente, o custo incorrido pelos estados membros ao receber um grande número de refugiados, demonstrando-se como cumprido e bem-sucedido, visto que o influxo de refugiados já atingiu o seu clímax e é esperado que diminua nos próximos anos.
Table of Contents
Acknowledgments ... iii
Abstract ... v
Resumo ... vi
Table of Contents ... viii
Table of Figures ... ix
Glossary ... 11
Chapter 1 - Introduction ... 13
Chapter 2 - The European Union ... 17
2.1. Overview of the demographic trends ... 17
Chapter 3 - The Economic Impact of Immigrants ... 31
3.1 Impact on product ... 31
3.2 Impact on wages ... 33
3.3 The Mariel Boatlift: an example ... 37
3.4 Conclusion ... 40
Chapter 4 - Integration of migrants ... 43
4.1 Integration in the labour market ... 44
Chapter 5 - The challenges ... 53
Chapter 6 – Conclusions ... 57
Bibliografia... 61
Websites ... 65
Table of Figures
Figure 1 - Evolution of the natural change as a % of the total population in the EU-28 ... 18
Figure 2 - Evolution of the live birth and death ratios in the EU-28 (per 1000 inhabitants) ... 19
Figure 3 - Population with 65 or over years of age in proportion to the population between 15 and 65 years ... 20
Figure 4 – Young dependency ratio ... 21 Figure 5 - Population dependency ratio ... 22 Figure 6 – Demographic impact on annual TFP growth, 1984 – 2007 (percent) ... 24 Figure 7 - Demographic impact on annual TFP growth, 2014 – 2035 (percent) ... 25 Figure 8 - Components of population change in the EU (as a percentage of the total population) ... 26
Figure 9 – Number of first-time asylum applicants in the EU (2008-2017) .... 27 Figure 10 – First-time asylum requests as a percentage of the total net migration (statistically adjusted) ... 28
Figure 11 – Immigrants’ age groups, 2013-2016 ... 29 Figure 12 - Unemployment rate by place of birth and migration status of people between aged 15-64 ... 45
Figure 13 – Unemployment rate by migration status, in 2014, of 15-64 aged population, in the EU-25, Norway and Switzerland ... 48
Figure 14 – Employment rate by migration status, in 2004, of 15-64 aged population, in the EU-25, Norway and Switzerland ... 49
Figure 15 –Refugees by main host countries in selected European countries, 15-64, 2014, thousands ... 50
x
Figure 16 – Employment and unemployment rate of refugees, other non-EU born and natives in the EU, aged 15-64, 2014 ... 51
Figure 17 – Employment rate of refugees and foreign-born, aged 15-64, 2014 ... 52
Glossary
EU – European Union
TFP – Total Factor Productivity MS – Member State(s)
13
Chapter 1 - Introduction
It is a known fact that the EU is in-need of working population in the economy. The baby-boom generation from the 50s and 60s, the extended life expectancy of nowadays, and the low fertility rates of many MS results in demographic tendencies that will lead to a future critical need of labour force (Fassman & Sievers 2013).
The MS have been implementing measures, such as offering attractive conditions to foreign workforce to immigrate to their country or decreasing the taxes paid by enterprises so that new corporations can establish their headquarters within their country, to counter these tendencies and prevent these trends from continuing to happen. Another common effort made by the governments are giving incentives to the general population to grow a family, delaying the retirement age and increasing the taxes paid by the workforce. However, they are most likely unsustainable in the long run.
According to population projections from the European Commission (Eurostat, 2016), between 2016 and 2079, the EU will have a negative cumulative natural change1 of roughly 56 870 million. At the same time, the total population change2 is expected to be positive because of the cumulative net migration3 of 65 521 million. Inother words, without migration the demographic development of the MS would result in age pyramids narrow at the bottom and sizeable at the top.
In 2015, the world witnessed the greatest refugee (consult Annex 1 for a deeper understanding of the concepts) surge since the World War II (UNCHR, 2015). The conflicts in the Middle East and in the North Africa led to the flee of huge
1 Difference between the number of live births and the number of deaths over a period of time.
2 Difference in the size of a population between the end and the beginning of a given period of time.
14
masses of population into Europe hoping to find proper life conditions. This unexpected event resulted in a meaningful amount of expenditures both in administrative and frontier-protection costs. The resources were not available immediately and the entry-countries were not financially capable of handling effectively with the arrival of nearly 1.3 million asylum seekers.
A great part of these asylum seekers is now living in refugee camps settled in many countries across Europe. These camps are often compared to prisons where the asylum seekers are offered a daily portion of food and water and are not given the possibility to work while they are asked to patiently wait for the delayed decision to where and when are they going to be reintegrated in (Sarah, 2013).
The EU followed a set of directives and rules that dictates which MS is responsible for processing asylum seekers, called the Dublin III regulation. Its rules were suspended in 2015 because of the increasing strains brought by the climax of the refugee crisis: possibly due to the bureaucratic overload but also due to the public pressure put on the governments on a national level (Griese, 2017).
Surveys show that a clear majority of Europeans believe that the influx of refugees will increase the likelihood of domestic terrorism and that growing diversity on their home countries does not make it a better place to live in (Pew Research Center, 2016). These believes shared by a substantial part of the people often allied with xenophobic attitudes and unreasonable ideas towards the immigrants, ultimately result as a threat to an efficientintegration of the immigrants in their new host countries.
The aim of this thesis is to answer the following questions: “Which are the expected repercussions the EU will be subjected to when welcoming refugees?” and “Is the integration of the immigrants being properly carried out?”.
15
This thesis offers the interested parties an insight of the modern migrant crisis and its consequences. This paper also accesses the economic implications the EU is and will be facing when welcoming the asylum seekers, from the moment that aid is offered to the integration of the former in the internal job markets. Immigration positively impacts the output a country produces. When it comes to the effect of immigration on the labour market from the host countries, immigrants do not seem to depress the wages and job opportunities of native workers. On the contrary, immigration pressures the natives to seek higher education and/or specialized jobs which ultimately results in higher paying jobs for the native population. Whenever possible, we assess the impact of the refugees in the labour market of the host country, however, the lack of data on this subject doesn’t allow us to study its effect extensively like, for instance, the immigration does. Summing it up, all arguments presented point to the same idea - the migration of working population to the EU is a pillar for its future economic growth.
In respect of the method used in this thesis, it is qualitative, through a vast research on working papers, books, studies released by international organizations and a final interview to Dr. António Jorge Portas, a Counsellor of the Permanent Portuguese Representation to the European Union, where we address the migrant crisis in the EU from the perspective of a collaborator that works directly with the Concil of the European Union offering a productive different insight on this matter (see Annex 5). However, we present a solid statistical analysis through the treatment of several databases made available by the European Commission.
In Chapter 2, we present a statistical analysis on the characteristics of the population in the EU and its MS. In Chapter 3, we review the literature on the economic impact of the immigrants and we present two different studies on the impact of two distinct past refugee migrations. The integration of the migrants is
16
also a highlighted topic on this thesis (see Chapter 4) and where the EU seem to struggle on. Finally, we appoint the most relevant challenges the EU faces nowadays when welcoming these flows of refugees (Chapter 5).
17
Chapter 2 - The European Union
2.1. Overview of the demographic trends
According to the UN’s latest estimate, the world’s population has grown from 2.5 billion in 1950 to more than 7.3 billion in 2015, leading to a substantial increase of approximately 191%. The EUhas followed this trend but at a slower pace. From 1950 to 2015, the EU4 went from 379,04 million inhabitants5 into 507,492 million people, representing a growth of nearly 34%. In other words, the population of the EU represented roughly 15% of the world’s population in 1950, stands for approximately 7% nowadays.
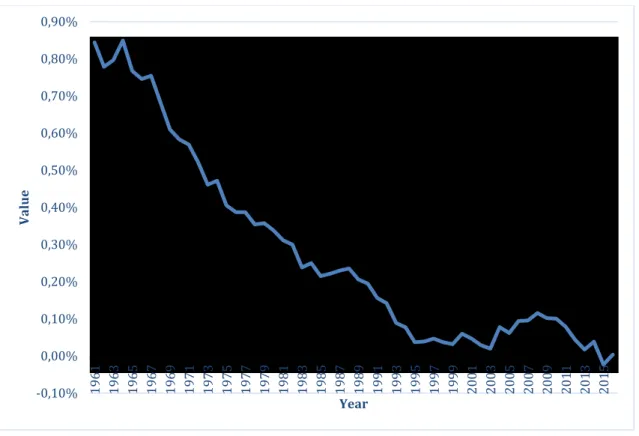
The natural change6 in the EU does not seem to follow the same path as the growth of its population. Figure 1 shows the evolution of the natural change ratio in the EU. Over the years, we can notice a declining tendency of the natural change rate value and most importantly, we can witness the first negative value in over 50 years occurring in 2015.
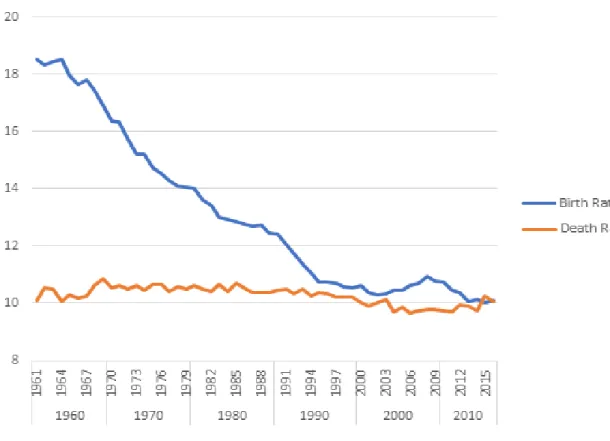
We can also observe this phenomenon from a different view on Figure 2, i.e. observing both the live birth rate and the mortality rate of the EU-28. The live birth rate suffered a sharp decline ranging from 18,54 in 1961 into 10,09 in 2016. The mortality rate, however, remained almost constant, with a rate of 10,10 in 1961 compared to 10,05 in 2016. In 2015, the mortality rate (orange line) surpasses the live birth rate (blue line), supporting the negative natural change rate showed previously in Figure 1.
4 The data regarding the EU includes the UK because it is still part of the EU at the time of this work.
5 Excluding the inhabitants from the following micro-states: Andorra, Liechtenstein, Monaco, San Marino and the Vatican
City.
18
Figure 1 - Evolution of the natural change as a % of the total population in the EU-28
Source: Author’s calculations based on data retrieved from the following Eurostat dataset: “Population change - Demographic balance and crude rates at national level [demo_gind]”
-0,10% 0,00% 0,10% 0,20% 0,30% 0,40% 0,50% 0,60% 0,70% 0,80% 0,90% 19 61 19 63 19 65 19 67 19 69 19 71 19 73 19 75 19 77 19 79 19 81 19 83 19 85 19 87 19 89 19 91 19 93 19 95 19 97 19 99 20 01 20 03 20 05 20 07 20 09 20 11 20 13 20 15 V al u e Year
19
Figure 2 - Evolution of the live birth and death ratios in the EU-28 (per 1000 inhabitants)
Source: Author’s calculations based on data retrieved from the following Eurostat dataset: “Population change - Demographic balance and crude rates at national level [demo_gind]”
Moreover, the life expectancy at birth increased significantly. As an example, Malta presented an increase of 11,5 years in its life expectancy at birth from 1980 to 2015. Actually, as time went by, all MS without exception saw an increase in their life expectancy at birth (Annex 2)7.
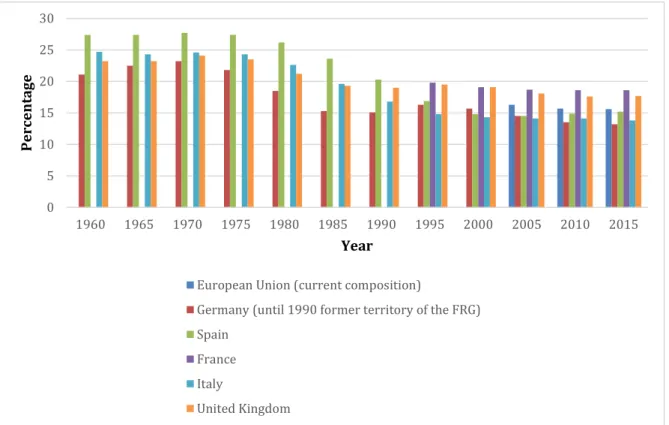
These demographic trends lead to an unavoidable increase of the elderly population in the EU. From 1991 to 2016, the proportion of population over 65 years of age increased significantly in the EU and, specifically, in five greatest8 economies in the EU (Figure 3). In the EU, it was observed an increase of 25% from 2001 to 2016.
These changes in the age distribution of the population will have multiple economic and social effects on the MS.
7 This was not exclusive of the EU, as according to the World Bank (2016) the world’s average life expectancy increased
from 52.586 years in 1960 to 71.889 years in 2015.
20
Figure 3 - Population with 65 or over years of age in proportion to the population between 15 and 65 years
Source: Author’s computation using Eurostat dataset “Population: Structure indicators [demo_pjanind]” *Missing values in the database didn’t allow us to show the evolution of the EU elderly population in
the total population prior to 2001 and in France for the year of 1960)
Additionally, there is a decrease in the young dependency ratio (Figure 4) 9, i.e. the amount of population aged between 0 and 14 years of age in the total working age population (15-64 years of age). The favourable aspect is that in the short-run, the working-population is having less economical pressure to sustain this group age. The unfavourable part is that in the long-run, this age group will eventually become the working age population and this last age group will be thinner than the previous one.
9 For this discussion, we will use France, Germany, Italy, the United Kingdom and Spain as benchmarks for the EU due
to: 1) their substantial economic output when compared to other member states; 2) given that they represented 63% of the EU population in 2017; 3) data availability.
0% 5% 10% 15% 20% 25% 30% 35% European Union (current composition) Germany (until 1990 former territory of the FRG)
Spain France Italy United
Kingdom Pe rc en ta ge Countries/Years 1960 1991 2001 2016
21 Figure 4 – Young dependency ratio
Source: Author’s computation using Eurostat dataset “Population: Structure indicators [demo_pjanind]”. Notes: Unavailability of data for France prior to 1991. The “Mean” value is the mean of Germany, Italy, United Kingdom and Spain values from 1960 to 1990, and from 1995 to 2015 the value of France was utilized as well.
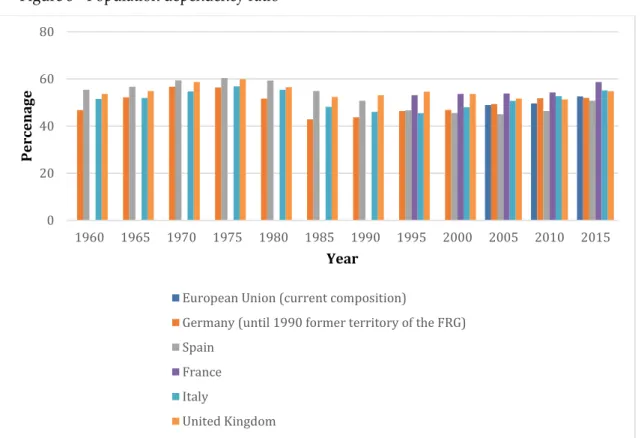
There has also been an increase in the population dependency ratio – the non-working population vis-à-vis the non-working-population (Figure 5). For example, in the last 20 years Germany’s population dependency ratio increased 12%, in France it increased more than 10% and in Italy 21%. When this ratio increases, the burden on the workforce increases because of the higher economical dependency of young and elderly people. This results in a widespread of consequences in the labour market, as the working-aged population is the one that provides it; in savings, since savings are higher in the working-aged population and ultimately, in the public finances (Bloom et al., 2010). The European Commission (2010) already acknowledged the important economic challenge the MS face with the constant growth of their aging populations.
0 5 10 15 20 25 30 1960 1965 1970 1975 1980 1985 1990 1995 2000 2005 2010 2015 Per cent age Year
European Union (current composition)
Germany (until 1990 former territory of the FRG) Spain
France Italy
22 Figure 5 - Population dependency ratio
Source: Author’s computation using Eurostat dataset “Population: Structure indicators [demo_pjanind]”. Notes: Unavailability of data for France prior to 1991. The “Mean” value was computed by a calculation of a mean of Germany, Italy, United Kingdom and Spain values from 1960 to 1990, and from 1995 to 2015 the value of France was added to the calculation. Data regarding the EU (current position) starts from 2005 due to inexistence of prior data covering all member states.
Japan was the first nation experiencing a large shrinking of its working age population and an enlargement of its elder population. It offers a valuable case-study apprenticeship for the EU MS. Briefly, Japan suffered a significant decline in its working age population, and consequently a declining in its labour force. The constraint on the labour supply lead to an inferior marginal product of capital, which in turn, resulted in a gradually decrease on Japan’s economic growth (Shirakawa, 2012).
Persson (2002) reached a similar result but for a different nation, the United States of America. The author evaluated the impact on output of a higher dependency ratio and concluded that there was a negative impact on the per capita GDP growth.
0 20 40 60 80 1960 1965 1970 1975 1980 1985 1990 1995 2000 2005 2010 2015 Per cena ge Year
European Union (current composition)
Germany (until 1990 former territory of the FRG) Spain
France Italy
23
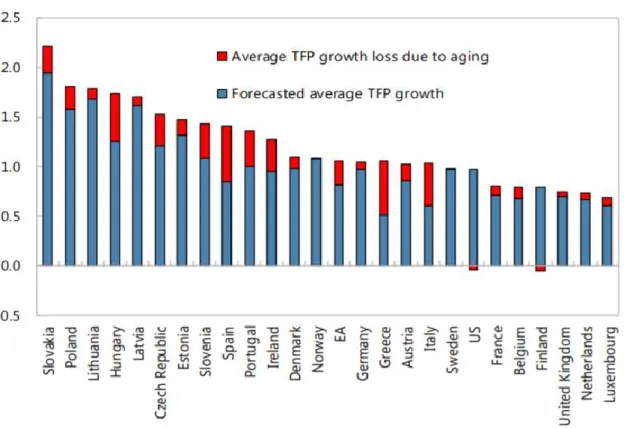
Moreover, a recent study found that an increase in the ratio of workers with +55 years of age in the total working-population results in an economical and statistical decrease in the growth rate of labour productivity (Aiyar, Ebeke, & Shao, 2016)10. The same study presented the demographic impact on the annual TFP from 1984 to 2007 in the European economies (Figure 6), and a projection of an even more severe impact in the future (Figure 7).
Regarding the relationship between these demographic tendencies and public expenditures, OECD (2017) concludes that the public expenditures on pensions increased from an average of 6.7% of GDP to 8.2% between 2000 and 2013 in the OECD countries. This work also discloses that on average, public pensions account to 18% of the total public finances, being the largest single item on social expenditures in most of the times.
Notwithstanding, there is a key factor that differs from these patterns which has not been on our scope of analysis: migration.
10 Specifically, Aiyar et al. (2016) estimated that an increase of 1 percentage point in the 55-64 age group of the workforce
24
Figure 6 – Demographic impact on annual TFP growth, 1984 – 2007 (percent)
Source: Retrieved from the IMF working paper Aiyar et al. (2016) Notes: United Kingdom starts from 1985; Switzerland starts from 1992; Austria and Ireland start from
1995; Estonia and Slovakia start from 1996; Latvia, Lithuania, and Slovenia start from 2001. EA comprises Belgium, Finland, France, Germany, Greece, Italy, Luxembourg, Netherlands, Portugal, and Spain.
25
Figure 7 - Demographic impact on annual TFP growth, 2014 – 2035 (percent)
Source: Retrieved from the IMF working paper Aiyar et al. (2016)
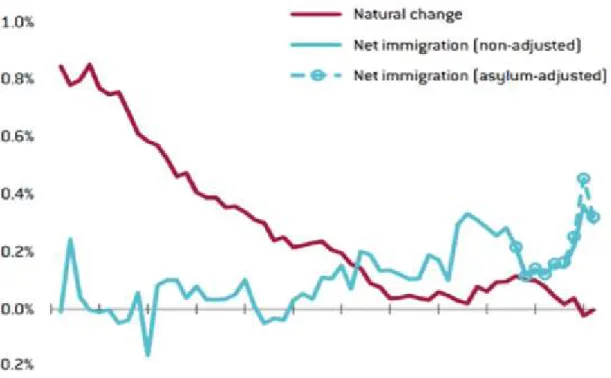
Through the years, migration into the EU followed an opposite evolution than the natural change (Figure 8). From 1960 to 1985, net immigration (the difference between people entering and people leaving the EU) fluctuated between positive and negative values while the natural change has been constantly positive but decreasing. Since 1985 until the present, net immigration values were always positive. Moreover, as from 1992 it features as a more contributor component to the population growth than natural change.
26
Figure 8 - Components of population change in the EU (as a percentage of the total population)
Source: Retrieved from Batsaikhan et al. (2018)
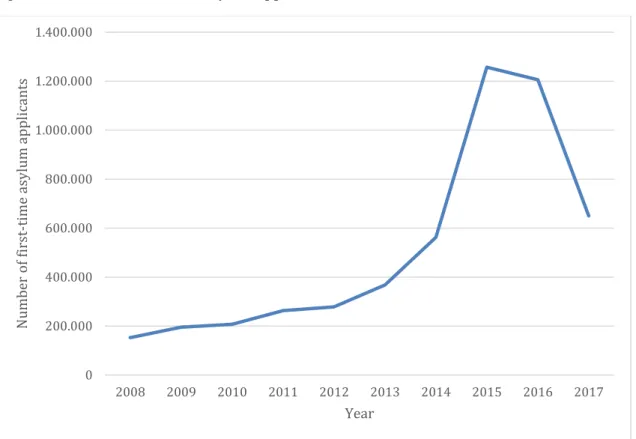
It is of extreme importance to realize that the flows of immigrants not always had the same reasons behind their movements. Often in the past, an enhanced economic status was the main driver for immigration (Peri, 2016). In the recent years however, the EU has been the destination of an astounding number of refugees fleeing war and conflicts zones especially from the Middle East and North Africa (MENA) Bommes et al. (2014). From 2008 to 2017, the EU received more than 5 million first time asylum requests (for additional details on the possible asylum decisions outcomes please consult Annex 3),3,675 million of which occurred between 2014 and 2017 (Figure 9).
27
Figure 9 – Number of first-time asylum applicants in the EU (2008-2017)
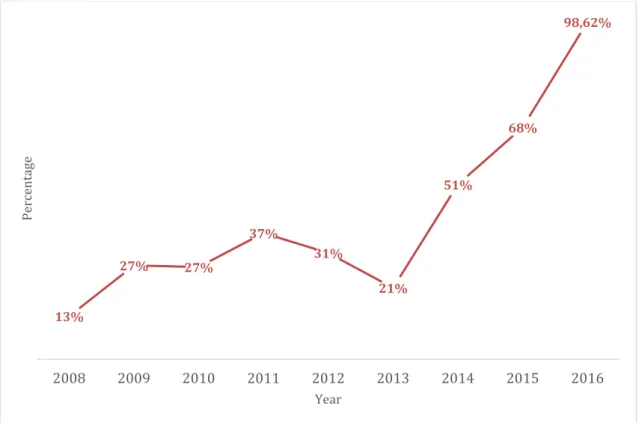
Source – Data retrieved from Eurostat dataset “Asylum and first-time asylum applicants by citizenship, age and sex Monthly data (rounded) [migr_asyappctzm]” In other words, records show that in 2014, 2015 and 2016 the inflow of asylum seekers were of extreme significance. In 2016, as a title of example, the amount of asylum seekers was pratically the same as the inflows due to the net migration (Figure 10).
Regarding the immigration of the non-EU citizens, as we can see from
Figure 11 most of the foreign population entering the EU MS are in the working-force age group11. In 2014, of the 1 565 740 immigrants with foreign citizenship 1 443 139 were on the working-force age group, a roughly 92% participation. Immigration into the EU from foreign citizens presents as a possible solution to MS’ aging population problem. The arrival of population ready to join the workforce may attenuate the pressure put on the MS welfare systems (United Nations 2000). However, EU citizens show a negative perception on the impact of immigration on
11 It is considered that the working-force age group agglomerates the population between 15 and 65 years of age.
0 200.000 400.000 600.000 800.000 1.000.000 1.200.000 1.400.000 2008 2009 2010 2011 2012 2013 2014 2015 2016 2017 N umb er of fir st -time a syl um a pp lic an ts Year
28
the public services (Heath et al., 2016). The economic impact of immigrants is going to be further developed in the next chapter.
Figure 10 – First-time asylum requests as a percentage of the total net migration (statistically adjusted)
Source: Author’s computations using Eurostat datasets: “Asylum and first-time asylum applicants by citizenship, age and sex Monthly data (rounded) [migr_asyappctzm]” and “Population change - Demographic balance and crude rates at national level [demo_gind]”
13% 27% 27% 37% 31% 21% 51% 68% 98,62% 2008 2009 2010 2011 2012 2013 2014 2015 2016 Pe rce ntage Year
29 Figure 11 – Immigrants’ age groups, 2013-2016
Source: Author’s computation using Eurostat dataset “Immigration by age group, sex and citizenship [migr_imm1ctz]” 0 250.000 500.000 750.000 1.000.000 1.250.000 1.500.000 1.750.000 2.000.000 2.250.000 2013 2014 2015 2016 N umb er of immi gr an ts Years
Immigrants' age groups
31
Chapter 3 - The Economic Impact of Immigrants
There is a wide range of literature on this field covering themes such as the economic impact of migration on the fiscal policies, to the labour markets or on the total output. Some of the works discussed in this chapter conclude a positive impact from migrants on the host countries while others find neutral or negative impacts. The impact of unexpected inflows of asylum seekers is also discussed. Even though there isn’t a clear conclusion, the literature review allows us to plausibly appoint some factors of great relevance that affect the economic outcome of immigration: the type of the economies on which they are re-inserted, the characteristics of the migrants and the quickness of their integration.
3.1 Impact on product
Ortega and Peri (2014) in their macroeconomic study, estimated the impact on GDP per capita of a diverse-origin working-population on several countries (both developed and developing countries) and concluded that the host countries have seen their income per capita increase in a substantial value. Alesina, Harnoss, and Rapoport (2013) also found a positive correlation between birthplace diversity in the workforce and both GDP and TFP.
However, Aleksynska and Tritah (2015) made a harsh critic to the Ortega & Peri (2014) analysis. Migrants have different life experiences than natives, and consequently developed different skills. This affects the productive skills and thus immigrants and natives cannot be treated as homogenous. Nevertheless, Aleksynska and Tritah (2015) achieved alike results from the previous authors. Despite controlling for the endogeneity of migration and differentiating between high and low skilled workers, immigration still shows a positive impact in the economy of the hosting country, mainly through increases in income and labour productivity.
32
Borjas (2003) also treats workers as imperfect substitutes. Even though they might have the same level of education, they have distinct levels of experience, and thus, cannot be treated as perfect substitutes. His work estimates the impact of immigration in the wages of the natives and it will be discussed further, in the next section.
Ottaviano and Peri (2012) and Felbermayr et al. (2010) are other authors that assume, as well, the imperfect substitutability of immigrants and natives, strengthening even more the critic made to Ortega and Peri (2014). The latter authors,
“find evidence for immigration to be positively and causally related to per capita
income” (page 179).
Borjas (2013) studies the impact of the immigrants in the United States of America. He believes immigration (legal and illegal) made the overall U.S economy larger, estimating an annual 10,7% increase in the GDP of the country.
Jaumotte, Koloskova, & Saxena, (2016) estimation model is based on Ortega and Peri (2014), however, their model is more relevant to our study because their sample is restrained to developed economies alone (and so are all the EU MS). Therefore, a more challenging test on the possibility of immigration affecting GDP per capita occurs due to the elimination of the frequent gaps in incomes between developed and developing countries. These authors found that in the long-run, hosting countries’ GDP per capita can grow up to 2 percentage points for each 1 percentage point increase in the proportion of migrants in the total adult population.
The recent decision of the United Kingdom to leave the EU – also known as “Brexit”12
- has been a matter of study in this field as well. Portes & Forte (2016) used previous estimation models from Jaumotte et al. (2016) and Boubtane et al. (2014) to estimate the long-term economic impact in the UK from a reduction in the immigration from other EU MS. Using Boubtane et al. (2014) estimates, their computed scenario showed a negative significant impact in the GDP per capita and GDP, 0,1% and 0,3% respectively, from a reduction of 100 000 in the UK’s net migration. Using Jaumotte et al. (2016) work,
33
GDP per capita would decrease by 0,4% and GDP by 0,55%. Finally, the authors project scenarios for the evolution of GDP and GDP per capita until 2030. In both scenarios (central and extreme) GDP and GDP per capita would fall. In the intermediate scenario, GDP fall would be between 2,73% and 5,19% and GDP per capita between 0,92% and 3,38%. In the extreme scenario, GDP decreases between 4,35% and 8,18% and GDP per capita between 1,53% and 5,36%.
From the literature review discussed in this section, it can be understood that the numerous authors studying this subject seem to agree that immigration impacts the output of the host country positively, specially in the long-run.
3.2 Impact on wages
Nickell & Saleheen (2015) collected data on different jobs taken by immigrants on a regional level in the United Kingdom. In their computations, they used a weighted average of native and immigrants’ wages to assess the impact of immigration on the value of the former. They find a small but negative impact on the average occupational wage rate of the natives across the regions (roughly a 1,5% drop in the native workers’ wages in the semi/unskilled sector).
Portes & Forte, (2016) using Nickell and Saleheen (2015) estimates, evaluate the impact of immigration on wages in the low to medium skill service sector. They conclude that an increase of 1 percentage point in the proportion of immigrants translates into a decrease of the wages in this sector of almost 0.2%. The decrease in the wages of the natives is near to 0.15%. Additionally, the authors appoint the great likelihood that EU migrants will rather impact this sector than the total working age population given they are more likely to enter on this sector. Based on this, they achieve a positive impact on wages of a decrease in migration to the UK, referring an increase in wages of 0.12% by 2020 and 0.51% by 2030. Borjas (2003) also finds a negative impact on wages resulting from the immigration in the United States of America. He collected data on education and age groups of
34
immigrants and natives across the USA country between 1980 and 2000, and concluded that the influx of immigrants in the 1980s and 1990s reduced the wage of the native workers, on average, by 3.2%. Some educational groups, namely the high school dropouts, saw their wages dropped by 8.9%. Additionally, it is concluded that an influx of immigrants that increase the workforce in 10% reduces annual earnings by 6.4% and the total time worked by 3.7%.
Card (2005) on the other hand, finds no evidence that confirms Borjas’ (2003) work. He found that immigration had a minimal impact on the low-skilled (high school dropouts) natives’ wages across the cities of the USA. Manacorda et al. (2006) reach the same conclusion but in the UK. Even though their work shows that immigration decreases the incomes of the immigrants relative to the natives, they also prove that due to the reduced immigrants’ proportion in the total population (4%) the impact in earnings is minimal and hence, refer that may be the reason to why so many studies fail to find a significant effect on the natives’ labour market outcomes.
Ottaviano and Peri (2012) study the impact of immigration on wages from 1990 to 2006 in the United States of America. They used different levels of elasticity of substitution between natives and immigrants according to the groups’ education background and experience and they found that, in the long-run, immigration increased the average wage of a native worker by 0.6% and a large negative effect on the average wage of previous immigrants of about 6%.
Chassamboulli and Palivos (2013) study the impact on the natives’ labour market conditions due to an increase in immigration in Greece between 2000 and 200713. Most of the immigrants were unskilled, which resulted in an increase in the opportunities of the skilled native workers, lowering their unemployment rate. Their wage rates also increased. However, the wages of the unskilled native workers decreased on average, because immigrants were paid less than natives. Due to the lower wages, the employment cost of unskilled labour decreased which encouraged the increase in job
35
posts, increasing the job opportunities of the unskilled natives. Nevertheless, the overall effect on the native workers was positive.
Cattaneo et al. (2015) analyse the effect of immigration on the native population using the data collected by the European Community Household Panel from 1994 to 2001 in the EU-15. They found that immigration generate opportunities for natives to secure higher-paying and specialized jobs as most of the immigrants take the manual and routine jobs. Additionally, immigration also showed to accelerate the process of career upgrade of the natives. When it comes to the self-employment workers, the authors found that a 1 percent increase in the foreign-born self-employment workers can translate into a decrease up to 1.1 percent of the native self-employment, however, the decreases in wages of the native self-employed were not statistically significant.
Foged and Peri (2016) study the impact of a refugees’ surge in Denmark. The influx was due to war crisis in Bosnia, Somalia, Afghanistan and Iraq, and the data range of the analisis covers the period between 1994 and 2008. The refugees were received by the denish municipalities and the analisis focused on comparing the ones which received refugees with the ones which didn’t. According to the Denmark’s refugee-dispersal policy (between 1986-1998), the municipalities received refugees without being aware of their characteristics, thus there were municipalities which received more Bosnian or Somalian or Afghan or Iraqi refugees than others. Furthermore, the authors purposely detail the analyse of the data covering native individuals aged 18-65 without college education, i.e low skilled, because they believed they’re the workers who face the greater direct competition with refugee immigrants. In 1994 occured a large inflow of refugees, mainly due to the Balkan war14, and consequently forced the revoke of the refugee-dispersal policy in the following years. However, since a great number of refugees were already residing in the municipalities, the newcomers would preferably join their communities which made the placement of the new refugees pratically follow the same initial pattern. As a last note before
36
presenting their results, the data gathered by the Danish authorities allow this work to follow every or any wage or occupation of the same native-individual even if this same individual moved from one municipality to another15. This was highly useful from the period 1994 onward, when a greater impact was felt. As it was said early, the skills of the refugees were mainly low, and this resulted in a positive effect on the wages and employment of the low skilled natives as they were encouraged to change specialization and take more complex occupations specializing in non-manual jobs. The high skilled natives on the other hand, had no incentive to change specialization as the low skilled refugees constitute a complement in their production tasks. Hence, the effect on their wages is significant, positive and larger than the effect on low skilled native workers. Additionally, to increasing the wages of both high and low skilled natives, the influx of refugees also increased the wage differential between these two groups.
The low skilled native individuals presented a 4% increase in the complexity index in the municipalities with greater refugees’ influx. After 15 years, the effect on their specialization and occupation of less manual jobs is still significant which suggests a permanent shift. Following the individual cohort (rather than the municipality), wages of native unskilled workers saw a permanent increase of 2.4% in the more exposed municipalities, and likewise, the positive effect on wages is still significant after 15 years for all municipalities. Following the municipality data, the average (positive) wage effect was closer to 1.4%.
In addition, the authors still approached the effect of the refugees’ influx excluding those considered as permanently disabled16 on the unemployed of low skilled natives. They assessed that native low skilled workers were, on average, employed 10% more hours in the municipalities highly exposed to immigration than those in municipalities with lower exposition. This result is allined with the previous results
15 To the best of our knowledge, this is the only work in this literature who treated data capable of tracking the same
individual through time and space.
16 Bratsberg et al. (2010) found that 74 percent of the immigrants that were unemployed received a permanent disability
37
as most of these natives that were out of job were young and thus they gradually found employment in highly cognitive jobs which are complementary with the manual jobs of most (low skilled) refugee immigrants.
3.3 The Mariel Boatlift: an example
In 1980, the USA received a very large flow of Cuban immigrants – this phenomenon is most often referred to as the “Mariel Boatlift”17. The state of Florida was the main destination of the migrants and between May and September 1980 the city of Miami received approximately 125 000 Cubans. It is estimated that about half of these immigrants settled permanently in Miami, rising its workforce by 7%. Card (1990) studies the impact of the Mariel Boatlift on the Miami’s labour market.
Card (1990) retrieved data from four other cities in the U.S.A with similar economic growth and demographic conditions in the late 70s and the early 80s. He separated the population in different ethnic groups so that he could analyse the impact of the sudden flow of immigrants with thorough detail.
Miami and the comparison cities showed a similar employment growth rate between 1976 and 1984. The unemployment in Miami increased from 5% in April 1980 to 7.1% in July however, nationwide unemployment rates followed a similar trend suggesting this was not exclusive due to the immigration of the Mariels. There was no negative effect on the wage rates of the non-Cuban ethnic groups through 1979 and 1985. In fact, the city of Miami even showed a better evolution than the comparison cities.
Moreover, the author did not find evidence that the Mariel influx had an impact on the unemployment rate of other ethnic groups. Regarding the Cuban ethnic group however, there was a meaningful increase in their unemployment rate in Miami. Card (1990) indicated that the Cubans’ unemployment rates were nearly 3 percent higher
38
between 1980-1981 than what it would have been expected based in previous and later patterns. However, he found no evidence the earlier Cuban immigrants were affected substantially by the arrival of the Mariels.
According to the March 1985 Current Population Survey, 56,5% of the Mariels had no high school education. This means that the increase in the labour supply of less-skilled occupations was much greater. Still, the study showed there was no effect on the wage rates of the less-skilled non-Cuban groups as well as no notable evidence of an increase in their unemployment rates.
The author compared the net immigration rate of natives and earlier immigrants between Miami and other cities in Florida and noticed the net immigration had slowed substantially. He believes that “to some extent the Mariels may have displaced other immigrants from within the United States who could have been expected to move to Miami.” (page 257).
The city of Miami witnessed a phenomenal and exemplar integration of the Mariel immigrants. The fast absorption of the immigrants into the labour force can be explained due to several “welcoming” characteristics that the city of Miami had that the other comparison cities did not have.
First, the characteristics of the Miami labour market were a perfect suit for an influx of low-skilled labour. The labour market had been adapting to unskilled manpower in the years before the Mariel immigration due to previous influxes of unskilled labour which allow the Mariels to enter the labour market with relative ease.
Second, and accordingly to the 1980 Census, Miami was the most immigrant-intensive city of the country with 35,5% of its residents being foreign-born. Additionally, a sizable portion of the Miami’s population were Hispanic which made the lack of knowledge of the English language among the Mariels to have smaller effects than what it could have been expected.
39
Finnaly, Miami had been receiving flows of Cuban emigrants in the two decades before the Mariel Boatlift. Family reunification and positive past integration experiences from Cuban people may helped the integration of the Mariel immigrants. Bodvarsson et al. (2008) also perform an analysis of the Mariel Boatlift. They find a positive and significant effect on wages of native white wages unlike Card (1990).
Moreover, Borjas (2017) also reached different results from Card (1990). He assessed the evolution of the wages in the low-skilled workforce between 1977-1979 and 1981-1986, and proved the average wage of the low-skilled workers dropped significantly, between 10 and 30%. Moreover, the author defends that the Mariel immigrants had, after all, a “sizable negative effect on the wage of competing workers” (page 1108). Lastly, Borjas (2017) is critical of Card (1990) because Borjas believes spatial correlations in specific places suffer from endogeneity problems – for instance, immigrants could have settled in in high-wage regions and thus, studying the impact on wages in a high-wage region is very different than in a low-wage region.
On the other hand, Peri and Yasenov (2015) critic the usage of only two years data (1977-1979) by Borjas (2017) to measure the effect on wages brought by the Mariel Boatlift. They attempt to improve Card’s (1990) work by applying the Synthetic Control Method18. They found no significant negative impact, on the contrary, they found a small, yet positive impact on wages.
It is far-fetched to compare this sudden flow of Cubans into Miami to the refugee flows the EU have been receiving. Miami received around 125 thousand people in 5 months while the EU received more than 4 million in the last 5 years (2013-2017). Furthermore, it is to note that this case-study from the city of Miami showed a very different approach regarding the receptiveness of the migrants. Miami showed to be very openly to integrate the newly-come immigrants in its labour market while, the
40
EU, have seen some MS to do the exact opposite, as António Jorge Portas mentioned see question 3 in Annex 5 “(…) em muitos EM as respetivas classes dirigentes concluíram que a melhor forma de lidar com o fenómeno migratório e gerir as consequências da pressão migratória seria a adoção de medidas mais restritivas, para tentar dar resposta aos anseios e receios, fundados ou não, da opinião pública. Podem aqui referir-se alguns dos EM do Leste, em particular o grupo de Visegrado composto pela PL, HU, SK e CZ, mas também alguns EM do Norte da Europa, em que a DK será o exemplo mais evidente.”. However, this experience the city of Miami went through may be looked at as an exemplar occurrence of immigrant integration on a micro-level that the EU countries aim to reach on a macro-level. We will dive deeper on the integration of immigrants and its relevance at an economic perspective in the next chapter.
3.4 Conclusion
The most basic economic principals explain that an increase in the labour supply inherently decreases the real wages in the short run. However, numerous authors prove it wrong and show us that the matter is not that simple. The level of expertise of the immigrants, the type of economies where they are re-inserted and the amount of the influxes of immigrants are some of the relevant factors which may dictate their economic impact and alter the suggestion of a decrease in the real wages brought by the law of supply for example. In fact, it has been proved that an increase in the labour supply due to the arrival of immigrants may increase the host country GDP and move the natives to higher-paying jobs without deteriorating the overall wages’ conditions. There are no certain conclusions and it is impossible to suggest the immigrants can worsen or improve the host countries’ economies without doubt because every host country and immigrant influx have their unique characteristics.
41
Notwithstanding, with this chapter one can indicate key factors brought by immigration, such as the number of immigrants arriving, their education degree and work experience, that certaintly influence (either positively or negatively) the economic features of a host country.
43
Chapter 4 - Integration of migrants
Integration is a multi-faceted process that includes themes from an economic perspective such as the labour market integration to themes more linked to the social integration such as the access to the national health care systems and the participation in the different social institutions such as associations and organizations or events. We will especially focus our analysis in an economic overview. Naturally, asylum seekers face greater challenges to their integration than other migrants. For one, a great part of the asylum seekers are still living in low-cost houses and refugee camps waiting for the outcome of their application. Additionally, refugees face aggravated legal barriers to employment (Hatton, 2013) while the other migrants migrate to specific locations with a job already secured in most of the cases.
The labour market integration of refugees is crucial to relieve the public finances as they move from receiving assistance to paying contributions, resulting as well in GDP per capita gains. Notwithstanding, it has been proven that resettled refugees have a slower labour market integration when compared to other migrants even when controlling for educational attainment, host country language skill and age (Ott, 2013). The knowledge of the host country’s language is a key driver to integration as it is positively correlated with the employment rate19. Dumont et al. (2016) found that if refugees had the same level of language as natives do, the labour market participation20 of the former would be 10 percent higher.
In this chapter, we will approach the “refugee gap”21 in the labour market, addressing both the employment and the unemployment rates, barriers to integration, the impact of education in the labour market outcomes, the financial inclusion of the refugees and the improvement of their integration through time.
19 Calculated through dividing the employed population by the total working age population (aged 15-64)
20 Calculated through dividing the labour force by the total working-age population)
44
4.1 Integration in the labour market
The labour market participation of refugees is a key indicator of the degree of integration of the migrants. In Annex 4we can observe the numerous studies and their findings of the labour market performance of refugees compared to other migrants and the natives. Very briefly, the resettled refugees show higher unemployment rates22, lower labour market participation, significant lower earnings and higher welfare usage than both other migrants and the native population. The data presented in the following paragraphs will be, whenever possible, divided between three different groups: native-born, first-generation migrants23 and second-generation migrants24.
On average, in the year of 2017 in the EU, the unemployment rate among the natives was 7,2 percent while the foreign-born presented nearly the double reaching an unemployment rate of 13,6 percent. However, over time, there is a significant positive economic development given that the unemployment rates decreased (Figure 12).
22 Calculated through dividing the number of unemployed people by the labour force.
23 Refers to the foreign-born citizens that immigrated to the EU.
45
Figure 12 - Unemployment rate by place of birth and migration status of people between aged 15-64
Source: Author’s computations using Eurostat dataset: “Unemployment rates by sex, age and country of birth (%) [lfsa_urgacob]”. The EU citizens living in a MS other than their birth country had their unemployment rate decrease from 13,3% in 2012 to 7,7% in 2017. The native-born unemployment dropped as well since they had 9,9% in 2012 and 7,2% in 2017. The non-EU born showed the greater change in their unemployment rate, going from 19,6% in 2012 to 13,6% in 2017.
In Figure 13, we can have a closer look to the challenge the foreign-born face in the EU MS individually when it comes to their integration into the labour market.
The first-generation migrants refers to the population born outside the EU but migrated into the EU and the second-generation migrants are their children which already have born in the EU. Controlling for the unemployment rate of the natives in their country25, the countries where the first-generation migrants seem to struggle the most to join the labour market are Belgium, Luxembourg, Sweden, Norway and
25 This was computed by dividing the unemployment rate of the 1st generation migrants for the native’s unemployment
rate in the same country.
0,0 5,0 10,0 15,0 20,0 25,0 2012 2013 2014 2015 2016 2017 Pe rc en ta ge Year
46
Switzerland. In the previous listed countries, the unemployment rate among the migrants were two times greater than the unemployment rate of the natives despite Belgium and Norway, where the migrants experienced unemployment rates three times higher than the natives. This means that the migrants face considerable challenges to integrate in the job market, especially in these countries. There are some countries however, where the migrants registered lower unemployment rates comparing to those of the natives, namely, in Cyprus, Latvia and Hungary. When it comes to the employment rate (Figure 14), in Czech Republic, Greece, Italy, Lithuania, Luxembourg, Hungary, Malta, Poland, Portugal and Slovakia this group showed higher employment rate than the natives. This most likely suggests either that migrants came to these countries with a job already secured or they presented better educational and/or professional backgrounds than natives. Notwithstanding, in Belgium, Germany, France, Austria and Sweden, this group presented an employment rate at least 8% lower than the natives.
Regarding the second-generation migrants, they presented employment rates higher than the natives in Bulgaria and Lithuania. They also presented a level of employment close26 to the natives in Czech Republic, Estonia, Latvia, Poland, Slovenia, Slovakia, United Kingdom and Norway, suggesting successful integration processes. However, in Belgium, Germany, Greece, Spain, Croatia, Italy, Cyprus, Portugal and Finland, natives showed employment rates at least 14 percent higher which is a very concerning finding. Looking at these employment rates, specially at the disparities between the natives and the second-generation migrants in the latter countries, we can conclude that there’s still a long way to an effective integration of the migrants to take place.
The unemployment rate of this group though, show slightly brighter outcomes than their predecessors relative to the native’s employment rate, easing their integration to
47
the labour market. In fact, in Poland, second-generation migrants presented an unemployment rate 2.1% lower than the natives.
Overall, the non-EU born have on average greater challenges in the labour market presenting weaker labour market outcomes than natives (European Commission, 2016). From our analysis, even though the second-generation of migrants seem to register better labour outcomes overall when compared to the first-generation of migrants, in some countries the differences in employment between the migrants and the natives still reach very significant values. As a title of example, in Cyprus the difference in the employment rate of the natives when compared to the second-generation migrants is of 23,9%, while, when it comes to their predecessors, the biggest difference registered between them and the natives is in Sweden, and its value is 13%.
48
Figure 13 – Unemployment rate by migration status, in 2014, of 15-64 aged population, in the EU-25, Norway and Switzerland
Source: Edited using Eurostat dataset: “Unemployment rate by sex, age, migration status, citizenship and educational attainment level [lfso_14luner]”. Note: due to missing values, the following countries were deleted from the sample: Bulgaria, Lithuania, Malta, Romania and Slovakia.
0,0 5,0 10,0 15,0 20,0 25,0 30,0 35,0 40,0 Pe rc en ta ge Countries
49
Figure 14 – Employment rate by migration status, in 2004, of 15-64 aged population, in the EU-25, Norway and Switzerland
Source: Edited using Eurostat dataset: “Employment rate by sex, age, migration status, citizenship and educational attainment level [lfso_14lempr]”. Note: Romania was excluded due to missing values.
4.2 The case of the refugees
The refugees are a particular case because they make up a specific inner group from the foreign-born immigrants. According to the EU Labour Force Survey27, in 2014, 52% of the working-age non-EU born migrated into the EU due to family reasons, 25% for work reasons, 7% for educational reasons and 7% (1.8 million28) were refugees constituting the smallest non-EU born migrant group. In 2014, 80% of the refugees were residing in four EU MS (Germany, United Kingdom, Sweden and France) (Figure 15).
27 Please consult http://ec.europa.eu/eurostat/web/microdata/european-union-labour-force-survey for additional details.
28 Denmark, Ireland and The Netherlands did not present data on this matter, meaning that, in reality, there are more
than 1.8million refugees in the EU.
0,0 10,0 20,0 30,0 40,0 50,0 60,0 70,0 80,0 90,0 Be lgiu m Bul ga ria Cze ch R ep ubl ic Ge rm any Es ton ia Gre ece Spa in Fra nce Croa tia It al y Cyp ru s La tvi a Lith ua ni a Lu xe m bou rg H unga ry Ma lt a A us tria Po la nd Po rt uga l Sl ove ni a Sl ova kia Finl and Sw ed en U nit ed K ingd om Norwa y Swit ze rl and Pe rc en ta ge Countries
50
Figure 15 –Refugees by main host countries in selected European countries, 15-64, 2014, thousands
Source: Retrieved from Dumont et al. (2016).
In Figure 16 we can notice that, in 2014, on average, 56% of refugees are employed while among the natives the employment rate is 65%. The refugees’ unemployment rate is 19% representing the highest value among the non-EU born groups (and among the natives).
The employment rate of the refugees varies across the MS. In Spain and Finland, refugees’ employment rate is 40,6% and 43,4% respectively, while in Slovenia, Italy and Austria it is 74,1%, 61,3% and 60,2% respectively. Comparing their employment rates with the other foreign-borns (Figure 17), they are still very behind. It was only in two countries (Italy and Slovenia) that they did surpass the employment levels of the other foreign-born, one’s data of which considered as low reliable. In the other 10 countries of our sample they presented lower employment rates than the first generation of migrants, especially in Spain, where their rate was 30.1% below.
51
Figure 16 – Employment and unemployment rate of refugees, other non-EU born and natives in the EU, aged 15-64, 2014
52
Figure 17 – Employment rate of refugees and foreign-born, aged 15-64, 2014
Source: Author’s computations using Eurostat datasets: “Employment rate by sex, age, migration status, citizenship and educational attainment level [lfso_14lempr]” & “Employment rate of first generation of immigrants by sex, age, years of residence and reason for migration [lfso_14l1empr]”. Note: *Low reliability data for Croatia and Slovenia. The remaining EU member states were omitted due to the lack of data.
0,0 10,0 20,0 30,0 40,0 50,0 60,0 70,0 80,0 Pe rc en ta ge Countries Refugees Foreign-born
53
Chapter 5 - The challenges
The most immediate challenges the EU faced and is currently facing when hosting a large group of individuals who seek refuge are the government expenditures and the increase in the aggregate demand. The hosting countries committed additional public spending for the first reception cares and services such as the provision of housing, food and water, health and education to the asylum seekers. As the procurement for these products and services increases, as well as an overall increase in the aggregate demand, it is to expect an increase in the overall prices. At the same time, while the refugees gradually join the labour market, the host countries may witness possible downward pressures on wages. By other words, the diminishing purchase power and the increasing level of prices translates into a challenge the EU MS are already addressing: inflation. This effect is specifically aggravated in countries like Italy, Greece and Hungary where the asylum seekers arrive and simply await to receive the refugee status to move to more attracting countries like Germany and Sweden where they expect to find lesser barriers to employment. In this last scenario, those three MS apply resources with a reduced chance of producing returns since the recently arrived workforce leaves short after.
The fiscal costs supported by the governments and their fiscal policies are also a relevant challenge. The hosting countries’ policies need to be adapted to include the additional government spending associated with the welcoming of the individuals who seek asylum. The applicants in the asylum process are assisted for a period up to 2 years and the rejected applicants up to 1 year and both these types of individuals are still not eligible to work. Additionally, the accepted applicants who are unemployed benefit from monetary aids from the social welfare systems. The costs in border-control and security issues are also significant, especially in the first-entry countries such as Spain, Italy and Greece. The integration programs are also highly costly. These are examples of fiscal costs supported by the governments and the challenge the
54
hosting countries face is to shape their fiscal policies in order to include the costs of receiving refugees while at the same time not deteriorating the lifestyle of the population and stimulating the economy.
Another challenge is the swiftness of the integration of the newcomers into the labour market. As we addressed before in Chapter 4,the skills and work experience of the refugees, their ability to learn the native language, among other factors, are all characteristics that influence their integration into the economy that are out of the scope of the governments. However, the hosting countries may assist and contribute for a swifter integration, for example by implementing integration plans and courses which would be mandatory to attend by the refugees and creating incentives that encourage the enterprises to hire refugees. In fact, in Austria, Germany and Sweden, the three countries who received the greatest number of refugees, it has been made mandatory for a third-country national to attend integration programs29. The final goal of these programs is to help the newcomers to be reinserted into society, adopting the cultural values of the hosting countries. For example, the German integration course, combines 600 hours of German language courses and 100 hours of civic orientation. In Sweden, as of the 1st of January of 2018 refugees are mandatory to attend a 2 years
Introduction program in which they receive educational duty lessons and are taught about the insights needed to be inserted in the Swedish society and labour market. The Swedish government created also a “fast-track” program for the newcomers whose skills and experience background meet the Swedish labour market needs such as doctors, school teachers and pharmacists. Even though these integration programs can be costly, they should be sustainable as they expectily bear positive outcomes for the economy in the medium to the long term. The social aid the refugees receive for 2 years are deducted in the long run as they join the labour market and start to
29 On 7 June 2016, the European Commission presented the Action Plan on Integration which, among other propositions,
suggest third-country nationals’ access to social assistance should be conditional on their participation on the integration programs created by the EU member states.
55
contribute to the social welfares in the form of taxes to their income, this is, evidently, if a proper integration effort is carried out.
The impact in the medium to long term period crucially depends on the refugees’ integration into the labour market. The extent to which the skills of the foreign nationals complement or substitute those of the natives is also a relevant factor. Recently, the unemployment rates among natives and foreign-born population are still very different. For example, as of March 2017, 4.1% of the natives in Sweden were unemployed compared to 22.2% among the foreign-born population (European Parliament, 2018). Regarding the refugees, from the query to 25 OECD countries, the gap in the unemployment rate between natives and refugees were of 9% (Dumont et al., 2016). Given these disparities in unemployment and the growing share of third-country nationals among the EU population, it is expected a decrease in the GDP per capita (especially in the MS who welcome a high number of refugees). On the other hand, as the workforce grows, it is to expect an increase in the GDP of the hosting countries. Nonetheless, the MS face the challenge of narrowing the unemployment gap between natives and foreign-born over time without rising government debt (especially on those countries with fragile fiscal positions) nor affecting the living-style of the population. The role of policies is of a great deal as well.
Another expected barrier in the long-term is related to the public opinion towards the refugees. The growing anti-immigrant attitudes and the growing influence of national political parties that advocate a more restrictive approach towards the immigrant policies across the EU – as stated by António Jorge Portas in question 4 in Annex 5 “vários EM se começou a verificar um acentuar de viragem em direcção a políticas claramente restritivas da imigração, extremistas e populistas, como é o caso, apenas a título de mero exemplo, na PL, HU, AT, IT, e o crescimento dos partidos políticos da extrema-direita radical em alguns outros, como é o caso mais paradigmático da Alemanha” – are very likely to negatively impact the social cohesion and the political environment across the MS. Ultimately, reaching an agreement that
56
satisfies all the MS on the reform of the Common European Asylum System will be an harder task, as António Jorge Portas asserted in question 6 in Annex 5: “Na reforma do sistema de asilo e a criação de um sistema reforçado de gestão de migração legal não será fácil acolher políticas nacionais hoje tão diferentes”, which will eventually translate into difficulties for the successful integration of the refugees.
When it comes to the problems brought by the aging of the population and namely, by the workforce (Chapter 2), Aiyar et al. (2016) identified the policies which would help minimize the negative marginal effect of the previous on the TFP. Providing ease and greater access to health care services and active labour market policies focused on the training and the development of the workforce’s skills, are the (statistically significant) policies in which a greater attention should take place. The government contribution to investments on R&D is also a policy that contributes to minimizing the effect of aging on TFP.