Determinants of capital structure of firms: an
analysis on the Euro Zone and the U.K.
Rafael Garcia
Master in Finance and Taxation
Supervisor: António Cerqueira
Co-Supervisor: Elísio Brandão
i
Biographical note
Rafael Garcia is a Portuguese national born on the 25th of June, 1993. Being an enthusiast on strategy and optimization, he attended the Faculty of Economics of the University of Porto (FEP-UP) from 2011 to 2016. He enrolled in a Bachelor’s course in Economics (from 2011 to 2014), immediately followed by a Master’s course in Finance and Taxation (from 2014 to the present date). Connected to his interests, he also enrolled in two short-term courses abroad during this time: a course in Project Management in the University of Cologne (2013) and a course in Advanced Corporate Finance in the London School of Economics and Political Science (2014).
Work-wise, Rafael Garcia started working at Nestlé Danmark A/S, the local headquarters for Nestlé in Denmark, Finland, Norway and Sweden. In March 2016 he was invited to be part of the Specialist services team, in the Finance & Control department. Tasks vary from consolidation and reporting of financial accounts to Nestlé HQ in Switzerland, to assistance in tax related matters, internal control and insurances, having been recently appointed Insurance manager for the Nordics region.
ii
Acknowledgements
Having no doubt that this work would never be achievable without the encouraging and support of many, I would like to express my sincere gratitude to the ones mentioned below:
My supervisors (Professor António Cerqueira and Professor Elísio Brandão) for all the direct guidance provided in the project of my dissertation;
My colleagues in the Master of Finance and Taxation, for without their teamwork this journey would have been much harder;
All the teachers and professors I have had during my academic life, whose contribution shall be manifested throughout my entire life. In particular, I would like to thank Mrs. Fernanda Pereira and Mrs. Emília Mota;
Finally, but foremost, my family (pets included!) and friends, for providing a cause to long for in the end of the day.
iii
Abstract
The capital structure of firms has been a widely discussed subject in the world of corporate finance in the last decades. The aim of this paper is to analyse how some of its determinants previously studied by several authors, either firm characteristics and institutional settings, affect the financial structure of said firms. We perform a multivariate analysis with OLS using two equations, one for each of the dependent variables (market leverage and book leverage). We use a White estimator (diagonal) to avoid possible heteroscedasticity problems due to the use of panel data. Our sample includes firms from the UK, traditionally labeled as a market-oriented economy, and the Eurozone, considered a set of bank-oriented economies, totaling 4337 firms. The results suggest that there are no major differences in these two sets, concerning the behaviour of the determinants of capital structure. Furthermore, we interpret our results in light of the major theories on the subject, namely the trade-off, pecking order and market-timing theories. We also note that the 2008 financial crisis did not provoke any apparent change in the behaviour of structure determinants. With this work we hope to further understand the difference between bank and market oriented economies, as well as compare the main theories on the topic of determinants of capital structure of firms, on an empirical level, and finally to analyse the impact of the 2008 financial crisis on this topic.
Keywords
Capital structure, financial leverage, Trade-off, Pecking order, market-oriented, bank-oriented.
JEL classification
G01, G14, G32iv
Resumo
A estrutura de capitais das empresas tem sido um tema amplamente discutido no mundo das finanças empresariais, nas últimas décadas. O objetivo deste trabalho é analisar como certas determinates previamente estudadas por diversos autores, quer sejam características de empresas ou características institucionais, afetam a estrutura financeira das mesmas. Realizamos uma análise multivariada com OLS usando 2 equações, de forma a considerar duas variáveis dependentes alternativas (market leverage e book
leverage). Usamos um estimador de White (diagonal) para evitar possíveis problemas de
heteroscedasticidade devido ao uso de dados em painel. A amostra inclui empresas do Reino Unido, tradicionalmente identificado como uma economia market-oriented, e a Zona Euro, considerada um conjunto de economias bank-oriented. A amostra totaliza 4337 empresas. Os resultados sugerem que não há diferenças de grande relevância entre estes 2 conjuntos, relativamente ao comportamento das determinantes da estrutura de capitais. Adicionalmente, interpretamos os nossos resultados à luz das principais teorias sobre o tema, nomeadamente a Teoria do Trade-off, da Pecking order e de market-timing. Notamos também que a crise de 2008 não provoca nenhuma mudança de relevo no comportamento das determinantes da estrutura de capitais. Com este estudo esperamos compreender melhor a diferença entre economias bank-oriented e market-oriented, assim como comparar, num nível empírico, as principais teorias no tema das determinantes da estrutura de capitais, e também analisar o impacto da crise de 2008 na perspetiva deste tema.
Palavras-chave:
Estrutura de capitais, alavancagem financeira, Trade-off, Pecking order, market-oriented,
bank-oriented.
Códigos JEL
G01, G14, G32Index of Content
Biographical note ... i Acknowledgements ... ii Abstract ... iii Resumo ... iv 1. Introduction ... 1 2. Literature review ... 42.1 Theories of Capital Structure ... 4
2.1.1 The Trade-off Theory ... 4
2.1.2 The Pecking Order Theory ... 6
2.1.3 The Market Timing Theory ... 6
2.2 Bank-oriented and market-oriented financial systems ... 7
3. Research design ... 8 3.1 Variables ... 8 3.1.1 Leverage ... 8 3.1.2 Tangibility ... 9 3.1.3 Profitability ... 9 3.1.4 Size ... 10 3.1.5 Growth ... 10
3.1.6 Non-debt tax savings ... 10
3.1.8 Market-timing ... 11
3.1.9 Industry median leverage ... 11
3.1.10 Macroeconomic conditions ... 12 3.2 Sample ... 12 3.3 Descriptive Statistics ... 13 3.4 Correlation ... 16 3.5 Methodology ... 16 4. Results ... 18
4.1 Full Period ... 18 4.2 The 2008 Financial crisis ... 22
0035. Conclusion ... 23
Index of Tables
Table 1 – Descriptive Statistics ... 14
Table 2 - Pearson correlation coefficients ... 16
Table 3 - Model estimation of Levm(i,t) by zone ... 20
1
1. Introduction
The capital structure of firms has been a widely discussed subject in the world of corporate finance and the literature on this subject has grown extensively in the last decades.
According to the seminal work of Modigliani & Miller (1958), the capital structure of a firm has no relevancy on its value, as well as on the cost of capital, provided that we consider several simplifications, among which are the absence of taxes and bankruptcy costs.
The trade-off theory postulates that a firm maximizes its value when the marginal benefit of debt equals its marginal cost (ergo the “trade-off”) and, therefore, supports the existence of an optimal capital structure. Modigliani & Miller (1963) posited that, by taking into consideration corporate taxes , debt would be relevant for the value of the firm. Miller (1977) presents the Miller equilibrium, taking into consideration more types of taxes. De Angelo & Masulis (1980) point for the importance of non-debt tax shields. Kraus & Litzenberger (1973) formally introduce the tax advantage of debt and bankruptcy costs into a state preference framework. Jensen & Meckling (1976) and Myers (1977) analyse optimal capital structure and agency costs. On an alternative point of view, Myers (1984) and Myers & Majluf (1984) hypothesize the pecking order theory: to avoid the problems brought by asymmetric information, firms should prioritize internal over external funding, and on external funding, debt is preferable to equity. We also consider one third theory, market timing: the capital structure of firms is the outcome of managers trying to time the market (Baker & Wurgler 2002).
Many studies have been conducted to assess these different theories through empirical investigation. Bayrakdaroğlu et al (2013) analyse whether firm-specific determinants in the emerging market of Turkey support the main theories on capital structure. Huang & Ritter (2005) examine time-series patterns of external financing decisions of publicly traded U.S firms, comparing the performance of the trade off, pecking order and market timing theories. In overall, researchers have been unsuccessful in isolating one theory as the correct predictor of the capital structure of firms.
2 The conception of market and bank-oriented systems considered in our work to define the countries derives from the work of Rybczynski, T. (1984). Rajan & Zingales (1995) also address the comparison between bank and market-oriented countries, claiming that they did not seem to find any systematic difference between the level of leverage in these two types of financial system. Antoniou et al (2008) conclude that the capital structure decisions of firms are influenced by their environmental and traditional settings.
In this paper, we analyse the determinants of capital structure of firms in the United Kingdom and twelve countries of the Euro Zone (namely, those who joined before 2005). The U.K. presents itself as a market-oriented economy, where firms have easier access to capital markets. On the other hand, there is the Euro Zone, which we identify as a set of bank-oriented economies. Here, financing is more commonly guaranteed through debt. Banks perform a vital role in the financing of firms, presumably more so than in the U.K. Hence, we aim to analyse if these two sample sets perform similarly, under our estimations. Moreover, we test the homogeneity of the results of the Euro zone by separating it into two sub-sets. Finally, we try to infer if the 2008 financial crisis had an impact on the role of the determinants of structure capital we analyse. We perform a multivariate analysis with OLS (ordinary least squares) using two equations, one for each of the dependent variables (market leverage and book leverage). We use a White estimator (diagonal) to avoid possible heteroscedasticity problems due to the use of panel data. For country-specific analysis, we withdraw GDP growth and credit to GDP, in order to avoid a near singular matrix. This includes the multi-variate analysis of the U.K.. Our paper contributes to the extant literature on capital structure of firms on an empirical level. Firstly, we compare two sample sets which, due to the nature of their distinct economies, could expectably present different results. Secondly, we evaluate whether there is a significant change in the behaviour of the determinants of capital structure before and after the 2008 financial crisis. Finally, our paper contributes with an updated estimation, ranging from 2005 to 2014, as well as an analysis on the behaviour of the variables we used, in light of the main theories of capital structure: the trade-off, pecking order and market timing theories. To the best of our knowledge, no work has been done with this set of specifications.
3 The results suggest that there are no major differences in these two sets, concerning the behaviour of the determinants of capital structure. Also, we note that the 2008 financial crisis did not provoke any apparent change in the behaviour of structure determinants. This paper is divided into five sections. Section 2 covers previous literature on the subject. Section 3 presents the variables used, as well as the sample, descriptive statistics and methodology. Results are evidenced on section 4. Finally, section 5 concludes.
4
2. Literature review
The literature on capital structures has, in the last decades, grown extensively. In this review, we will set our starting point with Modigliani & Miller (1958). According to their seminal work, the capital structure of a firm has no relevancy on its value, as well as the cost of capital, provided that we consider several simplifications, such as the absence of taxes and bankruptcy costs.
This conception spurred a vast literature in the following decades. Hence, we provide a summary of some of the works that followed, namely the trade-off, pecking order and market timing theories.
We also do an overview on the literature most connected to the relation between market-oriented and bank-market-oriented economies, concerning structure of capital, which we trace back to Rybczynski, T. (1984).
2.1 Theories of Capital Structure
2.1.1 The Trade-off Theory
The trade-off theory postulates that a firm maximizes its value when the marginal benefit of debt equals its marginal cost, ergo the “trade-off”. Several contributions arose concerning what can be perceived as benefit or cost of debt.
Modigliani & Miller (1963) posited that, by taking into consideration corporate taxes, debt would be relevant for the value of the firm. More specifically, an increase in debt would always result in an increase in the value of the firm, provided that debt is tax-deductible. However, if personal income taxes are considered (specifically, those concerning personal income from common stock and personal income from bonds), this might not be so. Miller (1977) took these 3 forms of taxes into consideration, creating a model known as Miller equilibrium.
Connected to the work of Miller (1977), DeAngelo & Masulis (1980) point for the importance of non-debt tax shields, such as depreciation deductions or investment tax
5 credits. They find, in their model, that there is an inverse relation between the level of debt and the level of available non-debt tax shields.
Still concerning the valuation of firms under the trade-off theory, two parameters stand out: financial distress and agency costs.
Kraus & Litzenberger (1973) formally introduce the tax advantage of debt and bankruptcy costs into a state preference framework. In their work, they state that, since the firm’s financing mix determines the states in which the firm earns its debt obligation, receives the tax savings connected to their debt financing, as well as the states in which the firm is insolvent and is thus penalized, it comes as a conclusion that these states affect, through the financing mix, the market value of the firm.
In the follow-up of this insight concerning bankruptcy costs, Titman (1984) considers the existence of indirect costs of bankruptcy, which are costs created by bankruptcy filing that affect other stakeholders than debt and equity holders. Berk et al (2010), on a theoretical paper, argue that the cost of bankruptcy borne by the employees can be an indirect cost. Indeed, they state that there is evidence that this cost is significant, and that it can be seen as a counterbalance to the tax benefits of debt.
Jensen & Meckling (1976) and Myers (1977) analyse optimal capital structure and agency costs. These costs can derive from potential conflicts between shareholders and managers, or shareholders and bondholders. As in most agency relationships, if both the agent and the principal are utility maximizers, their interests will not be totally aligned. Ergo, the principal will need to incur into certain costs to improve this alignment, thus creating
agency costs. Jensen & Meckling (1976) define agency costs as the sum of the monitoring
expeditures by the principal, the bonding expenditures by the agent and the residual loss. Mazen (2012) tests the validity of the static trade-off theory on a sample of 121 firms over a period from 1998 to 2002. The study reiterates the importance of several considerations brought by the trade-off theory. Also, this study is in line with the vast majority of papers on capital structure of firms in the previous decades (such as Bayrakdaroğlu et al (2013), Kouki & Said (2012), Correia et al. (2015), Gaud et al (2005), Frank & Goyal (2009), to name a few), in the sense that while trade-off theory does not
6 surpass other theories (such as the pecking order theory) flawlessly, its merit is repeatedly recognized.
2.1.2 The Pecking Order Theory
The Pecking Order Theory (Myers, 1984 and Myers & Majluf, 1984) hypothesizes that, under asymmetric information, equity may become underpriced. If a firm decides to finance a new project by issuing equity, it may be that, at first glance, old shareholders will be negatively affected, if the underpricing due to new equity does not compensate for the Net Present Value (hereafter NPV) of the new project. This might result in abandoning positive NPV projects. To avoid this situation, firms should prioritize internal funding and, in case of external funding, riskless debt is preferable, followed by risky debt, followed by equity. Concordantly, firms would not have a defined optimal leverage ratio.
Empirical research on this theory has not been consensual. While some provide evidence that it is a good descriptor of financial behaviour (Shyam-Sunder & Myers, 1999 and Lemmon & Zender, 2008), others arrive at a different conclusion (Leary and Roberts, 2010 and Frank & Goyal, 2009). Frank & Goyal (2009) claim that the results they achieved concerning some variables, namely tangibility, firm size and industry leverage do not easily flow from the essence of the pecking order theory.
2.1.3 The Market Timing Theory
Baker and Wurgler (2002) argued that the capital structure of firms is the outcome of the attempts of managers to time the markets. The concept is that firms will issue debt when equity is cheap (low market-to-book ratio) and issue equity when it is expensive (high market-to-book ratio). Concordantly, managers should not aim for a specific optimal capital structure: it will depend on the market conditions.
The practice of market timing is noted in the several works. Rajan and Zingales (1995) showed that leverage and the market-to-book ratio are significantly correlated. Huang and Ritter (2005) also find evidence consistent with the market timing theory: equity issues
7 increase when expected equity risk premiums are lower and market-to-book ratios are higher.
2.2 Bank-oriented and market-oriented financial systems
In our work, we define countries as bank-oriented or market-oriented. Our conception of market and bank-oriented systems derives from the work of Rybczynski, T. (1984). Bank-oriented systems are characterized by a large dependence of non-financial firms on financing through non-marketable loans provided by banks, predominantly. In a market-oriented system, on the other hand, non-financial firms are largely dependent on financing through capital markets.
Antoniou et. al. (2008) analyse how firms operating in market-oriented economies and bank-oriented economies determine their capital structure, concluding that “the capital
structure decision of a firm is not only the product of its own characteristics, but also the result of environment and traditions in which it operates”.
Rajan & Zingales (1995) also address the comparison between bank and market-oriented countries, claiming that they did not seem to find any systematic difference between the level of leverage in these two types of financial system. Furthermore, they suggest, based on their evidence, that this difference between financial systems has a bigger effect on the type of financing (private or public) than in the amount of leverage.
8
3. Research design
In this chapter we analyse the underlying research model. First, we identify the variables used in this research, as well as their adjacent hypothesis. We then follow to the presentation of the sample used. Finally, we present the econometric model to be used.
3.1 Variables
3.1.1 Leverage
Concerning the choice of our dependent variable, we had two different approaches available: book leverage and market leverage. Between these two, one major difference can be expected: book leverage can be considered as backward looking, whereas market leverage is expected to be more forward looking (Frank & Goyal, 2009). Ergo, we expect forward looking variables to predict market leverage more successfully than book leverage.
Considering book leverage, the following measures are taken into consideration: total liabilities to total assets (TL/TA), total debt to total assets (TD/TA), long-term debt to total assets (LTD/TA) and total debt to total net assets (TD/TNA). We do not use TL/TA because this ratio can be easily affected by liabilities which are merely transactional, with no financing purpose (Uddin, 2015). We could use the same train of thought to favour a ratio with long-term debt instead of total debt, since it can be considered that short term debt usually serves a transactional purpose exclusively. However, this may not be the case in many firms. Shivdasani et. al. (2015) suggest that short-term debt is often used as a bridge to long-term debt. Bevan & Danbolt (2002) achieve notoriously different results with long-term debt and total debt, suggesting that “analyses of gearing based solely upon
long-term debt provide only part of the story, and a fuller understanding of capital structure and its determinants requires a detailed analysis of all forms of corporate debt.”
Therefore, we use total debt in our analysis, with the ratio TD/TNA, where TNA equals total assets minus total liabilities plus total debt (also referred henceforth as LEVDTNASS). We favour total net assets over total assets as a denominator because the former is not affected by trade credit.
9 MV equals total assets minus book equity plus market capitalization (Gao & Zhu, 2015).
3.1.2 Tangibility
The purpose of this variable is to measure the nature of the assets of the firm. It is easily understood that tangible assets, such as property, plant and equipment (PPE), are easier to be evaluated than intangible assets. Furthermore, tangible assets make for better collateral. Considering this, we expect a positive relation between tangibility and leverage, under the trade-off theory.
However, the interpretation of this variable is quite different under the pecking order theory. A higher proportion of tangible assets should reduce information asymmetry, thus reducing the cost of equity issuances. In this case, there should be a negative relation between tangibility and leverage. However, if adverse selection concerns the assets in place of the firm, then a higher level of tangibility would only increase adverse selection, which would increase the level of debt (Frank & Goyal, 2009)
In our work, we measure tangibility with the following ratio:
𝑇𝐴𝑁𝐺𝑖,𝑡 = 𝑃𝑟𝑜𝑝𝑒𝑟𝑡𝑦, 𝑃𝑙𝑎𝑛𝑡 𝑎𝑛𝑑 𝐸𝑞𝑢𝑖𝑝𝑚𝑒𝑛𝑡𝑖,𝑡 𝑇𝑜𝑡𝑎𝑙 𝑎𝑠𝑠𝑒𝑡𝑠𝑖,𝑡
3.1.3 Profitability
Another variable that separates the trade-off and pecking order theories. In the world of the trade-off theory, profitable firms should face less financial distress, which would allow for higher leverage. Furthermore, profitable firms benefit more from the disciplinary role of debt, according to the agency theory.
According to the pecking order theory, firms should prioritize internal funding over external funding. In a sense, debt should be reckoned as a need, not a desire. It stands to reason, then, that more profitable firms would be less levered, since they have easier access to internal funding.
In our work, we interpret profitability as:
𝑃𝑅𝑂𝐹𝑖,𝑡 =
𝐸𝐵𝐼𝑇𝑖,𝑡 𝑇𝑜𝑡𝑎𝑙 𝑎𝑠𝑠𝑒𝑡𝑠𝑖,𝑡
10
3.1.4 Size
Concerning the aspect of size, larger firms, usually more diversified, should face a lesser financial distress. As time passes, they solidify their reputation in the debt markets. Considering this conception, there should be a positive relation between size and leverage, under the trade-off theory.
Under the pecking order theory, we expect a similar relation, on the same line of thought: as firms grow larger and earn a solid reputation, they have easier access to the debt market. This will make firms less likely to resort to equity issuances.
We measure firm size as follows:
𝑆𝐼𝑍𝐸𝑖,𝑡 = ln (𝑇𝑜𝑡𝑎𝑙 𝑎𝑠𝑠𝑒𝑡𝑠𝑖,𝑡)
3.1.5 Growth
Growth is another variable that sets apart the predictions of trade-off and pecking order theories. From the perspective of the trade-off theory, growth should reduce leverage. According to Frank & Goyal (2009), growth increases costs of financial distress. Indeed, growth can even be seen as manifestation of free cash flow, allowing managers to build empires.
From the perspective of the pecking order theory, there should be a positive relation between growth and leverage. Investments are costly, thus increasing the likelihood of debt financing1.
In our work, growth is measured as:
𝐺𝑅𝐴𝑖,𝑡= ln(𝑇𝑜𝑡𝑎𝑙 𝑎𝑠𝑠𝑒𝑡𝑠𝑖,𝑡) − ln(𝑇𝑜𝑡𝑎𝑙 𝑎𝑠𝑠𝑒𝑡𝑠𝑖,𝑡−1)
3.1.6 Non-debt tax savings
In the trade-off theory, tax-deductibility is certainly one of the most consensual benefits of debt. However, how important is that benefit when a firm can easily use other means
11 to achieve tax optimization? Indeed, DeAngelo & Masulis (1980) consider that non-debt tax savings (NDTS) present themselves as an alternative to tax shield interests. Under this perspective, there should be a negative relation between NDTS and leverage.
However, a different line of thought could lead to an expectation of a positive relation between these two variables: if we consider that NDTS is mostly achieved through a high level of collaterable fixed assets (Uddin, 2015), then we would return to the logic of tangibility, leading to an increase of the leverage ratio.
In our work, in accordance with Titman & Wessels (1988) and De Miguel & Pindado (2001), we use the relation of NDTS to total assets, and we define NDTS as follows:
𝑁𝐷𝑇𝑆𝑖,𝑡 = 𝐸𝐵𝐼𝑇𝑖,𝑡− 𝐼𝑛𝑡𝑒𝑟𝑒𝑠𝑡 𝑒𝑥𝑝𝑒𝑛𝑠𝑒 𝑜𝑛 𝑑𝑒𝑏𝑡𝑖,𝑡−
𝑇𝑎𝑥𝑒𝑠 𝑝𝑎𝑖𝑑𝑖,𝑡 𝑇𝑎𝑥 𝑟𝑎𝑡𝑒𝑖,𝑡
3.1.8 Market-timing
Market-timing theory suggests that firms are more prone to finance themselves through equity when their market value is high, and more prone to choose debt when their market value is low. The logic behind this line of reasoning is that a high market value might indicate an overpricing of the firm, in the eyes of managers, whereas a low market value might indicate an underpricing of the firm. Managers seize these moments, preferring equity issues, or debt, respectively.
To measure market-timing, we chose the market-to-book ratio, expressed as total assets minus book equity plus market capitalization over total assets (Gao & Zhu, 2015).
3.1.9 Industry median leverage
Industry median leverage is commonly seen, in the existing literature, as a significant variable to predict leverage. Following the reasoning of Frank & Goyal (2009), we present two explanations for the use of this variable. Firstly, industry median leverage may reflect a set of correlated, although omitted variables. Each industry has its own nature, and this may lead firms to manage their capital structure similarly. Industry median leverage may be reflecting that unique nature of each industry or, in other words, industry heterogeneity. Secondly, this variable may be, by itself, the leverage target for firms in
12 the industry.
In our work, we calculate industry median leverage (yearly) using market leverage (TD/MV). We define each industry using the sector identification of Datastream.
3.1.10 Macroeconomic conditions
In order to proxy for countries’ institutional environments, we used two macroeconomic variables, namely GDP growth and private sector debt to GDP. Concerning GDP growth, its effect on leverage is debatable: in an expansion phase, we can expect firms to perform better and achieve higher profits. On the other hand, growth opportunities should increase in this period. Trade-off and pecking-order theory do not agree on the effects of profitability and growth opportunities on leverage, so we do not set an expected sign for GDP growth. As to private sector debt to GDP, we expect a positive relation with leverage: this can be a proxy to express how bank-oriented is the economy, and it is to be expected that firms in bank-oriented countries are more prone to be more leveraged. Both variables are measured as a fraction.
3.2 Sample
All the data used in this paper comes from the Datastream database, with the exception of tax rates, GDP growth and private sector debt to GDP, which were all retrieved from the OECD database. The full sample we use consists of 4337 firms from the United Kingdom and twelve members of the Euro Zone (Austria, Belgium, Germany, Ireland, Italy, Greece, The Netherlands, France, Finland, Luxembourg, Portugal and Spain). We did not include members who joined after 2005. Furthermore, we divided our set of economies from the Eurozone into two separate subsets: Euro 4 and N. Euro 4 (Not Euro 4). In the first subset we consider 4 countries: Germany, France, Italy and Spain. We do so in order to enable an easier comparison with previous literature. In the second subset, we consider the remaining eight countries.
13 with four or more years of account data available2. Firms from the financial and insurance sectors are excluded, in line with most works on this subject. Moreover, we excluded all firms who are not presented as primary quote, major security and equity. All series retrieved from Datastream were trimmed at the 1st and 99th percentiles. Finally, all variables presented in our equations were trimmed at the 1st and 99th percentiles.
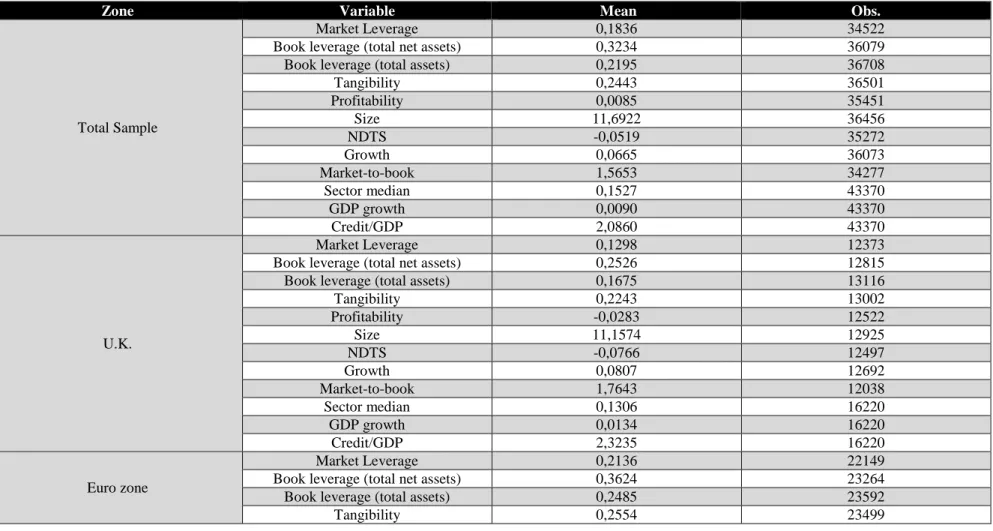
3.3 Descriptive Statistics
Table 1 provides descriptive statistics. Comparing the alternative measures of leverage, market leverage claims the lowest average values, in all sub-sets, followed by debt to total assets and debt to total net assets. This means that the market finds the book value of assets overvalued. We also find evidence that firms in the United Kingdom are, on average, less levered. This difference is in line with the work of Ramírez & Cabestre (2010). Indeed, the average market leverage of a firm in the U.K. is close to 40% less than in the Euro zone. This exacerbates the view of the U.K. as a market-oriented economy, rather than bank-oriented. Concordantly, the average of market-to-book is higher in the U.K.
Concerning the two sub-sets of the Euro zone, Euro 4 and N. Euro 4, the former appears to be less levered, although with more tangibility. On average, GDP growth was close to six times higher in Euro 4.
2 By account data we refer to all series retrieved from Datastream which were used in the making of the variables used.
14
Table 1 – Descriptive Statistics
Zone Variable Mean Obs.
Total Sample
Market Leverage 0,1836 34522
Book leverage (total net assets) 0,3234 36079
Book leverage (total assets) 0,2195 36708
Tangibility 0,2443 36501 Profitability 0,0085 35451 Size 11,6922 36456 NDTS -0,0519 35272 Growth 0,0665 36073 Market-to-book 1,5653 34277 Sector median 0,1527 43370 GDP growth 0,0090 43370 Credit/GDP 2,0860 43370 U.K. Market Leverage 0,1298 12373
Book leverage (total net assets) 0,2526 12815
Book leverage (total assets) 0,1675 13116
Tangibility 0,2243 13002 Profitability -0,0283 12522 Size 11,1574 12925 NDTS -0,0766 12497 Growth 0,0807 12692 Market-to-book 1,7643 12038 Sector median 0,1306 16220 GDP growth 0,0134 16220 Credit/GDP 2,3235 16220 Euro zone Market Leverage 0,2136 22149
Book leverage (total net assets) 0,3624 23264
Book leverage (total assets) 0,2485 23592
15
Zone Variable Mean Obs.
Profitability 0,0286 22929 Size 11,9859 23531 NDTS -0,0383 22775 Growth 0,0588 23381 Market-to-book 1,4575 22239 Sector median 0,1659 27150 GDP growth 0,0063 27150 Credit/GDP 1,9441 27150 Euro 4 Market Leverage 0,1946 15197
Book leverage (total net assets) 0,3464 15972
Book leverage (total assets) 0,2322 16255
Tangibility 0,2275 16247 Profitability 0,0273 15736 Size 11,8586 16151 NDTS -0,0425 15593 Growth 0,0662 16055 Market-to-book 1,5074 15251 Sector median 0,1622 18920 GDP growth 0,0085 18920 Credit/GDP 1,8874 18920 N.Euro 4 Market Leverage 0,2553 6952
Book leverage (total net assets) 0,3974 7292
Book leverage (total assets) 0,2846 7337
Tangibility 0,3178 7252 Profitability 0,0316 7193 Size 12,2646 7380 NDTS -0,0294 7182 Growth 0,0426 7326 Market-to-book 1,3487 6988 Sector median 0,1743 8230 GDP growth 0,0014 8230 Credit/GDP 2,0744 8230
16
3.4 Correlation
Table 2 provides information on all Pearson correlation coefficients. Tangibility presents a considerable correlation to market leverage and, to a lesser extent, book leverage (26% with the variable using total net assets). Firm size behaves similarly. Market-to-book has a correlation of -38% to market leverage. Moreover, profitability appears to be highly correlated to NDTS, with a correlation of 83%.
Table 2 - Pearson correlation coefficients
LEVM LEVDTNASS LEVDTASS TANG PROF SIZE NDTS GRA MTB MEDIAN GDPGROWTH CREDITTOGDP
LEVM 1 * * * * * * * * * * * LEVDTNASS 0.77 1.00 * * * * * * * * * * LEVDTASS 0.89 0.90 1.00 * * * * * * * * * TANG 0.40 0.26 0.36 1.00 * * * * * * * * PROF 0.02 -0.02 0.02 0.10 1.00 * * * * * * * SIZE 0.32 0.28 0.31 0.28 0.35 1.00 * * * * * * NDTS 0.09 0.00 0.05 0.11 0.83 0.30 1.00 * * * * * GRA -0.07 -0.07 -0.05 -0.02 0.20 0.04 0.21 1.00 * * * * MTB -0.38 -0.18 -0.22 -0.18 -0.13 -0.23 -0.23 0.11 1.00 * * * MEDIAN 0.43 0.27 0.35 0.37 0.12 0.28 0.14 -0.11 -0.25 1.00 * * GDPGROWTH -0.18 -0.11 -0.12 -0.05 0.06 -0.03 0.03 0.19 0.14 -0.17 1.00 * CREDITTOGDP -0.10 -0.06 -0.07 -0.04 -0.05 0.04 0.00 -0.01 0.05 -0.02 0.04 1.00
3.5 Methodology
In this paper, we perform a multivariate analysis with OLS, using two equations:
𝐿𝐸𝑉𝑀𝑖𝑡 = 𝛽0+ 𝛽1∗ 𝑃𝑅𝑂𝐹𝑖𝑡+ 𝛽2∗ 𝑇𝐴𝑁𝐺𝑖𝑡+ 𝛽3∗ 𝑆𝐼𝑍𝐸𝑖𝑡 + 𝛽4∗ 𝑁𝐷𝑇𝑆𝑖𝑡 + 𝛽5∗ 𝐺𝑅𝐴𝑖𝑡 + 𝛽6∗ 𝑀𝑇𝐵𝑖𝑡+ 𝛽7𝑀𝐸𝐷𝐼𝐴𝑁 + 𝛽8𝐺𝐷𝑃𝐺𝑅𝑂𝑊𝑇𝐻 + 𝛽9𝐶𝐶𝑅𝐸𝐷𝐼𝑇𝑇𝑂𝐺𝐷𝑃 + 𝜇𝑖+ 𝜈𝑡+ 𝜀𝑖𝑡 𝐿𝐸𝑉𝐷𝑇𝑁𝐴𝑆𝑆𝑖𝑡 = 𝛽0+ 𝛽1∗ 𝑃𝑅𝑂𝐹𝑖𝑡+ 𝛽2∗ 𝑇𝐴𝑁𝐺𝑖𝑡+ 𝛽3∗ 𝑆𝐼𝑍𝐸𝑖𝑡+ 𝛽4∗ 𝑁𝐷𝑇𝑆𝑖𝑡 + 𝛽5 ∗ 𝐺𝑅𝐴𝑖𝑡+ 𝛽6∗ 𝑀𝑇𝐵𝑖𝑡+ 𝛽7𝑀𝐸𝐷𝐼𝐴𝑁 + 𝛽8𝐺𝐷𝑃𝐺𝑅𝑂𝑊𝑇𝐻 + 𝛽9𝐶𝐶𝑅𝐸𝐷𝐼𝑇𝑇𝑂𝐺𝐷𝑃 + 𝜇𝑖+ 𝜈𝑡 + 𝜀𝑖𝑡
17 All the variables used were previously identified in section 3.1, except for the last three: 𝜇𝑖 and 𝜈𝑡 are dummy variables, incorporating cross-section and period fixed effects, respectively; 𝜀𝑖𝑡 incorporates the error term. Since we are working with panel data, we may be facing a problem of heteroscedasticity. Therefore, we use a White (1980) estimator (diagonal). For country-specific analysis, we withdraw GDP growth and credit to GDP, in order to avoid a near singular matrix. This includes the multi-variate analysis of the U.K..
18
4. Results
In this section we will present the results of our estimation. In sub-section 4.1 we will present the results for full period (2005-2014) and in 4.2 we will focus on the comparison of the results prior to and after 2008.
4.1 Full period
Results are, for the most part, convergent with previous literature.
Tangibility takes a positive sign on all sub-sets, in both models. This is in accordance with the trade-off theory. Concerning profitability, more profitable firms do tend to have less leverage, in all sub-sets, and in both models as well. In opposition to tangibility, this sign is in accordance with the pecking order theory. As to size, the sign of its respective coefficient is positive in all sub-sets, and again, in both models. Both theories predict this outcome.
Concerning NDTS, the outcome in our models is not as simple as in the former variables. If we use market leverage, we achieve a positive sign in all sub-sets, but they are only statistically significant in the full sample, the Eurozone and Euro 4. This sign is understandable if we follow the reasoning that NDTS might be majorly provoked by high tangibility, which would allow for a higher leverage ratio. Indeed, we did achieve a positive sign in the tangibility variable. However, if we use book leverage, all expected signs are negative (although without statistical significance on the Euro 4 sub-set). This would support the reasoning that NDTS are an alternative to interest tax shield, thus decreasing the relative attractiveness of debt.
Firm growth presents itself with a negative sign, if we use market leverage as the dependent variable. However, it is not statistically significant in the U.K. and N. euro 4. This is in line with the trade-off theory, suggesting that firm growth tends to reduce the leverage ratio, by provoking financial distress. If we use book leverage, however, this variable is not statistically significant in any sub-set. Indeed, this difference between the two models is to be expected: book leverage is more backward looking, and it is to be expected to perform worse with forward looking variables, such as growth opportunities.
19 What is more, the same reasoning can be used with market-to-book. If market leverage is used, the variable is always statistically significant with 99%. The sign is negative, which is in accordance with market-timing theory. However, if we use book leverage, it is not significant in the U.K nor in N. Euro 4. In the remaining sub-sets, it presents a positive sign.
As to industry median leverage, all coefficients, in both models, show that is significant at a 99% level, with a positive sign. This may hint that managers use the industry median leverage ratio as a target.
Finally, we have the macroeconomic variables, for all sub-sets excluding the U.K. The GDP growth affects leverage negatively, in both models, while domestic credit to GDP reveals a positive sign for most sub-sets, except for N. Euro 4 in the market leverage model and Euro 4 in the book leverage model. However, this variable is not statistically significant in the Euro zone and Euro 4 (market leverage model) and the Euro zone and its two sub-sets (book leverage model).
20
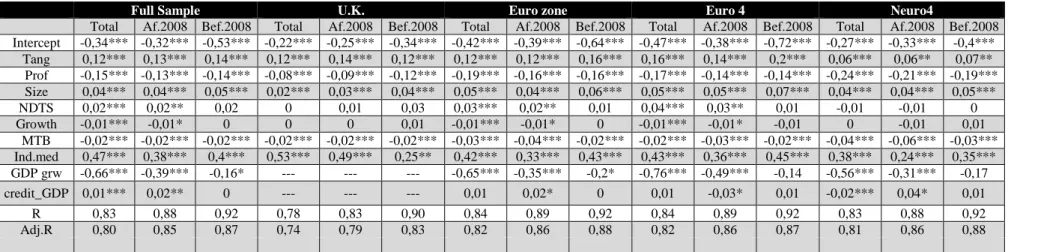
Table 3 - Model estimation of Levm(i,t) by zone
Full Sample U.K. Euro zone Euro 4 Neuro4
Total Af.2008 Bef.2008 Total Af.2008 Bef.2008 Total Af.2008 Bef.2008 Total Af.2008 Bef.2008 Total Af.2008 Bef.2008
Intercept -0,34*** -0,32*** -0,53*** -0,22*** -0,25*** -0,34*** -0,42*** -0,39*** -0,64*** -0,47*** -0,38*** -0,72*** -0,27*** -0,33*** -0,4*** Tang 0,12*** 0,13*** 0,14*** 0,12*** 0,14*** 0,12*** 0,12*** 0,12*** 0,16*** 0,16*** 0,14*** 0,2*** 0,06*** 0,06** 0,07** Prof -0,15*** -0,13*** -0,14*** -0,08*** -0,09*** -0,12*** -0,19*** -0,16*** -0,16*** -0,17*** -0,14*** -0,14*** -0,24*** -0,21*** -0,19*** Size 0,04*** 0,04*** 0,05*** 0,02*** 0,03*** 0,04*** 0,05*** 0,04*** 0,06*** 0,05*** 0,05*** 0,07*** 0,04*** 0,04*** 0,05*** NDTS 0,02*** 0,02** 0,02 0 0,01 0,03 0,03*** 0,02** 0,01 0,04*** 0,03** 0,01 -0,01 -0,01 0 Growth -0,01*** -0,01* 0 0 0 0,01 -0,01*** -0,01* 0 -0,01*** -0,01* -0,01 0 -0,01 0,01 MTB -0,02*** -0,02*** -0,02*** -0,02*** -0,02*** -0,02*** -0,03*** -0,04*** -0,02*** -0,02*** -0,03*** -0,02*** -0,04*** -0,06*** -0,03*** Ind.med 0,47*** 0,38*** 0,4*** 0,53*** 0,49*** 0,25** 0,42*** 0,33*** 0,43*** 0,43*** 0,36*** 0,45*** 0,38*** 0,24*** 0,35*** GDP grw -0,66*** -0,39*** -0,16* --- --- --- -0,65*** -0,35*** -0,2* -0,76*** -0,49*** -0,14 -0,56*** -0,31*** -0,17 credit_GDP 0,01*** 0,02** 0 --- --- --- 0,01 0,02* 0 0,01 -0,03* 0,01 -0,02*** 0,04* 0,01 R 0,83 0,88 0,92 0,78 0,83 0,90 0,84 0,89 0,92 0,84 0,89 0,92 0,83 0,88 0,92 Adj.R 0,80 0,85 0,87 0,74 0,79 0,83 0,82 0,86 0,88 0,82 0,86 0,87 0,81 0,86 0,88
Results of OLS estimations of panel data regression, with cross-section and period fixed effects. Dependent variable is Levm(i,t) = Total debt / (total assets minus book
equity plus market capitalization); TANG = Property, plant and equipment / Total assets; Prof = EBIT / Total assets; Size = ln(Total assets); NDTS = EBIT – Interest expense on debt – (Taxes paid / Tax rate); Growth = ln(Total assets i,t) – ln( total assets i,t-1); MTB = (Total assets – book equity + market capitalization) / total assets;
Ind.med = industry median leverage; GDP grw = growth of GDP (OECD). Credit_GDP = private sector debt to GDP (OECD); Full sample = United Kingdom, Austria, Belgium, Germany, Ireland, Italy, Greece, The Netherlands, France, Finland, Luxembourg, Portugal and Spain; U.K. = United Kingdom; Euro zone = Full sample minus United Kingdom; Euro 4 = Germany, France, Italy and Spain; Neuro4= Euro zone minus Euro 4.
The sample can be either including all observations from 2005-2014 (Total), 2005-2007 (Bef.2008) or 2008-2014 (Af.2008). *,** and *** denote coefficients significance at 90%, 95% and 99% level, respectively.
21
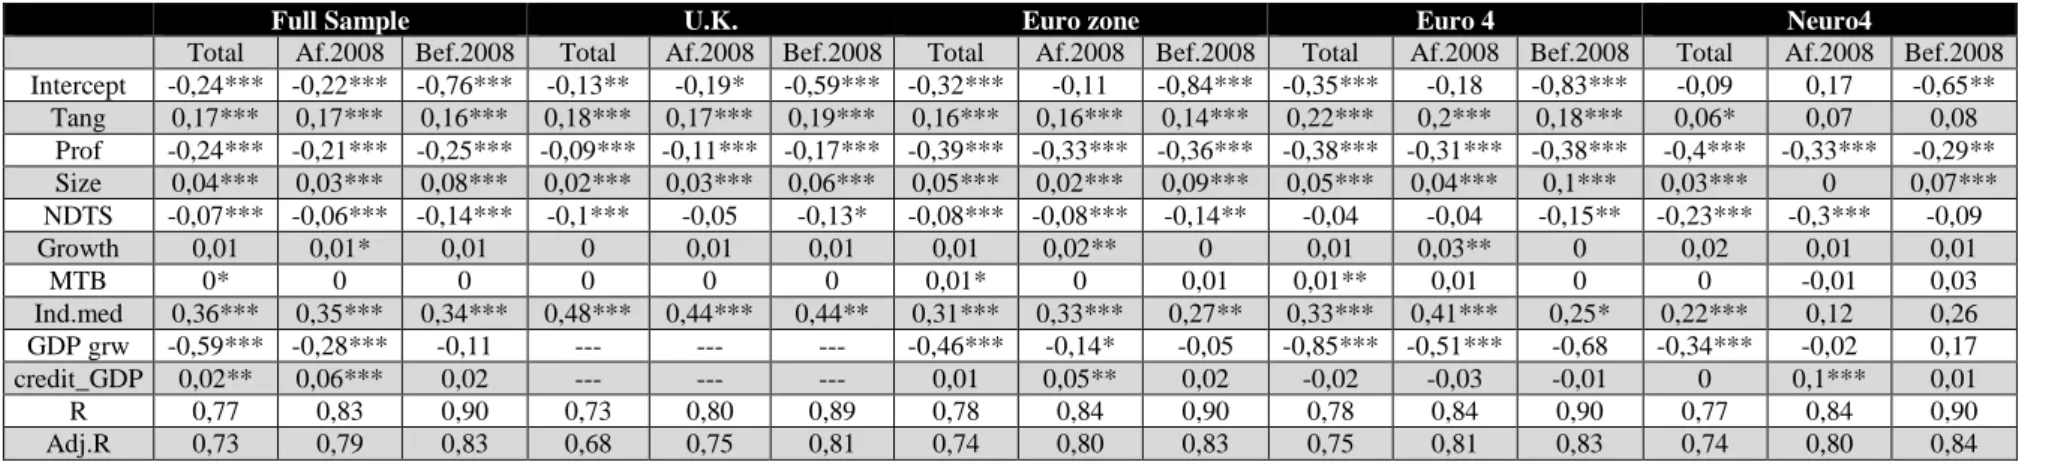
Table 4 - Model estimation of Levdtnass(i,t) by zone
Results of OLS estimations of panel data regression, with cross-section and period fixed effects. Dependent variable is Levdtnass(i,t) = Total debt / (Total assets – total
liabilities + total debt); TANG = Property, plant and equipment / Total assets; Prof = EBIT / Total assets; Size = ln(Total assets); NDTS = EBIT – Interest expense on debt – (Taxes paid / Tax rate); Growth = ln(Total assets i,t) – ln( total assets i,t-1); MTB = (Total assets – book equity + market capitalization) / total assets; Ind.med =
industry median leverage; GDP grw = growth of GDP (OECD). Credit_GDP = private sector debt to GDP (OECD); Full sample = United Kingdom, Austria, Belgium, Germany, Ireland, Italy, Greece, The Netherlands, France, Finland, Luxembourg, Portugal and Spain; U.K. = United Kingdom; Euro zone = Full sample minus United Kingdom; Euro 4 = Germany, France, Italy and Spain; Neuro4= Euro zone minus Euro 4.
The sample can be either including all observations from 2005-2014 (Total), 2005-2007 (Bef.2008) or 2008-2014 (Af.2008). *,** and *** denote coefficients significance at 90%, 95% and 99% level, respectively.
Full Sample U.K. Euro zone Euro 4 Neuro4
Total Af.2008 Bef.2008 Total Af.2008 Bef.2008 Total Af.2008 Bef.2008 Total Af.2008 Bef.2008 Total Af.2008 Bef.2008
Intercept -0,24*** -0,22*** -0,76*** -0,13** -0,19* -0,59*** -0,32*** -0,11 -0,84*** -0,35*** -0,18 -0,83*** -0,09 0,17 -0,65** Tang 0,17*** 0,17*** 0,16*** 0,18*** 0,17*** 0,19*** 0,16*** 0,16*** 0,14*** 0,22*** 0,2*** 0,18*** 0,06* 0,07 0,08 Prof -0,24*** -0,21*** -0,25*** -0,09*** -0,11*** -0,17*** -0,39*** -0,33*** -0,36*** -0,38*** -0,31*** -0,38*** -0,4*** -0,33*** -0,29** Size 0,04*** 0,03*** 0,08*** 0,02*** 0,03*** 0,06*** 0,05*** 0,02*** 0,09*** 0,05*** 0,04*** 0,1*** 0,03*** 0 0,07*** NDTS -0,07*** -0,06*** -0,14*** -0,1*** -0,05 -0,13* -0,08*** -0,08*** -0,14** -0,04 -0,04 -0,15** -0,23*** -0,3*** -0,09 Growth 0,01 0,01* 0,01 0 0,01 0,01 0,01 0,02** 0 0,01 0,03** 0 0,02 0,01 0,01 MTB 0* 0 0 0 0 0 0,01* 0 0,01 0,01** 0,01 0 0 -0,01 0,03 Ind.med 0,36*** 0,35*** 0,34*** 0,48*** 0,44*** 0,44** 0,31*** 0,33*** 0,27** 0,33*** 0,41*** 0,25* 0,22*** 0,12 0,26 GDP grw -0,59*** -0,28*** -0,11 --- --- --- -0,46*** -0,14* -0,05 -0,85*** -0,51*** -0,68 -0,34*** -0,02 0,17 credit_GDP 0,02** 0,06*** 0,02 --- --- --- 0,01 0,05** 0,02 -0,02 -0,03 -0,01 0 0,1*** 0,01 R 0,77 0,83 0,90 0,73 0,80 0,89 0,78 0,84 0,90 0,78 0,84 0,90 0,77 0,84 0,90 Adj.R 0,73 0,79 0,83 0,68 0,75 0,81 0,74 0,80 0,83 0,75 0,81 0,83 0,74 0,80 0,84
22
4.2 The 2008 Financial crisis
Until now we have presented an estimation over the period between 2005 and 2014. However, we should consider the possibility that the 2008 financial crisis might have altered the impact of the determinants of capital structure of firms. Ergo, we separated our sample in two subsets: 2005 to 2007 and 2008 to 2014. The methodology used is the same as in the full period sample estimation
Results show that, in general, signals hold in both samples, in comparison with 2005-2014, as can be attested in tables 3 and 4. However, some determinants lose statistical significance. Growth, before 2008, is not statistically significance (at 90%), in any of the set of economies analysed. The same goes for credit_GDP. On the other hand, Prof maintains a negative coefficient and statistically significant on all accounts. A similar outcome can be seen for Tang (+), Size (+) and Ind.med (+), with the exception of the N. euro 4 subset when the dependable variable is book leverage - in this case most determinants lose statistical significance.
We conclude that, overall, the 2008 financial crisis did not change how firms manage their leverage ratio.
23
5. Conclusion
This paper studies the determinants of capital structure in firms from the Euro Zone and the United Kingdom. The main objective is to determine whether there are quantifiable differences in the impact that certain variables have in capital structure. The United Kingdom is traditionally seen as a market-oriented economy, whereas the Euro Zone presents itself as a group of several bank-oriented economies. Understandably, this could result in different approaches, concerning capital structure. Moreover, we evaluate the results by comparing them with the outcomes predicted by different theories of capital structure, namely the trade-off, pecking order and market-timing theories. Our results show that these 2 sets are more similar than what could be expected, performing very similarly under our estimations.
Furthermore, we notice that when we used book leverage as the dependent variable, instead of market leverage, variables which are commonly seen as forward looking (such as growth opportunities and market-to-book ratio) did not perform so well.
Finally, we divided our sample into 2 separate periods, 2005 to 2007 and 2008 to 2014. The purpose of this is to isolate the period prior to the financial crisis and the period after it. Our results show that, in general, there are no relevant differences when we separate our sample into these 2 time periods.
Concerning how the major capital structure theories fared, we conclude the following: trade-off theory predicted correctly that higher tangibility or firm growth result in a higher leverage ratio. However, it failed to predict the sign of the coefficient of profitability. This prediction conflicted with pecking order theory, which predicted right: higher profitability results in lower leverage. As to size, both theories succeeded: bigger firms result in a higher leverage ratio. Finally, NDTS and market-to-book ratio achieved different signs on our two estimations. If we consider market leverage as our dependent variable, NDTS provides a positive sign, whereas market-to-book affects leverage negatively. If we instead consider book leverage, NDTS provides a negative sign, while market-to-book influences leverage positively. Market timing theory predicts a negative relation between market-to-book and leverage ratio.
In summary, concerning the determinants of capital structure of firms, our work showed that: market-oriented economies might be more similar to bank-oriented economies than
24 what could be expected; considering 2 sub-sets inside the Euro Zone, this monetary area showed remarkable harmonization; concerning the 2008 financial crisis, there was no noticeable change in the determinants of the capital structure of firms.
Regarding future research, we emphasize the merit of incorporating adjustment costs in the analysis, as well as broadening the sample, taking into consideration more market-oriented countries and the most recent members of the Euro Zone.
25
References
Antoniou, A., Guney, Y., & Paudyal, K. (2008). The Determinants of Capital Structure: Capital Market-Oriented versus Bank-Oriented Institutions. Journal of Financial and
Quantitative Analysis, 59-92.
Baker, M., & Wurgler, J. (2002). Market timing and capital structure. The journal of
finance, 57(1), 1-32.
Bayrakdaroglu, A., Ege, I., & Yazici, N. (2013). A panel data analysis of capital structure determinants: empirical results from Turkish capital market. International Journal of
Economics and Finance, 5(4), p131.
Beattie, V., Goodacre, A., & Thomson, S. J. (2006). Corporate financing decisions: UK survey evidence. Journal of Business Finance & Accounting,33(9‐10), 1402-1434.
Bergloef, E. (1999). 'Capital Structure as a Mechanism of Control: a Comparison of Financial Systems', in Masahiko Aoki, Bo Gustafsson and Oliver E. Williamson (eds), The Firm as a Nexus of Treaties, Part IV, Chapter 11, London: Sage Publications, 237-62. INTERNATIONAL LIBRARY OF CRITICAL WRITINGS IN ECONOMICS, 106, 242-267.
Berk, J. B., Stanton, R., & Zechner, J. (2010). Human capital, bankruptcy, and capital structure. The Journal of Finance, 65(3), 891-926.
Bevan, A. A., & Danbolt, J. (2002). Capital structure and its determinants in the UK-a decompositional analysis. Applied Financial Economics, 12(3), 159-170.
Brandão, E. (2012). Finanças, 7. ª Edição. Elísio Brandão
Correia, A. M. F. A., Cerqueira, A. M., Brandão, E. (2015). Determinants of Corporate
Capital Structure: Evidence from Non-financial Listed French Firms(No. 566).
Universidade do Porto, Faculdade de Economia do Porto.
De Miguel, A., & Pindado, J. (2001). Determinants of capital structure: new evidence from Spanish panel data. Journal of corporate finance, 7(1), 77-99.
DeAngelo, H., & Masulis, R. W. (1980). Optimal capital structure under corporate and personal taxation. Journal of financial economics, 8(1), 3-29.
26 Fama, E. F., & French, K. R. (2002). Testing trade‐off and pecking order predictions about dividends and debt. Review of financial studies, 15(1), 1-33.
Frank, M. Z., & Goyal, V. K. (2004). The effect of market conditions on capital structure adjustment. Finance Research Letters, 1(1), 47-55.
Frank, M. Z., & Goyal, V. K. (2009). Capital structure decisions: which factors are reliably important?. Financial management, 38(1), 1-37.
Gao, W., & Zhu, F. (2015). Information asymmetry and capital structure around the world. Pacific-Basin Finance Journal, 32, 131-159.
Gaud, P., Jani, E., Hoesli, M., & Bender, A. (2005). The capital structure of Swiss companies: an empirical analysis using dynamic panel data. European Financial
Management, 11(1), 51-69.
Hillier, D., Grinblatt, M., & Titman, S. (2011). Financial markets and corporate
strategy (No. 2nd Eu). McGraw-Hill.
Huang, R., & Ritter, J. R. (2005). Testing the market timing theory of capital structure. Journal of Financial and Quantitative Analysis, 1, 221-246.
Jensen, M. C. (1986). Agency cost of free cash flow, corporate finance, and takeovers. Corporate Finance, and Takeovers. American Economic Review,76(2).
Jensen, M. C., & Meckling, W. H. (1976). Theory of the firm: Managerial behaviour, agency costs and ownership structure. Journal of financial economics, 3(4), 305-360.
Kahl, M., Shivdasani, A., & Wang, Y. (2015). Short‐Term Debt as Bridge Financing: Evidence from the Commercial Paper Market. The Journal of Finance, 70(1), 211-255.
Kouki, M., & Said, H. B. (2012). Capital Structure Determinants: New Evidence from French Panel Data. International Journal of Business and Management,7(1), 214.
Kraus, A., & Litzenberger, R. H. (1973). A state‐preference model of optimal financial leverage. The journal of finance, 28(4), 911-922.
Leary, M. T., & Roberts, M. R. (2010). The pecking order, debt capacity, and information asymmetry. Journal of Financial Economics, 95(3), 332-355.
27 Lemmon, M. L., Roberts, M. R., & Zender, J. F. (2008). Back to the beginning: persistence and the cross‐section of corporate capital structure. The Journal of
Finance, 63(4), 1575-1608.
Mazen, G. (2012). French firm's financing choices: towards a reconciliation of the static trade-off theory and the pecking order theory?. International Journal of Financial
Research, 3(1), 57.
Miller, M. H. (1977). DEBT AND TAXES*. the Journal of Finance, 32(2), 261-275.
Modigliani, F., & Miller, M. H. (1958). The cost of capital, corporation finance and the theory of investment. The American economic review, 261-297.
Modigliani, F., & Miller, M. H. (1963). Corporate income taxes and the cost of capital: a correction. The American economic review, 433-443.
Myers, S. C. (1977). Determinants of corporate borrowing. Journal of financial
economics, 5(2), 147-175
Myers, S. C. (1984). The capital structure puzzle. The journal of finance, 39(3), 574-592.
Myers, S. C., & Majluf, N. S. (1984). Corporate financing and investment decisions when firms have information that investors do not have. Journal of financial economics, 13(2), 187-221.
Rajan, R. G., & Zingales, L. (1995). What do we know about capital structure? Some evidence from international data. The journal of Finance, 50(5), 1421-1460.
Ramirez, M. A. A., & Cabestre, F. J. R. (2010). Capital Structure: Some Evidence From European Panel Data.
Rybczynski, T. (1984). Industrial Finance System in Europe, U.S. and Japan. Journal of
Economic Behaviour and Organization, 5, 275-286.
Shyam-Sunder, L., & Myers, S. C. (1999). Testing static tradeoff against pecking order models of capital structure. Journal of financial economics,51(2), 219-244.
Titman, S. (1984). The effect of capital structure on a firm's liquidation decision. Journal
28 Titman, S., & Wessels, R. (1988). The determinants of capital structure choice.The
Journal of finance, 43(1), 1-19.
Uddin, N. (2015). Determinants of corporate capital structure: A theoretical integration and some empirical evidences. International Journal of Economics and Finance, 7(7), 254.
Vergas, N., Cerqueira, A., & Brandão, E. (2015). The determinants of the capital
structure of listed on stock market non-financial firms: Evidence for Portugal (No. 555).