pca
Rita Barata Garcia
Bachelor Degree in Applied Biology
Yeast cell wall hydrolysis by enzymes for the production
of value-added products
Dissertation to obtain the Degree of Master in
Biotechnology
Supervisor: Dr. Dina Krüger, Project Manager in
R&D department at Ohly GmbH
Jury:
President: Professor Dr. Pedro Miguel Ribeiro Viana Baptista Examiner: Professor Dr. Maria Filomena Andrade de Freitas Liaison: Professor Dr. Pedro Miguel Calado Simões
2017 Y ea st cel l w all h y d ro lys is by enz y me s fo r t h e p ro d u ctio n of v alue -add ed p ro d u cts Rit a Ba rata G a rci a
i
Rita Barata Garcia
Bachelor Degree in Applied BiologyYeast cell wall hydrolysis by enzymes for the production of
value-added products
Dissertation to obtain the Degree of Master in Biotechnology
Supervisor: Dr. Dina Krüger, Project Manager in R&D department at Ohly GmbH
Jury:
President: Professor Dr. Pedro Miguel Ribeiro Viana Baptista Examiner: Professor Dr. Maria Filomena Andrade de Freitas Liaison: Professor Dr. Pedro Miguel Calado Simões
ii
Yeast cell wall hydrolysis by enzymes for the production of value-added products
“Copyright” Rita Barata Garcia
Faculty of Sciences and Technology NOVA University of Lisbon
The Faculty of Sciences and Technology and the NOVA University of Lisbon have the perpetual and geographically unlimited right to file and publish this dissertation both in printed and digital form, or by any other known and unknown means and to publish it in scientific repositories and to allow its copy and non- commercial distribution with educational and research purposes, as long as the credit is given to the author and publisher.
iii
Acknowledgements
Over the last year, I have passed for unique experience which helped me grown intellectually and professionally. However, if not for the help of some people, all this would not be possible. I would like to thank all the people who contributed in some way to the work described in this thesis.
First, I want to thanks my supervisor Dr. Dina Krüger and Dr. Mariet van der Werf for had received me and for the opportunity they have given me to work in this project at Ohly GmbH.
Dear Dr. Dina Krüger my sincere thanks for the immediate help provided in every question, problem and for the great scientific support during this thesis.
I am also grateful for all helpful suggestions, comments and scientific knowledge of Dr. Mariet van der Werf, Dr. Chung-Wai Chiu, Dr. Kerstin Burseg and Dr. Thibault Godard.
A very special thanks to Dr. Mazen Rizk, Veronika Achberger, Venkatesh Jayaraman, Irina Reimer, Janna Rinckens, Nina Miheu and Ana Gameiro for all the help in the lab as well as with technical questions.
My warmest thanks to Petra Priebe for the support during chromatographic analysis and the evaluation of data.
I would like to thanks to all panellists for the time, participation and suggestions in the sensorial analysis.
v Abstract
Yeast cell walls (YCW) are side-stream products from yeast extract production and are usually lower value products. In the first part of the project, we explored the potential of enzymes in converting Ohly’s YCW into high(er) added value new products. Accordingly, a better understanding of the enzymatic hydrolysis of YCW and the subsequent hydrolysates properties was obtained.
An enzymatic assay was developed in lab-scale by standardizing process conditions such as enzyme dosage, temperature, pH and reaction time. Over 56 Carbohydrases and 4 Phospholipases were tested. The hydrolysates characterization was done by visual, analytical and chemical analysis. The following Ohly starting materials were used: YCW from the S. cerevisiae (hydrolysis process) and from C. utilis a.k.a Torula (Prime process). Hydrolysates were clustered using a PCA into 6 groups based on their profile of: free reducing sugars, free glucose, and free mannose. From all enzymes the most interesting were AO3, NC5, SN7, SN8, ET4, NC1 and ST3.
In the second part of the project, the Torula YCW were used as a starting material for the production of a new yeast extract due to their high protein content. An enzymatic assay was performed by standardizing process conditions such as enzyme dosage, combination of different enzymes, temperature, pH and reaction time. The hydrolysates characterization was done by analytical and chemical analysis, and by sensory analysis. Proteolytic enzymes (9), Carbohydrases (2), Phospholipases (4) from various manufactures were tested. Results show that the optimal recipe to produce a new yeast extract from Torula YCW consisted of: 0.5% NS11 + 0.5% EN1 + 0.1% AO5 as the best combination when tested in an application (vegetable broth).
Keywords: Hydrolysed yeast cell wall; Torula yeast cell wall; Enzymatic hydrolysis; Umami; Yeast extract; Molecular weight.
vii Resumo
A Parede celular (PC) de levedura, fração insolúvel, é obtida como subproduto da produção de extrato de levedura de S. cerevisae ou C. utilis, sendo considerada um produto de baixo valor económico.
Na primeira parte, foi explorado o potencial de conversão da PC em hidrolisados com alto valor económico. Nesse sentido, foi realizado um ensaio enzimático a nível laboratorial. Condições como a dosagem da enzima, temperatura, pH e tempo de reação foram estabelecidos para estudar o potencial de conversão enzimática de 60 enzimas. Como material de partida foi utilizada a PC da
S. cerevisiae obtida por um processo de hidrólise e a PC da C. utilis ou Torula, obtida através de um
processo Prime. Posteriormente, os hidrolisados foram caraterizados por análise visual, analítica e química, tendo sido ainda categorizados em 6 grupos de acordo com uma Análise de Componentes Principais. Com este ensaio, foi possível perceber o perfil das diferentes enzimas na conversão da PC das eveduras e consequentemente as propriedades dos hidrolisados obtidos. As enzimas consideradas mais interessantes durante este estudo foram AO3, NC5, SN7, SN8, ET4, NC1 e ST3. Na segunda parte, foi usado como material de partida para o desenvolvimento de um novo extrato de levedura a PC da Torula, devido ao alto conteúdo de proteínas ainda existente na PC. Assim, foi realizado um ensaio com diferentes enzimas, tendo sido estabelecidas as condições do processo como dosagem e combinação das mesmas, temperatura, pH, e tempo de reação. No final os hidrolisados foram caraterizados por análise analítica, química e sensorial. Após análise das possíveis combinações de enzimas para produção do novo extrato de levedura a partir da PC da Torula, verificou-se que a mais interessante seria 0.5% NS11 + 0.5% EN1 + 0.1% AO5, tendo sido testada em aplicação (caldo de vegetais).
Palavras-chave: Parede celular da levedura hidrolisada; Parede celular da Torula; Hidrólise enzimática; Umami; Extrato de levedura; Peso molecular.
ix
Table of contents
List of figures ... xiii
List of tables ... xvii
List of Abbreviations and Symbols ... xix
Ohly GmbH ... xxiii
1 Theoretical part ... 1
1.1 Food Yeasts... 1
1.2 Characteristics of Food Yeasts (Candida utilis and Saccharomyces cerevisiae) ... 3
1.3 Yeast cell wall of Ascomycetous Yeasts ... 6
1.3.1 Mannoproteins ... 8
1.3.2 β-glucans ... 9
1.3.3 Chitin ... 12
1.4 Production of yeast extracts and yeast cell wall ... 12
1.4.1 Autolysis Process ... 13
1.4.2 Plasmolysis Process ... 14
1.4.3 Hydrolysis Process ... 14
1.5 Proteins, peptides and free amino acids ... 15
1.6 Nucleic Acids and nucleotides ... 17
1.7 Yeast extract ... 17
1.7.1 Yeast Extracts Containing 5’-Nucleotides ... 18
1.7.2 Flavour enhancing 5’-Nucleotides ... 20
1.8 Sensory perception ... 21
1.9 Enzymes ... 22
1.9.1 Carbohydrate-active enzymes (CAZymes) ... 22
1.9.2 Phospholipases ... 23 1.9.3 Proteases ... 23 1.9.4 Nucleolytic enzymes ... 24 1.10 Ohly’s Products ... 25 1.10.1 SYEAA ... 25 1.10.2 TYC ... 25 1.10.3 TYCW ... 25
x
1.10.4 YEHP ... 25
2 Enzyme screening of YCW ... 27
2.1 Introduction ... 27
2.2 Material and methods ... 28
2.2.1 Material ... 28
2.2.2 Methods ... 30
2.2.3 Principal Component Analysis ... 37
2.3 Results ... 38
2.3.1 Yeast cell wall composition ... 38
2.3.2 Viscosity analysis ... 39
2.3.2 Turbidity ... 41
2.3.3 Free sugar release and molecular weight analysis ... 42
2.3.4 Solubilisation and phase separation ... 45
2.3.5 Principal Component Analysis (PCA) ... 46
2.4 Discussion and Conclusion ... 51
2.4.1 Yeast cell wall composition ... 51
2.4.2 Hydrolysates analytical characterization and release of sugars ... 51
2.4.3 Enzymatic activity ... 55
3 Yeast Extract from TYCW ... 61
3.1 Introduction ... 61
3.2 Material and Methods ... 62
3.2.1 Material ... 62
3.2.2 Methods ... 63
3.3 Results ... 70
3.3.1 Hydrolysates analytical characterization ... 70
3.3.2 Hydrolysates Sensory Characterization in application ... 76
3.3.3 Dry matter of starting material ... 79
3.3.4 AO5 dosage ... 82
3.3.5 Supplementation with TYC ... 86
3.4 Discussion ... 93
3.4.1 Effects of different cell wall lysis enzymes and protease treatment on the recovery of solid and protein ... 93
xi
3.4.2 Optimization of nuclease treatment ... 95
3.4.3 Sensorial analysis: hydrolysates in application ... 96
3.4.4 Final yeast extract... 99
4 Bibliography ... 101
Appendix 1. Calibration curve for 1% of glucose stock solution, used to determine reducing sugars. ... 111
Appendix 2. Viscosity, µ [mPa.s] of hydrolysates of enzymatic screening at 25 °C for 24h of reaction time. ... 112
Appendix 3.Turbidity at 3h expressed as absorbance values at λ=660 nm, for 0.2% of dry matter of supernatant (P-N1 and P-SN1); for 0.8% of DM (DS3, DC1, NC3 and ST1) and for 1% of DM for the remaining enzymes. ... 114
Appendix 4.Turbidity at 24h, expressed as absorbance values at λ=660 nm, for 1 % of dry matter of supernatant. ... 116
Appendix 5. Graphics of reducing sugars, free glucose and free mannose content over 3h of reaction time. ... 118
Appendix 6. Graphics of reducing sugars, free glucose and free mannose content over 24h of reaction time. ... 120
Appendix 7. Average of solubilisation profile for hydrolysates. ... 122
Appendix 8. PCA analysis for HYCW ... 126
Appendix 9. PCA analysis for TYCW ... 128
Appendix 10. Reactions performed to achieve the new yeast extract ... 130
Appendix 11. Questionnaires for sensory tests (QDA analysis) ... 132
Appendix 12. Ranking test for umami intensity ... 133
Appendix 13. Hydrolysates DM, yield and protein per DM. ... 134
Appendix 14. Standard deviation values for hydrolysates DM %, yield % per DM, protein % per DM and sensory analysis. ... 136
Appendix 15. List with information about screened enzymes, including classes, enzyme code, cleaving properties, microorganism, pH and temperature range, activity and GMO. ... 138
xiii
List of figures
Figure 1.1 Diagrammatic representation of a section through a typical budding yeast cell [3]. ... 1
Figure 1.2 Exemplary microscopic photography of C. utilis cells cultured in yeast extract-peptone-dextrose (scale: 45 µm) [10]. ... 3
Figure 1.3 Exemplary scanning electron microscope photography of S. cerevisiae in several stages of budding (scale: 10 µm) [2]. ... 3
Figure 1.4 (A to G) Overview of the stages of spore and ascus formation of S. cerevisiae. In presence of a nonfermentable carbon source, diploid cells searching for nitrogen will undergo meiosis. During the second meiotic division, the spindle pole bodies (SPBs) (indicated as τ ), which are surrounded by the nuclear envelope (shown in red), develop sites for formation of prospore membranes (shown in green). As meiosis II goes on, the prospore membranes expand and immerse the forming haploid nuclei. After nuclear division, each prospore membrane closes on itself to capture a haploid nucleus in two distinct membranes. Spore wall synthesis then begins in the lumen between the two prospore membrane-derived membranes. After spore wall synthesis is complete, the mother cell breakdowns to form the ascus [22]. ... 5
Figure 1.5 Structure of the cell wall of S. cerevisiae [29]. ... 7
Figure 1.6 Struture of mannose units linked through α-(1,6) bonds (edited) [33]. ... 8
Figure 1.7 Chemical structure of the cell wall glucan [38]. ... 9
Figure 1.8 Example of a molecular structure of a soluble yeast β-glucan [42]. ... 10
Figure 1.9 Example of a molecular structure of an insoluble yeast β-glucan [42]. ... 11
Figure 1.10 Chemical structure of the cell wall chitin [38]. ... 12
Figure 1.11 Scheme with the process to produce yeast extract and yeast cell wall (adapted) [6, 8, 21]. ... 13
Figure 1.12 General structure of a ribonucleotide. OH at the 2´position is deoxygenated and the phosphate group is attached to the 5’position [64]. ... 17
Figure 1.13 Backbone of RNA [54]. ... 18
Figure 1.14 The ribonucleoties, AMP, GMP, UMP and CMP. All abbreviations assume that the phosphate group is at the 5' position [64]. ... 18
Figure 1.15 The production of 5'-IMP and 5'GMP by RNA hydrolysis (simplified) [68]. ... 19
Figure 1.16 Schematic structure of T1R1-T1R3 heterodimer [69]. ... 21
Figure 1.17 Sites of phospholipid hydrolysis by PLD, PLC, PLA2 and PLA1. The two fatty acyl chains may vary. X represents the common head group of phospholipids [78]. ... 23
Figure 1.18 Classification and characterization of nucleolytic enzymes [adapted 66]. ... 24
Figure 2.1 (a) and (b) change in viscosity (µ, [mPa.s]) of hydrolysates from enzymatic screening with HYCW and TYCW, at 25°C for 24h of reaction time. The viscosity of HYCW hydrolysates ranges from 21 to 496 mPa.s and of TYCW hydrolysates ranges from 72 to 1200mPa.s. ... 40
Figure 2.2 Action of various enzymes that have a high sugar and glucose release, using HYCW (H) and TYCW (T) as starting materials for 24h over reaction time. ... 42
xiv
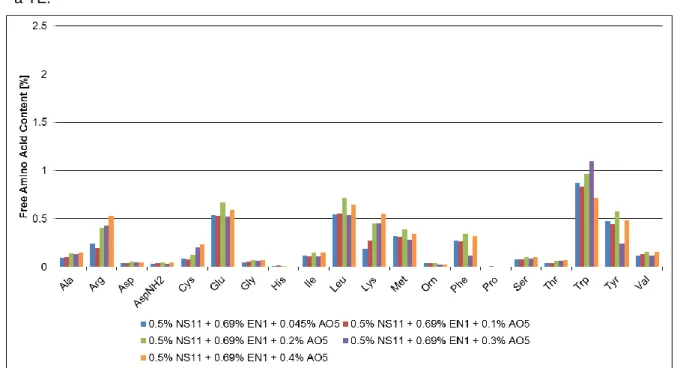
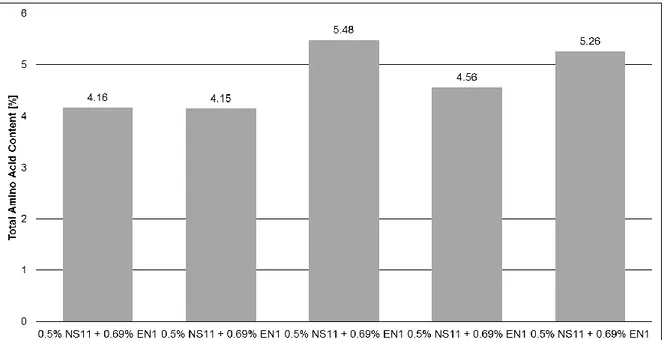
Figure 2.3 Action of 3 laminaripentaose hydrolases, that have high reducing sugar release, but no glucose release, using HYCW (H) and TYCW (T) as starting materials over 24h of reaction time. ... 43 Figure 2.4 Separation of 8 different molar mass reference standards: (red) Pullulan 200kDa ; (black) Pullulan 100kDa; (pink) Pullulan 50kDa; (brown) Pullulan 20kDa, (green) Pullulan 10kDa (cyan) Pullulan 5kDa; following the β-(1,3)-laminaripentose and β-(1,3)-laminarbiose (0.99-0.0022kDa). .. 43 Figure 2.5 MW distribution of different hydrolysates using HYCW as starting material. The different substances in the standard solution have different retention times. Most of the detected peaks of the sample are recognized, only a few minor peaks are not identified. These are secondary components and impurities which are a part of the sample matrix. MW distribution of different hydrolysates (black) which is the Control; (red) AE3 resulted in a mid-yield of RS and glucose; (pink) SN7 resulted in a high yield of RS and free glucose; (cyan) NC1 resulted in a high yield of RS and no free glucose; (green) P-SN1 resulted in a low yield of RS and free glucose. ... 44 Figure 2.6 MW distribution of different hydrolysates using TYCW as starting material. The different substances in the standard solution have different retention times. Most of the detected peaks of the sample are recognized, only a few minor peaks are not identified. These are secondary components and impurities which are a part of the sample matrix. MW distribution of different hydrolysates (black) which is the Control; (red) SN7 resulted in a high yield of RS and free glucose; (pink) NC1 resulted in a high yield of RS and no free glucose; (cyan) P-N1 resulted in a low yield of RS and free glucose; (green) AE3 resulted in a mid yield of RS and glucose release. ... 44 Figure 2.7 Autoscaling representation of global clusters of HYCW (a) induced by the first two principal components (b) in variables factor map (PCA). ... 47 Figure 2.8 Autoscaling representation of global clusters of TYCW (a) induced by the first two principal components (b) in variables factor map (PCA). ... 49 Figure 2.9 Conversion of 3,5-dinitrosalicyclic acid (yellow) into 3-amino-5-nitrosalicyclic acid (red-brown) by oxidation of glucose into gluconic acid as example of RS [107]. ... 56 Figure 3.1 Free AA content for different concentrations of AO5 wit a starting DM= ~21%. ... 70 Figure 3.2 Total AA content for different concentrations of AO5 wit a starting DM= ~21%. ... 71 Figure 3.3 Free AA content for different concentrations of EN1 + AO5, P-N1 and P-NE1, with a starting DM= ~21%. ... 71 Figure 3.4 Total AA content for different concentrations of EN1 + AO5, P-N1 and P-NE1, with a starting DM= ~21%. ... 72 Figure 3.5 MW distribution of different hydrolysates using TYCW as starting material. The different substances in the standard solution have different retention times. The Profile is similar for all enzyme combinations. MW distribution of different hydrolysates suggests a higher content of soluble material. (black) which is the control (no enzyme added); (red) 0.5% NS11 + 0.5% AO1; (blue) 0.5% NS11 + 0.5% SN9; (green) 0.5% NS11 + 0.5% SN10; (pink) 0.5% NS11 + 0.5% AO4; (cyan) 0.5% NS11 + 0.69% EN1 + 0.4% AO5; (grey) 0.5% NS11 + 0.69% EN1 + 0.3% AO5 and (navy blue) 0.5% NS11 + 0.69% EN1 + 0.2% AO5. ... 73 Figure 3.6 MW analysis of proteins for the sample named control, with a starting DM= ~17%. ... 73
xv
Figure 3.7 MW analysis of peptides for the sample 0.5% NS11 + 0.69 % EN1 + 0.2% AO5, with a starting DM=~17%. ... 74 Figure 3.8 MW analysis of peptides for the sample 0.5% NS11 + 0.5% NS12 with a starting DM=~21%. ... 75 Figure 3.9 5’mononucleotides content as % of total dry solids for different concentrations of AO5, with a starting DM= 17%. ... 76 Figure 3.10 QDA analysis: sensory evaluations of TYCW possible YEs vs control (vegetable broth). Graphical display of sensory attributes based on QDA result. The scores of taste were 3-7, which represent intensities of none, weak, middle, strong and very strong. ... 77 Figure 3.11 QDA analysis: sensory evaluations of TYCW with 0.2% AO5 vs other hydrolysates with 1% of GMP. Graphical display of sensory attributes based on QDA result. The scores of taste were 3-7, which represent intensities of none, weak, middle, strong and very strong... 78 Figure 3.12 5’mononucleotides content as % of total dry solids for different percentages of starting DM (around 17%, 15%, 13% and 11%). ... 80 Figure 3.13 QDA analysis: sensory evaluations of TYCW with different starting DM (11%, 13%, 15% and 17%). Graphical display of sensory attributes based on QDA result. The scores of taste were 3-7, which represent intensities of none, weak, middle, strong and very strong. ... 81 Figure 3.14 5’mononucleotides content as % of total dry solids for different concentrations of AO5, with a starting DM= ~11%. ... 83 Figure 3.15 QDA analysis: sensory evaluations of hydrolysates with different concentrations of AO5. Graphical display of sensory attributes based on QDA result. The scores of taste were 3-7, which represent intensities of none, weak, middle, strong and very strong. ... 84 Figure 3.16 5’mononucleotides content as % of total dry solids for the possible final yeast extract (0.5% NS11 + 0.5% EN1 + 0.1% AO5), with a starting DM=~11%. ... 85 Figure 3.17 5’mononucleotides content as % of total dry solids for different dosages of TYC. ... 86 Figure 3.18 Free AA content for different concentrations of TYC and also AO5, with a starting DM= ~11%. ... 87 Figure 3.19 Total AA content for different concentrations of TYC and also AO5, with a starting DM= ~11%. ... 87 Figure 3.20 QDA analysis: sensory evaluations of hydrolysates with different concentrations of TYC vs the one with 0.1% (w/w) AO5. Graphical display of sensory attributes based on QDA result. The scores of taste were 3-7, which represent intensities of none, weak, middle, strong and very strong. ... 88 Figure 3.21 Ranking test for umami intensiy, comparing differents hydrolysates as % of total dry solids... 89 Figure 3.22 Ranking test for umami intensity, comparing hyrolysates with different concentrations of TYC as % of total dry solids. ... 90 Figure 3.23 Ranking test for umami intensiy, comparing differentes hydrolysates as % of total dry solids... 91
xvii
List of tables
Table 1.1 Principal industrial yeasts and their applications [8]. ... 2
Table 1.2 Average composition (as % dry matter) of C. utilis and S. cerevisiae [15, 21]. ... 4
Table 1.3 Some essential amino acids composition of different food yeast species [8, 21]. ... 4
Table 1.4 Macromolecules of the cell wall of S. cerevisiae [12, 24, 25]. ... 7
Table 1.5 Peptides reported to have umami taste [60, 61]. ... 16
Table 2.1 List of equipment for analytical methods. ... 28
Table 2.2 List of material for analytical methods. ... 29
Table 2.3 List of reagents for analytical methods. ... 29
Table 2.4 Table with the volumes needed to prepare the calibration curve from 1% (w/v) of a D-Glucose stock solution... 31
Table 2.5 Table with the volumes needed to prepare the calibration curve from a standard stock solution of 2.3g/L α-D-glucose. ... 32
Table 2.6 Procedure for D-glucose measurement. ... 33
Table 2.7 Procedure for D-mannose measurement. ... 35
Table 2.8 Conditions for MW analysis. ... 37
Table 2.9 YCW components as % (w/w). ... 38
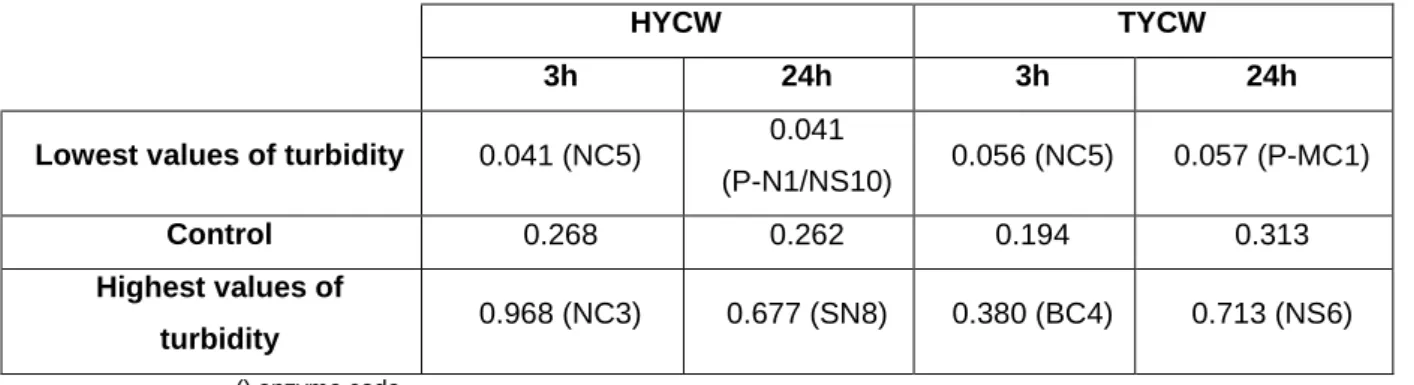
Table 2.10 Turbidity range values of hydrolysates from enzymatic screening with HYCW and TYCW for 3h and 24h of reaction time at λ= 660nm. ... 41
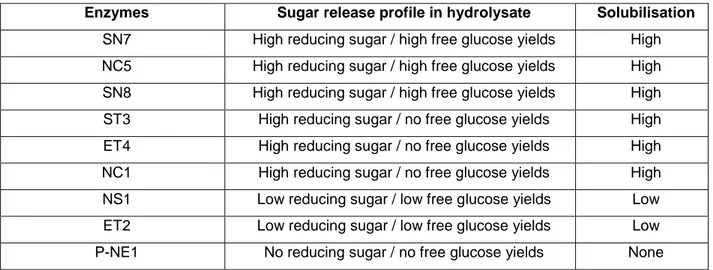
Table 2.11 Sugar release profile of selected few samples that exhibit different solubilisation rates. . 45
Table 2.12 Lipids distribution on CW of S. cerevisiae and C. utilis expressed as percentage of the total lipids [90]. ... 51
Table 3.1 List of equipment for analytical methods. ... 62
Table 3.2 List of material for analytical methods. ... 62
Table 3.3 List of reagents for analytical methods. ... 63
Table 3.4 Reactions performed for TYCW with ~11% dry matter. ... 64
Table 3.5 Protein standards (Sigma Aldrich, USA). ... 65
Table 3.6 Conditions for MW analysis. ... 65
Table 3.7 Eluent and standards used in nucleotide analysis. ... 67
Table 3.8 Hydrolysates characterization for different starting dry matter. ... 79
Table 3.9 Hydrolysates characterization for a starting material with ~11% DM. ... 82
Table 3.10 Hydrolysates (0.5% NS11 + 0.5% EN1 + 0.1% AO5) average characterization for TYCW with ~11% DM. ... 85
Table 3.11 Samples whose rank sums differ by more than LSD rank= 8.8 are significantly different at the α=0.05 (1: 0.5% NS11 + 0.69% EN1 + 0.05% AO5 per DM; 2: control; 3: 0.5% NS11 + 0.69% EN1 + 0.1% AO5 per DM; 4: 12% TYC + TYCW (0.5% NS11 + 0.69% EN1) per DM; 5: 24% TYC + TYCW (0.5% NS11 + 0.69% EN1) per DM. ... 89 Table 3.12 Samples whose rank sums differ by more than LSD rank= 9.8 are significantly different at the α=0.05 (1: control; 2: 5% TYC + TYCW (0.5% NS11 + 0.69% EN1) per DM; 3: 2% TYC + TYCW
xviii
(0.5% NS11 + 0.69% EN1) per DM; 4: 9% TYC + TYCW (0.5% NS11 + 0.69% EN1) per DM; 5: 12% TYC + TYCW (0.5% NS11 + 0.69% EN1) per DM. ... 90 Table 3.13 Samples whose rank sums differ by more than LSD rank= 9.8 are significantly different at the α=0.05 (1: control; 2: 7% TYC + TYCW (0.5% NS11 + 0.69% EN1) per DM; 3: 9% TYC + TYCW (0.5% NS11 + 0.69% EN1) per DM; 4: 0.5% NS11 + 0.69% EN1 + 0.1% AO5 per DM; 5: 12% TYC + TYCW (0.5% NS11 + 0.69% EN1) per DM. ... 92
xix
List of Abbreviations and Symbols
A - adenine AA - amino acids a.k.a. - also known as Ala - alanine
AMP - adenylate (adenosine 5'-monophosphate) Arg - arginine
ASL- alkali sensitive linkage Asp - aspartic acid
AspNH2 - asparagine
ATP - adenosine triphosphate
BLAST - basic local alignment search tool C - cytosine
CAZyme - carbohydrate-active enzyme CMP - cytidylate (cytidine 5' monophosphate) CW - cell wall
CWP - cell wall proteins Cys - cysteine
DB - degree of branching DM - dry matter
DNA - desoxyribonucleic acid DNS - 3,5-dinitrosalicylic acid DP - degree of polymerization FDA - food and drug administration EC - enzyme commission number e.g. - for example
G - guanine
G-6-P - glucose-6-phosphate
G6P-DH - glucose-6-phosphate dehydrogenase GHs - glycoside hydrolases
GlcNAc - N-Acetylglucosamine Glu - glutamic acid
Gly - glycine
GMO - genetically modified organism
GMP - guanylate (guanosine 5'-monophosphate) GOD - glucose oxidase
GPCRs - G protein coupled receptors GPI - glycosylphosphatidylinositol GRAS - generally recognized as safe GTs - glycosyltransferases
xx His - histidine
HK - hexokinase
HPAE - high performance anion-exchange chromatography HPLC - high performance liquid chromatography
HYCW - hydrolysed yeast cell wall i.e. - that is
Ile - isoleucine
IMP - inosine monophosphate IP3 - inositol-1,4,5-triphosphate
RI - refractive index detector
IUPAC - international union of pure and applied chemistry LDL - low-density lipoprotein
Leu - leucine
LPHase - laminaripentaose-producing β-(1,3)-glucanase LSD - least significant difference
Lys - lysine
M-6-P - mannose-6-phosphate Met - methionine
mGluR - metabotropic glutamate receptor MOS - mannanoligosaccharides
mRNA - messenger ribonucleic acid MSG - mono sodium glutamate MW - molecular weight
NAD - nicotinamide-adenine dinucleotide
NADP - nicotinamide adenine dinucleotide phosphate OD - optical density
Orn - ornithine PC - parede celular
PCA - principal component analysis Pir - proteins with internal repeats PGI - phosphoglucose isomerase PLs - polysaccharide lyases Phe - phenylalanine
PMI - phosphomannose isomerase PO4 - phosphate
Pro - proline QC - quality control
QDA - quantitative descriptive analysis RNA - ribonucleic acid
xxi SCP - single cell protein
SEC - size exclusion chromatography SEM - scanning electron microscope Ser - serine
SN - supernatant
SPB - spindle pole bodies
SYEAA - standard yeast extract with high content in free amino acids T - thymine
Thr - threonine
tRNA - transfer ribonucleic acid Trp - tryptophan
TYC - Torula yeast cell TYCW - Torula yeast cell Wall Tyr - tyrosine
U - uracyl
UDP - uridine diphosphate
UMP - uridylate (uridine 5' monophosphate) Val - valine
VFM - Venus flytrap module
w/v - solute’s weight per total solution’s volume w/w - solute’s weight per total solution’s weight YCW - yeast cell wall
YE - yeast extract
YEHP - yeast extract with high content of peptides YEHS - yeast extract high on salt content
xxiii
Ohly GmbH
Ohly GmbH is one of the world's leading suppliers of yeasts extracts, yeast based flavours and specialty powders for food, fermentation, nutrition and animal feed markets [1].
Ohly’s history goes back to 1836 with “Heinrich Helbing Korn Distillery", founded by Heinrich Helbing in Hamburg (Germany). At the time the company was producing yeast and spirits for the local market. In the mid 1930’s, Götz Ohly was the first person to develop yeast extracts and a few years later, in 1961, the company was named Deutsche Hefewerke GmbH [1].
In 1994, Burns Philp, started a collaboration between Provesta Corporation in Hutchinson (US) and Deutsche Hefewerke GmbH in Hamburg (Germany). In 2004, ABF Ingredients bought parts of the Burns Philp group and, in 2007 these two companies started to operate under the well-established brand Ohly to better correspond to market needs. In 2011, Ohly acquired Bakon Yeast Inc. located in Rhinelander, Wisconsin (USA), which is a manufacturer of Torula yeast based savoury ingredients for the food industry [1].
Nowadays, Ohly operates three plants, two in the United States and one in Germany. In Hamburg, Germany, Ohly produces yeast derivatives based on S. cerevisiae and starter cultures. The site in Hutchinson, Minnesota, is specialised in the continuous fermentation of C. utilis. In Boyceville, Wisconsin, US a variety of Torula, brewer’s and baker’s yeast extracts and specialty powders for food are manufactured [1].
1
1
Theoretical part
1.1 Food Yeasts
In biological terms, yeasts belong to Eukarya domain which are defined by their enclosed nucleus with a double DNA strand. They have multiple organelles specialized to that species outside of the nucleus, such as ribosomes, endoplasmic reticulum, Golgi body, etc. (Figure 1.1) [2, 3]. Yeasts are part of Fungi Kindgom which are known for non-vascular and heterotrophic1 species [2].
Yeasts are unicellular, however some species may turn into multicellular through the formation of strings of connected budding cells (pseudohyphae or false hyphae). Yeasts can display both asexual and sexual stages in their life cycle. The asexual stage of given yeast is called the anamorph, while the sexual stage is the teleomorph. Most yeasts reproduce asexually by mitosis, and some of them do so by an asymmetric division called budding [4].
Figure 1.1 Diagrammatic representation of a section through a typical budding yeast cell [3].
Yeasts are a rich source of protein and B-complex vitamins, thus they have been used as a complementary protein source in fish diet, as supplement in animals feed to compensate for the amino acid (AA) and vitamin deficiencies of cereals, they can be used as substitute for soybean oil in diets for fowl, being considered a natural and cheaper dietary supplement [5]. According to the International Union of Pure and Applied Chemistry (IUPAC) “Food yeast is a yeast that has been
killed, and dried; it should have no diastase activity, and has not been submitted to any extraction process or received any additive”[6].
1
"Heterotrophs obtain organic material by the second major mode of nutrition. Unable to make their own food,
2
From the industrial viewpoint, there are three main genera of interest, the Saccharomyces,
Candida and Kluyveromyces [7, 8]. In Table 1.1 the principal industrial yeasts and their applications
are represented [8].
Table 1.1 Principal industrial yeasts and their applications [8].
Yeast species Products/applications
Saccharomyces cerevisiae Bread-type products, beer brewing, wine making, distilled beverages, ethanol, cider, food yeast, feed yeast, yeast-derived products (autolysates, hydrolysates, protein, biochemicals), invertase
Saccharomyces uvarum Beer brewing
Saccharomyces saké Sake brewing
Saccharomyces bayanus Sparkling wines
Saccharomyces lactis Lactase
Kluyveromyces fragilis Food yeast, feed yeast, ethanol
Candida utilis Food yeast, nucleic acids, feed yeast
Candida tropicalis Food yeast, feed yeast
Candida pseudotropicalis Food yeast, feed yeast
Candida lipolytica Feed yeast
Yeasts are quantitatively and economically the most important group of microorganisms exploited by humans [7]. The global yeast market reached US$ 5.9 billion in 2013. It is projected to reach US$ 9.2 billion by 2019.The total global production of yeasts is in excess of three million tonnes. Annual European production of yeast is now 900.000 tones, of which over 60% is consumed in the European Union. In 2012 the global market for products manufactured from yeast, such as yeast extract and yeast β-glucan, was valued at US$ 550 million [9].
3
Figure 1.3 Exemplary scanning electron microscope photography of S. cerevisiae in several stages of budding (scale: 10 µm) [2].
Figure 1.2 Exemplary
microscopic
photography of C. utilis cells cultured in
yeast
extract-peptone-dextrose (scale: 45 µm) [10].
1.2 Characteristics of Food Yeasts (Candida utilis and
Saccharomyces cerevisiae)
Candida utilis (Henneberg) Lodder & Kreger-van Rij (1947), a.k.a
Torula (Figure 1.2), had been proposed as the asexual state of Lindnera
jadinii (A. & R. Sartory, Weill & J. Meyer) Kurtzman, Robnett &
Basehoar-Powers (2008) because of phenotypic similarities. DNA re-association studies demonstrated that both species share ~85% common base sequences. These data, which were confirmed by Manachini (1979), show that C. utilis is the anamorphic state of L. jadinii [11, 12].
The growth of C. utilis is barely affected by extremes in pH, and being Crabtree-negative it does not produce ethanol in aerated cultures, which limits growth in other yeast species [13]. C. utilis also is known for assimilate carbohydrates, alcohols, organic acids, and hydrocarbons. This offers an opportunity for various waste materials, such as molasses and vinasse, wood hydrolysates, waste sulfite liquors, starch and lignincellulose wastes to be used as medium for growing yeasts. The use of waste materials not only reduces the cost of yeast biomass production but also empowers their economic utilization [11, 13]. Subsequently, C. utilis is used as a food yeast to produce single-cell protein (SCP) of high quality from cheap biomass; is also used as a source of diverse endogenous products such as glutathione, biotin, glucomannan, L-phenylacetylcarbinoll, RNA, NAD and several enzymes, including invertase [13]. C. utilis is characterized by high respiratory activity, high protein and also carbohydrates content (Table 1.2) and good AA profile (Table 1.3) [11, 13, 14].
Saccharomyces cerevisiae Meyen ex E. C. Hansen (1883) (Figure
1.3) is the main yeast exploited in biotechnology worldwide, due largely to its unique physiology and associated to many food fermentations and other industrial processes (e.g. foods and beverages, alcohol fermentation, vaccines, and therapeutic proteins) [12, 15, 16, 17]. Other long-standing industrial processes involving S. cerevisiae are production of fuel ethanol, SCP, feeds and fodder, yeast extract (YE), industrial enzymes and small molecular weight (MW) metabolites [12, 18]. It was the first eukaryote to be sequenced, which has flashed a whole new era developing genomics tools, e.g., genome sequencing, transcriptional profiling, metabolomics, carbon flux estimations, proteomics, etc.
[16, 17]. In Genus, Saccharomyces vegetative cells may be globose, ovoid, ellipsoidal, or elongate and usually they are in pairs or in small clusters. All species have a strongly fermentative as well as a
4
respiratory metabolism and nitrate is not utilized [7, 19]. Strains of S. cerevisiae are unable to use lysine as a nitrogen source and they have a high tolerance to SO2 and ethanol [20].
Table 1.2 has an average composition of S. cerevisiae, showing a considerable amount of proteins and carbohydrates, some lipids and ash. The essential free AA are shown on Table 1.3 [8, 15, 21].
Due to S. cerevisiae long history of state use and consumption, and lack of production of toxins, most strains have been considered as generally recognized as safe (GRAS) for use in foods and as a production organism of native and recombinant products [12]. C. utilis was also approved by FDA (Food and Drug Administration) as safe for consumption and added to the GRAS list [11, 13].
Table 1.2 Average composition (as % dry matter) of C. utilis and S. cerevisiae [15, 21].
Component (%) C. utilis S. cerevisiae
Kjeldahl protein (Nx6.25) 45-47 37-40
Carbohydrates 32-38 35-40
Lipids 1-2 4-5
Ash 8-10 4.5-7.5
Table 1.3 Some essential amino acids composition of different food yeast species [8, 21].
Amino acid Content in yeast (g/16 g N)
S. cerevisiae from molasses C. utilis from molasses
Lysine 8-2 10-7 Valine 5-5 5-7 Leucine 7-9 8-1 Isoleucine 5-5 7-3 Threonine 4-8 4-8 Methionine 2-5 1-4 Phenylalanine 4-5 4-1 Tryptophan 1-2 0-5 Cystine 1-6 0-3 Histidine 4-0 2-8 Tyrosine 5-0 1-4 Argiinine 5-0 4-7
Metabolic functions have been relating to the ultrastructure and chemical composition of the yeast cell. Moreover, the morphology exhibited by a particular yeast is directly associated with its asexual reproduction mechanism [7]. Therefore, S. cerevisiae and C. utilis are part of the phylum
5
Ascomycota, which is known for forming ascospores [12, 18, 22]. Ascospores are usually found in groups of four or eight spores within the ascus (a single mother cell) which the plural is asci (Figure 1.4 show us an overview of the stages of spore and ascus formation of S. cerevisiae). These spores are formed as a means of packaging postmeiotic nuclei. Accordingly, they represent the “gametic” stage of the life cycle. The conception of these specialized cells requires a cell division mechanism distinct from that used during vegetative growth of fungal cells [22]. In L. jadinii case, one to four hat-shaped ascospores in unconjugated deliquescent asci are formed. It can be produced an occasional pseudohyphae which may be highly branched and true hyphae are not produced. As it was mentioned before C. utilis is the asexual state of the L. jadinii. The asexual reproduction takes place by means of conidia (singular conidium), spores cut off by septa at the ends of modified hyphae called conidiophores, which in C. utilis case the modified structure can be the pseudohyphae [23, 12].
Figure 1.4 (A to G) Overview of the stages of spore and ascus formation of S. cerevisiae. In
presence of a nonfermentable carbon source, diploid cells searching for nitrogen will undergo meiosis. During the second meiotic division, the spindle pole bodies (SPBs) (indicated as τ ), which are surrounded by the nuclear envelope (shown in red), develop sites for formation of prospore membranes (shown in green). As meiosis II goes on, the prospore membranes expand and immerse the forming haploid nuclei. After nuclear division, each prospore membrane closes on itself to capture a haploid nucleus in two distinct membranes. Spore wall synthesis then begins in the lumen between the two prospore membrane-derived membranes. After spore wall synthesis is complete, the mother cell breakdowns to form the ascus [22].
6
1.3 Yeast cell wall of Ascomycetous Yeasts
The yeast cell wall (YCW) plays an important role in structure, maintenance and in morphogenesis of yeast. The cell wall (CW) protects the cell against physical damage, degradation by foreign proteins and dehydration [12, 24]. In S. cerevisiae it has been estimated that about 1200 of its 6000 genes directly or indirectly affect CW formation [12].
With the increasing number of fully sequenced fungal genomes, it becomes clear that phylogenetically distinct fungi share many CW genes. For example, the S. cerevisiae gene FKS1 encodes a multi-spanning membrane protein that is catalytically active in the synthesis of β-(1,3)-glucan, and the gene GAS1 encodes a plasma membrane bound transglucosylase, which is can elongate β-(1,3)-glucan and may associated with connecting chains that emerge from the plasma membrane to the existing β-(1,3)-glucan network. Some studies with basic local alignment search tool (BLAST), which compares nucleotide or proteins sequences to sequence databases and calculates the statistical significance, have shown that ascomycetous yeasts such as Candida species (e.g. C. utilis) contain proteins homologous to Fks1p and Gas1p. This strongly suggests that the CW of ascomycetous fungi contain a similar β-(1,3)-glucan with S. cerevisiae [12]. The CW model of S. cerevisiae may well be an accurate model for most or all ascomycetous yeasts, particularly those that lack β-(1,3)-glucan in their walls [12, 24]. As the molecular architecture of CW of S. cerevisiae has been extensively studied, during this review we will be based on S. cerevisiae to explain CW dynamics, assuming that both C. utilis and S. cerevisiae have a similar CW.
The YCW represents 10 to 30 % of the dry weight of yeast cell biomass and is mostly composed of polysaccharides (~ 85 %), proteins (~15 %) and lipids. The structure of the YCW (Figure 1.5) consists of two layers, an outer layer of mannoproteins (30–55 % of the CW) and an inner layer of carbohydrate polymer β-(1,3)-glucan (30–55 %). The CW is also composed of β-(1,6)-glucan (5–10 %) and chitin (1 and 2 %) of the total composition of the CW (Table 1.4) [24-27]. The CW of C. utilis is also mainly composed of glucan (~50%) and proteins with various degrees of glycosylation (~40%), less than 5% of CW is composed by chitin [28].
7
Figure 1.5 Structure of the cell wall of S. cerevisiae [29].
Table 1.4 Macromolecules of the cell wall of S. cerevisiae [12, 24, 25].
Macromolecules Wall dry weight (%) Mean of DP (kDa) Branching
Mannoprotein 30-50 200 (Highly variable) Highly
branched β-(1,6)-glucan 5-10 24 (150) Highly branched β-(1,3)-glucan 30-55 240 (1500) Moderated branched Chitin 1-2 25 (190) Linear
The cell wall components are presented in the order in which they are found in the cell wall from the outside to the inside. DP, degree of polymerization.
This network is held together by hydrogen bonds between laterally associated β-(1,3)-glucan chains and by proteins with internal repeats (Pir) CW proteins. The β-(1,3)-glucan chains are extended at its outside with β-(1,6)-glucan chains, which are connected to a glycosylphosphatidylinositol anchor (GPI)-dependent mannoprotein. Most cell wall proteins (CWPs)
8
are GPI-CWPs and indirectly linked to the β-(1,3)-glucan chains. The proteins can be specifically released from the CW by using HF-pyridine, which cleaves the phosphodiester bond in the GPI remnant. Furthermore, some proteins as the Pir-CWPs are directly linked to the β-(1,3)-glucan chains through an ester linkage between specific glutamine (Gln) units and a glucosyl hydroxyl group. These proteins are termed ASL (alkali-sensitive linkage)-CWPs. The ASL-CWPs appear be uniformly distributed throughout the inner skeletal layer, while GPI-CWPs are mainly found in the outer layer of the wall, linked through covalent bonds [12, 24, 30].
1.3.1 Mannoproteins
Linked to the CW polysaccharides are a diverse set of mannoproteins that collectively form yeast mannan highly branched. Mannan can define morphology and stability of the cell and determine its ability to communicate with others cells [31]. Yeast mannan (Figure 1.6) is usually made of monosaccharides of α-D-mannose linked to the proteins by or O-glycosidic bonds. N-glycosylated proteins receive an oligosaccharide through an N-glycosidic bond between a GlcNAc and an asparagine (Asn) unit, forming a highly branched structure containing as many as 200 mannose residues of shorter chains of α-(1,2) residues, terminating in α-(1,3)-linked mannose residues, attached to a structure of α-(1,6)-linked mannose chain made of 50 mannose units. Whereas O-mannoslyated proteins accept short mannose chains onto the hydroxyl side chains of serine (Ser) or threonine (Thr) units through an α-mannosyl bond [24, 27, 30, 32].
9
As a prebiotic2, mannanoligosaccharides (MOS) can bind to pathogenic bacteria in the intestinal tract, preventing them from binding to and colonizing the intestinal wall, and then carry the bacteria out of the body. Combinations of prebiotic and probiotic3 activity are reported to have shown greater benefits than either on its own in animals [9, 34, 35]. Benefits comprise reduction in the occurrences of diarrhoea, constipation and bowel cancer, stimulation of the immune system, reduction in serum cholesterol levels, and enhanced nutrient uptake [34].
1.3.2
β-glucans
β-glucans of the YCW are composed of glucose residues held together by β-(1,3)- and β-(1,6)-bounds and covalently linked to the other wall components (Figure 1.7), forming a skeletal inner layer which is moderately branched [36].
The β-(1,3)-glucan chain has a degree of polymerization (DP) of ~1500 glucose monomers and ~40-50 glucose residues involved in branching through their C6-atom. Accordingly, β-(1,3)-glucan has several non-reducing ends allowing it to function as acceptor for β-(1,6)-β-(1,3)-glucan and chitin. When chitin is attached to β- (1,3)-glucan, β-(1,3)-glucan becomes insoluble in alkali, explaining the presence of alkali-soluble and alkali-insoluble β-(1,3)-glucan in the CW [24, 27, 37]. β-(1,3)-glucan chains belong to the so-called hollow helix family, i.e., they have a shape comparable to a flexible wire string that can exist in various states of extension. This property explains the elasticity and tensile strength of CW [24].
β-(1,6)-glucan is a highly branched, water-soluble polymer consisting on average of about ~130-140 glucose monomers. It is used in the CW to connect GPI-dependent CW proteins to the β-(1,3)-glucan network. It may also function as acceptor site for chitin, particularly in case of CW stress [24, 37].
Figure 1.7 Chemical structure of the cell wall glucan [38].
2 “Prebiotic are food ingredients that selectively stimulate the growth and activities of specific bacteria in the
gastrointestinal tract, usually bifidobacteria and lactobacilli” [35].
3 “Probiotic are defined, cultured strains of lactic acid bacteria, which have been isolated from human intestinal
10
The molecular structure, DP, degree of branching (DB), MW, the polymer charge and/or solution conformation (triple helix, single helix or random coil conformation) and polysaccharides solubility of the yeast wall define the functional properties of β-D-(1,3)-glucans [40, 41].
β-(1,3)- and β-(1,6)-bonds are usually known for building insoluble structures. They stimulate the immune system, by activating first of all macrophages4. They also stimulate the skin cell response to combat free radicals and protect against the environmental pollution, significantly delaying aging process, and act as anti-inflammatory. A lower DB and lower DP are characterised by better solubility (Figure 1.8) [42].
Figure 1.8 Example of a molecular structure of a soluble yeast β-glucan [42].
It is believed that insoluble β-glucans have a DP higher than 100. Generally insoluble or slightly soluble glucans contain very long, multi-branched side chains (Figure 1.9). MW of β-glucans obtained from several sources differs within a wide range of values from 2 kDa to 40000 kDa. From a technological point of view, β-glucans with high MW (> 3000 kDa) are characterised by high viscosity, i. e., the viscosity is directly proportional to the quantified MW. The ones that have low MW (about 9 kDa) usually constitute gels [42, 43]. Fractions with a MW between 100 to 200 kDa which exhibit a single and/or triple helix conformations have shown high biological activity, whereas a fraction from the same source with a low MW (5 to 10 kDa) have shown a limited activity. Accordingly, β-glucans which have the same MW and distinct conformation present different biological activity [41, 44].
4
Macrophages are a type of white blood cell which play an important role in the initiation, maintenance, and resolution of an inflammation.
11
Figure 1.9 Example of a molecular structure of an insoluble yeast β-glucan [42].
Hydrolysed β-glucans are soluble, but not very viscous and normally do not constitute gels. Procedures such as enzymatic digestion or chemical methods leading to the hydrolysis of long-chain β-glucans, allow to lower the degree of depolymerisation and their particle mass in relation to native form, which simultaneously increases their solubility and lowers viscosity in liquids. There is also research published showing that viscosity of β-glucans depends on the degree of purification during their isolation [41-45].
Besides all the functional properties already mentioned, β-glucans exhibit more properties including therapeutic, pharmaceutical, cosmetic, food, and other industries. They can stimulate antimicrobial and anti-inflammatory activities, decrease the fraction of LDL (low-density lipoprotein) cholesterol, exhibit anticancer, antimutagenic, and antioxidant properties and promote wound healing. They can also act as emulsifiers, gelling agents, or as water- and fat-binding substitutes of fat, prebiotics, and film-forming substances. In wine industry, β-glucans are known for absorb mycotoxins [40, 34]
12
1.3.3 Chitin
Chitin (Figure 1.10) is an insoluble linear polymer made of β-1,4-linked N-acetylglucosamine (GlcNAc) [12, 24, 27]. The synthesis of chitin is mediated by chitin synthase, an integral membrane enzyme that catalyses the transfer of Nacetylglucosamine from uridine diphosphate (UDP)-N-acetylglucosamine to a developing chitin chain. Followed by an elongation of the chitin polymers via vectorial synthesis, that way the nascent chains are dismissed through the plasma membrane as they are made [47].
Stabilized hydrogen bonding between the polymers of chitin results in microfibril formation and consequent crystallization of chitin in the extracellular space immediately adjacent to the plasma membrane. This structure confers stretching resistance to the CW to resist chemical and physical challenges [30, 37, 46, 47]. If chitin synthesis is disrupted, the CW turns disordered, becoming malformed and osmotically unstable [47]. The chitin chains lengths in the CW and in bud scars are estimated to be around 100 and 190 monomers of GlcNAc, respectively. In the CW, ~40 to 50% of the chitin chains are linked to the nonreducing end of β-1,3-glucan (-GlcNAc-L1C4-Glc-) via a β-1,4 bond engaging the reducing end of the chitin polymer [27, 30, 37].
Figure 1.10 Chemical structure of the cell wall chitin [38].
1.4 Production of yeast extracts and yeast cell wall
Food yeast can be produced by different processes on the chosen substrate and yeast species [6]. In order to obtain the YE and YCW (Figure 1.11), the yeast or inoculum S. cerevisiae is fermented first in a medium culture with molasses (sugar, vitamins and minerals) and C. utilis in medium culture with ethanol, wood sugar or sulfite liquor. In both cases the medium culture is also supplied with salts, vitamins, trace elements/ supplements, water, a nitrogen source and air at ~ 30°C. When the fermenter is full and no more sugar can be added, the yeast is concentrated and washed in a centrifuge to remove the sugar residues. The result is a so-called yeast cream which will run through an extraction process (autolysis, hydrolysis or plasmolysis process sub-chapters 1.4.1; 1.4.2 and 1.4.3 respectively) [6, 8, 21, 48].
To obtain YE, the liquid must be centrifuged in order to remove the insoluble cell walls from the soluble components. Finally, the YE is concentrated in an evaporation process under vacuum conditions at ~60°C to a paste with 70-80 % dry weight or to a liquid with 45-65 % dry weight. Depending on the future use, the liquid yeast extract is then dried and pulverized. The liquid is fed
13
into a spray dryer and dried using hot air. During this process the water evaporates, the dried extract falls down and it is collected at the base of the tower of the spray dryer [48, 49].
There are several factors that influence such quality differences in flavour, colour, solubility and acceptability of YE. These include: type and condition of the yeast, presence of extraneous matter, extraction and processing conditions employed, level of contamination during processing, conditions applied during concentration and drying, the type of packaging and the conditions the products were exposed to, until they reach the consumer [50, 51].
Figure 1.11 Scheme with the process to produce yeast extract and yeast cell wall (adapted) [6,
8, 21].
1.4.1 Autolysis Process
Autolysis is a process in which hydrolysis of intracellular biopolymers occur under the action of endohydrolases (e.g. nucleases, proteases and glucanases) entailed cell death and the formation of low-molecular products releasing from the intracellular space [7, 52]. Autolysis usually takes place at the end of the stationary phase of growth and is frequently associated with cell death [7, 53].
The mechanism of autolysis of yeast cell can be described in at least four stages. The first step involves a disturbance of cell endostructures, and as result the hydrolytic enzymes are released into the cytoplasm. In the second step the released hydrolytic enzymes are initially inhibited by specific cytoplasmic inhibitors, and then activated due to degradation of these inhibitors [7, 53]. In the
14
third step, activated enzymes interact with intracellular polymer components (substrate), resulting in accumulation of their hydrolysis products (e.g. peptides, AA, fatty acids, nucleotides, and nucleosides,) in the space restricted by CW [7, 53, 54]. In step four, as the molecular mass of hydrolysis products decreases, the said products diffuse into the extracellular medium [7, 53].
The industrial autolysis process is induced by holding an agitated slurry (15-18% yeast solids) brought slowly to 40-50°C and pH around 5. Autolysis usually requires 12 to 36h to achieve the desired degree of hydrolysis [7, 8, 21, 50].
The autolysed YEs are important food ingredients, contributing a meaty flavour and aroma to soups, sausages, meats, gravies, sauces, seafood and vegetables [8, 21].
1.4.2 Plasmolysis Process
Plasmolysis is a modified autolysis process in the presence of a so-called accelerator, such as an inorganic salt (e.g. sodium chloride) or organic solvent (e.g. toluene, ethanol, ethyl acetate) [55, 56]. Under a hypertonic or a hypotonic conditions (osmotic pressure), yeast cells are forced to undergo shrinking of protoplasm by addition of salt/ organic solvent, resulting in the release of cell water, solutes and enzymes. This event is usually called plasmolysis [39, 57, 58]. A key factor is the pH, which is generally optimum around 8.0 [57].
YE manufactured by plasmolysis may have a limited use because the searching for low-salt processed foods is increasing [21, 50].
1.4.3 Hydrolysis Process
In hydrolysis process, first an inactivation of yeast’s own enzymes is done with heat treatment, followed by addition of exogenous enzymes or acid. The added enzymes (e.g. proteases) break down the yeast protein and other molecules into smaller molecules. The smaller molecules can now leave the yeast cell and mix with the aqueous solution in the tank. In this process the mixture is heated up to 100°C in a wiped film evaporator with reflux condenser and hydrolysis proceeds until the desired level of amino nitrogen is reached, generally 6-12 hours are needed for converting 50-60% of the total nitrogen to amino nitrogen. Neutralization of the hydrolysate to pH 5-6 is usually attained with sodium hydroxide [8, 50].
While hydrolysis results in the highest yields of YE, there is some loss of vitamins, protein and flavour. The high final salt content of hydrolysates may limit their use in foods [8, 21].
15
1.5 Proteins, peptides and free amino acids
Proteins are ubiquitous components of all living tissues, animal, plant and bacterial. They serve indispensable functions in cellular architecture, catalysis, metabolic regulation, and contractile processes and are an important weapon in the defence arsenal of many higher organisms [59]. They are synthesized from AA or activated AA present in the form of aminoacyl-transfer RNA (-tRNAs) in the process of translation on the ribosomes by peptide-bond-linking enzymes. Messenger RNAs (mRNA) which contains information on the AA sequence, is involved in the process [48]. Proteins are macromolecules/polymers constructed of linear, covalently bonded chains of AA. The lower boundary for the MW of proteins is taken to be about 5000 and substances with lower MW built from similar units are called polypeptide. There is no clear line of demarcation indicating how many monomeric units are required to make a protein [59].
Peptides
The bonds related with formation of secondary amide linkages between the carboxyl and α-amino functions of adjacent AA are termed peptide bonds. The structures resulting from the formation of peptide bonds are named peptides and the individual AA of peptides are termed residues [59].
Some sequence of peptides are associated with good taste properties. Aspartame (L-aspartyl-L-phenylalanine methyl ester) and also pCN-C6H4-NHCO-L-Asp-L-(αMe)Phe-OMe are used as a
non-caloric sweetener. Asp cannot be substituted whereas Phe can be substituted by some hydrophobic residue. H-Asp-Met-OMe is nearly as sweet and H-Asp-Tyr-OMe is slightly less sweet than aspartame. All possible chiral isomers, i.e. D-L, L-D and D-D H-Asp-Phe-OMe are bitter [60]. For example, an octapeptide, whose sequence is H-Lys-Gly-Asp-Glu-Glu-Ser-Leu-Ala-OH was termed “delicious peptide” since it produced a taste like beef soup. Only few fragments of this peptide are associated with umami taste [60, 61]. The taste properties of the peptide fragments that provide an umami taste are reported in Table 1.5. These peptides (around 52), like the AA Glutamate, might have a synergy with ribonucleotides. It is possible that umami taste is a consequence of partial hydrolysis leading to sizeable concentrations of Asp or Glu [60, 61]. Some studies also relate fractions with a MW less than 500 Da with the most intense umami taste [62].
16
Table 1.5 Peptides reported to have umami taste [60, 61].
Peptide Taste
KGDEESLA Umami/ sour
AEA Umami GDG Umami VEV Umami EEE Umami KG Salty/ umami DE Salty/umami DL Umami EE Salty/umami EL Umami EK Umami/sour ED Salty/umami DD Salty/umami
Many peptides hosting residues with hydrophobic side chains have a distinct bitter taste, this taste is also related with fermented foodstuff because of enzymatic hydrolysis [60].
Amino acids
The complete hydrolysis of proteins yields a mixture of about twenty AA. In a general way the structure of AA, with a few exceptions, is [39, 59]:
(1) NH2-CHR-COOH
In the simplest case, R=H (aminoacetic acid or glycine). In other amino acids, R is an aliphatic, aromatic or heterocyclic residue and may incorporate other functional groups.
AA can be classified having in account intra- and intermolecular interactions in proteins. AA with nonpolar, uncharged side chains: e.g., glycine, alanine, valine, leucine, isoleucine,
proline, phenylalanine, tryptophan and methionine.
AA with uncharged, polar side chains: e.g., serine, threonine, cysteine, tyrosine, asparagine and glutamine.
AA with charged side chains: e.g., aspartic acid, glutamic acid, histidine, lysine and arginine. Free AA can contribute to the flavour of protein-rich foods in which hydrolytic processes occur. Taste quality is influenced by the molecular configuration. Usually sweet AA are primarily found among members of the D-series, whereas bitter AA are generally acids with a cyclic side chain (1-aminocycloalkane-1-carboxylic acids) are sweet and bitter [39].
17
1.6 Nucleic Acids and nucleotides
The nucleic acids are macromolecules essential for many functions of a living organism, e.g. the storage and transmission of its genetic make-up and the means by which this information is utilized in the synthesis of all cellular proteins, and hence of all cellular constituents. The basic structure comprises a nitrogenous base, a five carbon (sugar) and a phosphate group [59].
The bases found in nucleic acids in DNA are either pyrimidines (thymine (T) and cytosine (C)) or purines (adenine (A) and guanine (G). Most RNAs also contain only four bases: the purines (A and G) and the pyrimidines (uracil (U) and C) [59].
Nucleoside comprises a nitrogenous pyrimidine or purine base and a sugar (D-ribose or D-2-deoxyribose) [59, 63].
Nucleotides are phosphate esters of nucleosides, the phosphoryl residue being attached to at least one hydroxyl groups of the sugar and can be obtained by chemical or enzymatic hydrolysis of the nucleic acids. Thus ribonucleotides can be phosphorylated on the 2’-, 3’- and 5’- positions. Furthermore, cyclic phosphates can be formed by the subsequent phosphorylation of a second hydroxyl group, giving rise to 2’-, 3’- and 5’- cyclic phosphates. Deoxyribonucleosides can be phosphorylated only on the 3’- and 5’- positions [59, 63].
Figure 1.12 General structure of a ribonucleotide. OH at the 2´position is deoxygenated and the
phosphate group is attached to the 5’position [64].
1.7 Yeast extract
YEs are the soluble portion of the cell content of yeast following an enzymatic digestion of the yeast cell constituents by autolysis, hydrolysis or plasmolysis process. Biomass for YE production is obtained primarily from brewer’s yeasts and secondarily from sources of primary-grown yeasts including S. cerevisiae and C. utilis [48, 51].
YEs are a natural source for savory flavour due the presence of various free AA, peptides, nucleotides and reaction flavours generated during processing [67]. A major consideration in their use as a flavouring agent is their cost-effectiveness compared to other flavouring agents on the basis of equivalent flavour intensity [66]. They are usually rich in peptides, AA, nucleotides and vitamins, therefore are good for use as supplement in culture media [65]. The choice of the starting material and enzymes for the production of YEs is related with the cost and availability of the yeast and the quality expected in the final product [65].
18
Figure 1.13 Backbone
of RNA [54].
1.7.1
Yeast Extracts Containing 5’-Nucleotides
Strains of yeast are used as source of RNA (Figure 1.13) to produce YEs containing natural flavour enhancers. Among different commercial strains of yeast, C. utilis has been found to contain the highest level of RNA (10-15%) per dry matter as compared to 5-8% RNA in S. cerevisiae [8, 67].
It is essential to choose the right enzymes for the hydrolysis of the RNA to make possible produce YEs which are able to enhance some organoleptic properties in food application because of presence of 5’nucleotides (Figure 1.14). These enhancers can work as substitute of monosodium glutamate (MSG) which is the sodium salt of glutamic acid (non-essential AA) and it is associated to adverse effects [50, 67].
Figure 1.15 shows a possible explanation to YEs containing 5'-IMP and 5'-GMP, which are the most important compounds in terms of taste-enhancing properties.
First the RNA is extracted, using hot alkali treatment to breakdown the yeast cells and afterwards is hydrolysed by a fungal nuclease (a.k.a as 5'-phosphodiesterase) which are able to hydrolyse the RNA into 5´-nucleotides. 5'-AMP and 5'-GMP are removed from the mixture by adsorption, on activated charcoal, and CMP and UMP pass through the column to be discarded. Then AMP and 5'-GMP are adsorbed and eluted in a methanol/ammonia mixture. 5'-IMP can be obtained through the conversion of adenosine 5'-monophosphate (5'-AMP) by adenosine deaminase [50, 66, 67, 68].
Figure 1.14 The ribonucleoties, AMP, GMP, UMP and CMP. All abbreviations assume that the
phosphate group is at the 5' position [64].
19
![Figure 1.1 Diagrammatic representation of a section through a typical budding yeast cell [3]](https://thumb-eu.123doks.com/thumbv2/123dok_br/15917086.1093385/27.892.233.672.430.723/figure-diagrammatic-representation-section-typical-budding-yeast-cell.webp)
![Figure 1.9 Example of a molecular structure of an insoluble yeast β-glucan [42].](https://thumb-eu.123doks.com/thumbv2/123dok_br/15917086.1093385/37.892.118.792.111.658/figure-example-of-molecular-structure-insoluble-yeast-glucan.webp)
![Figure 1.11 Scheme with the process to produce yeast extract and yeast cell wall (adapted) [6, 8, 21]](https://thumb-eu.123doks.com/thumbv2/123dok_br/15917086.1093385/39.892.122.790.317.813/figure-scheme-process-produce-yeast-extract-yeast-adapted.webp)
![Figure 1.15 The production of 5'-IMP and 5'GMP by RNA hydrolysis (simplified) [68].](https://thumb-eu.123doks.com/thumbv2/123dok_br/15917086.1093385/45.892.111.782.89.1013/figure-production-imp-gmp-rna-hydrolysis-simplified.webp)
![Figure 1.16 Schematic structure of T1R1-T1R3 heterodimer [69].](https://thumb-eu.123doks.com/thumbv2/123dok_br/15917086.1093385/47.892.227.661.115.412/figure-schematic-structure-t-r-t-r-heterodimer.webp)
![Table 2.12 Lipids distribution on CW of S. cerevisiae and C. utilis expressed as percentage of the total lipids [90]](https://thumb-eu.123doks.com/thumbv2/123dok_br/15917086.1093385/77.892.97.798.543.678/table-lipids-distribution-cerevisiae-utilis-expressed-percentage-lipids.webp)