Tomás Campos de Carvalho Stilwell
Licenciado em Engenharia do Ambiente
Transition to a Low Carbon Energy System
:
Looking ahead on regional needs for minerals and materials
Dissertação para obtenção do Grau de Mestre em Engenharia do Ambiente,
Perfil de Engenharia de Sistemas Ambientais
Orientador: Doutora Sofia Simões,
Investigadora, Faculdade de Ciências e Tecnologia – Universidade Nova de
Lisboa
Co-orientador: Professora Doutora Júlia Seixas,
Professora Associada com Agregação, Faculdade de Ciências e Tecnologia –
Universidade Nova de Lisboa
Júri:
Presidente: Prof. Doutor Francisco Ferreira,
Professor Associado, Faculdade de Ciências e Tecnologia – Universidade Nova de Lisboa Arguente: Prof. Doutor Hugo Águas,
Professor Associado, Faculdade de Ciências e Tecnologia – Universidade Nova de Lisboa
Transition to a Low Carbon Energy System: Looking ahead on regional needs for minerals and materials.
Copyright © Tomás Campos de Carvalho Stilwell, Faculdade de Ciências e Tecnologia – Universidade Nova de Lisboa, 2018
This work is partially based on the ETP 2017 developed by the International Energy Agency, © OECD/IEA [2018] but the resulting work has been prepared by Tomás Campos de Carvalho Stilwell and does not necessarily reflect the views of the International Energy Agency.
The Faculdade de Ciências e Tecnologia and the Universidade Nova de Lisboa have the right, perpetual and without geographical limits, to file and publish this dissertation through exemplary printed on paper or digital form, or by any other means known or that comes to be invented, and to disseminate it through scientific repositories and to admit their Copying and distribution with educational or research objectives, non-commercial, as long as be given credit to the author and editor.
A
CKNOWLEDGMENTS
Quero deixar os meus mais sinceros agradecimentos à Dr. Sofia Simões pela orientação, motivação e excelente proposta de tema. Assim como à professora Dr. Júlia Seixas pela co--orientação, vasto conhecimento e experiência no assunto desta dissertação.
Quero agradecer aos meus pais Rita e George por incondicionalmente me apoiarem e me trazerem até este patamar da minha vida saudável, culto, educado e feliz.
À minha avó Maria Teresa por ser o meu refúgio durante todos os momentos mais difíceis. Aos meus irmãos Diogo, Maria, Catarina e Sebastião por serem os meus companheiros eternos. A toda a minha restante família demasiado grande para enumerar.
À empresa Altogagreen e á equipa de que fiz parte durante a génese desta tese: Indira Andrade pela capacidade de liderança, compreensão e flexibilidade; ao Paulo Pereira e ao Daniel Vicente pela companhia e amizade e partilha de conhecimentos.
S
UMÁRIO
A civilização global precisa de mudar. Os níveis de poluição atuais não são sustentáveis nem reversíveis, mas existe a possibilidade de abrandar os efeitos do aquecimento global. Dentro dos diferentes contribuidores para a poluição atmosférica global, aqueles ligados ao sector da energia (transportes e geração elétrica) representam uma fatia de aproximadamente 60% do total de emissões de Gases de Efeito de Estufa (GEE). Esta dissertação foca-se exatamente nestes dois subsectores e na sua transição para um sistema energético de baixo carbono. Utilizando 3 cenários da Agência Internacional da Energia (IEA), identificaram—se e quantificaram-se 31 materiais necessários (bauxite, boro, cádmio, cromo, cobalto, cobre, gálio, germânio, ouro, grafite, indium, ferro, chumbo, lítio, magnesite, manganês, molibdênio, níquel, nióbio, paládio, selênio, prata, tântalo, telúrio, estanho, titânio, tungstênio, vanádio, zinco, zircão e terras raras) essenciais para as tecnologias de baixo carbono considerados: energia eólica, energia solar, energia hidrelétrica, energia nuclear, energia geotérmica, energia do oceano, captura e armazenamento de carbono, mobilidade elétrica e baterias de armazenamento de eletricidade. A quantificação foi feita em escala global e separadamente para dez regiões do mundo (ASEAN, UE, China, EUA, Índia, Rússia, África do Sul, Brasil, México e África+), bem como para os grupos OCDE e não-OCDE, quanto às necessidades de materiais versus a sua extração nas respetivas regiões. Identificaram-se os materiais mais críticos de cada região e o risco em obter todos os materiais necessários de acordo com os cenários da IEA. Quantificou-se ainda o consumo de energia para a extração e concentração dos materiais totais. Concluiu-se que a média anual para o período de 2055-2060, para instalar entre [32 a 58,3 milhões] de veículos elétricos e [458,1 a 469,6 GW] de tecnologias de produção de eletricidade não fóssil, estimados pela IEA, corresponde a um total entre [19,585,988 e 25,430,698 t] de materiais o que representa um consumo anual médio entre [6 a 10,5 vezes] maior que o consumo anual médio para o período 2014-2025 para estas tecnologias, de acordo com o três cenários (RTS, 2DS e B2DS). As tecnologias solares tipo PV thin-film e os veículos elétricos são as que maiores problemas criam a nível global em termos de aviabilidade de materiais. telúrio, gálio, indium são os materiais mais críticos utilizados em PV thin-film, e lítio, cobalto, grafite e terras raras os mais críticos utilizados em veículos eléctricos. À escala regional, conclui-se que de entre as regiões estudadas, a Índia é a região mais dependente de materiais importados para a instalação de tecnologias de baixo carbono que permitam o crescimento em consumo de eletricidade expectável, posicionando-se assim como a região de maior risco teórico. Materiais como o cobre, níquel, molibdeno e chumbo necessitara provavelmente de aumentar significativamente a produção mundial e/ou as taxas de reciclagem. Nesta análise não se teve em conta o potencial de reciclagem, o potencial de substituição ou de eficiência no uso de materiais no futuro, pelo que as necessidades estimadas podem estar sobrestimadas.
Palavras-Chave: transição energética; materiais críticos; demanda regional; tecnologias de baixo carbono; ETP; IEA;
A
BSTRACT
Global civilization needs to change. Current pollution levels are not sustainable or reversible, but there is the possibility of slowing down the effects of global warming. Within the different contributors to global air pollution, those connected to the energy sector (transport and electricity generation) represent a slice of approximately 60% of the total emissions of Greenhouse Gases (GHG). This dissertation focuses on exactly these two subsectors and the required transition to a low-carbon energy system. This dissertation uses scenarios produced by the International Energy Agency (IEA) for the ETP 2017 and analyses potential bottleneck occurrences for 31 materials ( bauxite, boron, cadmium, chromium, cobalt, copper, gallium, germanium, gold, graphite, indium, iron, lead, lithium, magnesite, manganese, molybdenum, nickel, niobium, palladium, selenium, silver, tantalum, tellurium, tin, titanium, tungsten, vanadium, zinc, zircon and rare earths elements) essential for the low carbon technologies considered: wind power, solar power, hydro power, nuclear energy, geothermal energy, ocean energy, carbon capture and storage, electric mobility and electricity storage batteries. The quantification was made at a global scale and separately for ten regions of the world (ASEAN, EU, China, USA, India, Russia, South Africa, Brazil, Mexico and Africa+) as well as for the OECD and non-OECD groups in terms of needs of materials versus their extraction in their respective regions. The materials most critical to each region and the risk of obtaining all the necessary materials were identified, according to IEA ETP’17 scenarios. The energy consumption for the extraction and concentration of the total materials is also estimated. It was concluded that the annual average for the period of 2055-2060, to install between [32 to 58.3 million] of electric vehicles and [458.1 to 469.6 GW] of non-fossil electricity production technologies, estimated by the IEA, corresponds to a total [19,585,988 and 25,430,698 t] of materials which represents an average annual consumption [6 to 10.5 times] higher than the average annual consumption for the 2014-2025 period for these technologies, according to the three scenarios (RTS, 2DS and B2DS). Solar PV Thin-Film technologies and electric vehicles create the biggest problems at the global level in terms of material availability. Tellurium, gallium, indium are the most critical materials used in thin-film PV and lithium, cobalt, graphite and rare earth the most critical used in electric vehicles. On a regional scale, it is concluded that among the regions studied, India is the region most dependent on materials import for the installation of low-carbon technologies that would allow expectable growth in electricity consumption, positioning itself as the region with the highest theoretical risk. Materials such as copper, nickel, molybdenum and lead would probably need to significantly increase global production and/or recycling rates. In this analysis the potential effect of recycling, the potential for substitution or efficiency in the use of materials was not considered which may overestimate the overall material requirements.
Table of contents
1 Introduction ... 1
1.1 Framing and motivation ... 1
1.2 Objectives and scope of the dissertation ... 2
1.3 Structure of Dissertation ... 3
2 Literature Review ... 4
2.1 Brief overview of low carbon energy scenarios ... 4
2.2 Studies that assess material needs for low-carbon energy technologies ... 5
2.3 Overview of environmental impacts of the mining industry ... 10
3 Methodology ... 12
3.1 Methodological approach ... 12
3.2 IEA low carbon scenarios and considered material use factors ... 14
3.2.1 Considered material use factor for low-carbon electricity generation technologies ... 15
3.2.2 Electricity generation scenarios for the World, OECD and Non OECD regions ... 16
3.2.3 Electricity generation scenarios for the BRICS, ASEAN, EU, USA, Mexico and Africa +... 23
3.2.4 Scenarios for deployment of hybrid and electric vehicles and material use factors ... 26
3.2.5 Scenarios for deployment of electricity storage and material use factors... 29
3.3 Methodology for assessing potential materials supply bottlenecks for deployment of low carbon technologies 30 3.3.1 World materials production and reserves ... 30
3.4 Energy consumption from materials extraction ... 33
3.5 Overview of main methodological limitations ... 35
4 Results ... 37
4.1 Use of materials for low carbon energy technologies ... 37
4.1.1 Global material needs ... 37
4.1.2 Materials needs per region ... 46
4.2 Assessing potential materials supply bottlenecks for deployment of low carbon technologies. ... 47
4.2.1 Assessing material dependency per region ... 47
4.2.2 Material flows for low-carbon energy technologies ... 51
4.2.3 Overall valuation ... 53
4.3 Energy consumption from resource mining for low carbon energy technologies deployment ... 54
5 Conclusions ... 57
5.1 Energy transition in the world – Supply & Demand ... 57
5.2 Limitations of the analysis and future developments ... 58
6 References ... 60
Figures index
FIGURE 1 - STAGES OF A MINING PROJECT; SOURCE: (ELAW 2010) ... 10
FIGURE 2 - MOST COMMON IMPACTS OF MINES CONSTRUCTION AND OPERATION. BASED ON (ELAW 2010). ... 11
FIGURE 3 - METHODOLOGICAL APPROACH USED ... 13
FIGURE 4 - ETP REGIONS ( IN GREY ARE THE COUNTRIES WHICH CONSTITUTE “AFRICA+”) ... 14
FIGURE 5 - SHARE OF ELECTRICITY PRODUCTION SOURCES AS INSTALLED CAPACITY AND GROSS ELECTRICITY PRODUCTION, FOR THE WORLD, OECD AND NON-OECD IN THE YEAR 2014. (SOURCE: ETP 2017) ... 17
FIGURE 6 - COMPARISON OF THE ETP 2017 SCENARIOS ACCORDING TO THE GROSS ELECTRICITY GENERATION OF EACH TECHNOLOGY. ... 18
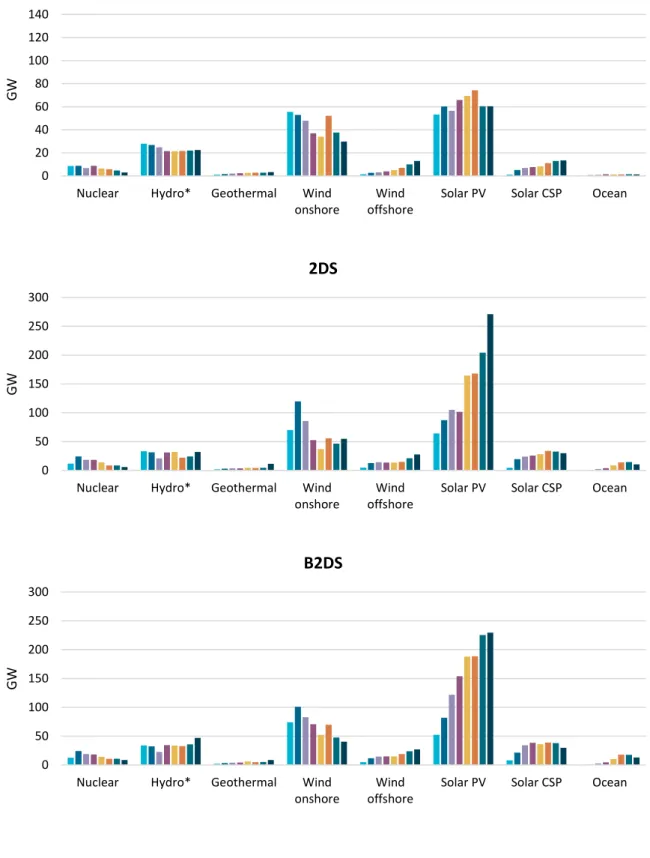
FIGURE 7 – ANNUAL NEW INSTALLED CAPACITY, IN THE VARIOUS TIME GAPS, ACCORDING TO THE THREE SCENARIOS (SOURCE: ETP 2017). * HYDRO VALUES EXCLUDE PUMPED HYDRO. ... 20
FIGURE 8 - COMPARISION OF CHANGES IN INSTALLED CAPACITY OF DIFFERENT TECHNOLOGIES UNTIL 2060 FOR THE THREE STUDIED SCENARIOS. (SOURCE: ETP 2017) ... 21
FIGURE 9 - COMPARISION OF THE THREE SCENARIOS BY THE CHANGES IN GROSS ELECTRICITY PRODUCTION OF DIFFERENT TECHNOLOGIES FROM 2014 – 2060. (SOURCE: ETP 2017)... 22
FIGURE 10 - COMPARISON OF REGIONS BY SHARE OF GLOBAL GDP (LEFT), SHARE OF GLOBAL EMISSIONS (MIDDLE) AND SHARE OF GLOBAL ELECTRICITY PRODUCTION (RIGHT) FOR THE YEAR 2014 (SOURCE: IMF, 2018 AND ETP 2017) ... 23
FIGURE 11 - SHARE OF WORLD POPULATION OF EACH REGION. WORLD POPULATION IN 2015: 7,207,361 THOUSAND PEOPLE. (SOURCE: UNITED NATIONS POPULATION DIVISION, 2015). ... 23
FIGURE 12 - COMPARISON OF ELECTRICITY PRODUCTION MIXES OF THE DIFFERENT REGIONS FOR THE YEAR 2014 (SOURCE: ETP 2017) ... 24
FIGURE 13 - SHARE OF WORLD ELECTRICITY PRODUCTION PER REGION, IN 2014 AND ACCORDING TO THE 3 SCENARIOS (SOURCE: ETP 2017) ... 24
FIGURE 14 - PERCENTAGE OF RES ELECTRICITY PER REGION IN THE THREE SCENARIOS UP TO 2060 (SOURCE: ETP 2017) .... 25
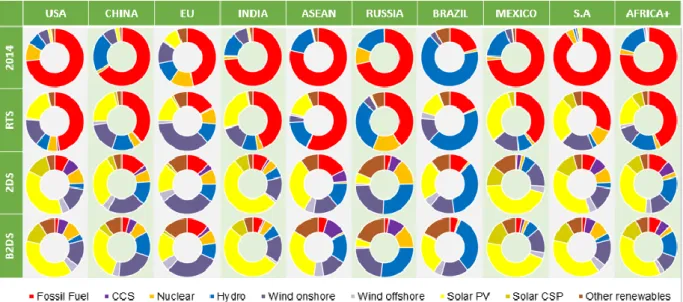
FIGURE 15 - COMPARISON OF THE ELECTRICITY GENERATION MIXES IN THE YEAR 2014 AND THE YEAR 2060 ACCORDING WITH THE THREE SCENARIOS. (SOURCE: AUTHOR ELLABORATION ON ETP 2017) ... 26
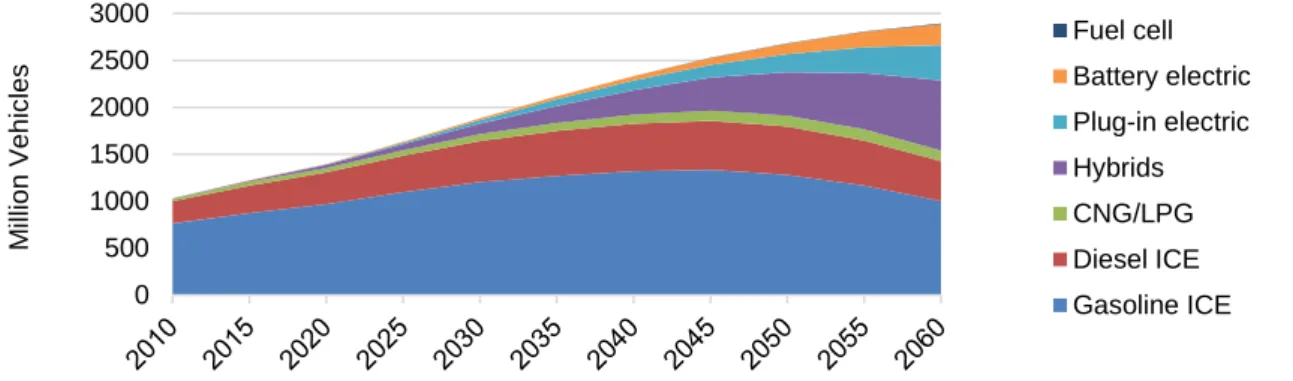
FIGURE 16 - EVOLUTION OF THE STOCK OF VEHICLES UP TO 2060, ACCORDING WITH THE RTS (SOURCE: ETP 2017) ... 27
FIGURE 17 - EVOLUTION OF THE NUMBER OF VEHICLES UNTIL 2060, ACCORDING WITH THE 2DS (SOURCE: ETP 2017) ... 27
FIGURE 18 - EVOLUTION OF THE AMOUNT OF HYBRID AND ELECTRIC VEHICLES UNTIL 2060, ACCORDING TO THE THREE SCENARIOS (SOURCE: ETP 2017) ... 27
FIGURE 19 - THREE POSSIBLE OUTCOMES BY 2060, ACCORDING WITH THE IEA SCENARIOS (SOURCE: ETP 2017) ... 28
FIGURE 20 – GLOBAL STORAGE CAPACITY ACCORDING TO THE THREE SCENARIOS UP TO 2060 (SOURCE: ETP 2017) ... 29
FIGURE 21 - GROWTH OF PRODUCTION OF DIFFERENT MINERAL CATEGORIES AND GLOBAL POPULATION. SOURCE: (WWW.WORLD-MINING-DATA.INFO AND UN POPULATION DIVISION 2016 DATASET) ... 31
FIGURE 22 - SHARE OF 2016 WORLD MINE PRODUCTION BY ETP REGION. NOTE: HERE AFRICA + DOES NOT INCLUDE SOUTH AFRICA. (SOURCE: AUTHORS ELLABORATION OVER WWW.WORLD-MINING-DATA.INFO) ... 32
FIGURE 23 - SHARE OF MINING PRODUCTION OF DIFFERENT METALS FOR OCDE AND NON OCDE COUNTRIES NOT INCLUDING CHINA AND CHINA (SOURCE: AUTHORS ELLABORATION OVER WWW.WORLD-MINING-DATA.INFO) ... 33
FIGURE 24 –WORLD LARGEST PRODUCERS OF THE 31 MATERIALS CONSIDERED. (SOURCE: AUTHORS ELLABORATION OVER WWW.WORLD-MINING-DATA.INFO) ... 33
FIGURE 25 - INTERCONNECTED CARRIER METAL CYCLES; SOURCE:(VERHOEF ET AL. 2004) ... 34
FIGURE 26 - CUMULATIVE DEMAND OF MATERIALS UP TO 2060, FOR THE THREE SCENARIOS. ... 39
FIGURE 27 - CUMULATIVE DEMAND FOR MATERIALS ACCORDING TO THE THREE SCENARIOS, EXCEPT FOR ALUMINIUM, IRON AND CEMENT ... 40
FIGURE 28 - SHARE OF TOTAL MATERIAL REQUIREMENTS PER TECHNOLOGY IN 2060 ... 45
FIGURE 29 - SHARE OF GLOBAL REQUIREMENTS OF EACH MINERAL PER REGION IN 2060 ACCORDING TO EACH SCENARIO ... 46
FIGURE 30 - MATERIALS MOST CRITICAL FOR EACH REGION, INCLUDING THOSE NOT PRODUCED AND THOSE WHICH REQUIRE AN AVERAGE OF 100% OR MORE OF THE ANNUAL PRODUCTION IN 2016 (IN RED) ... 51
FIGURE 31 - MOST CRITICAL MATERIALS. COMPARISION BETWEEN 2016 ANNUAL PRODUCTION AND AVERAGE ANNUAL REQUIREMENTS ACCORDING TO THE B2DS... 52
FIGURE 32 - STAGE CONTRIBUTIONS TO GWP FOR COPPER CONCENTRATE PRODUCTION. RETRIEVED FROM (NORGATE AND HAQUE 2010) ... 55
FIGURE 33 -TOTAL PJ FROM EXTRACTION OF CARRIER MINERALS CONSIDERING AVERAGE GLOBAL ORE GRADE, ACCORDING TO B2DS UNTIL 2060 ... 56
FIGURE 34 - EFFECT OF ORE GRADE ON EMBODIED ENERGY FOR PYROMETALLURGICAL COPPER PRODUCTION. IMAGE RETRIEVED FROM (NORGATE AND HAQUE 2010);... 56
T
ABLE
I
NDEX
TABLE 1 - STUDIES THAT ASSESS THE MATERIAL NEEDS FOR LOW-CARBON TECHNOLOGIES ... 6 TABLE 2 - GROUP OF COUNTRIES OF THE REGIONS CONSIDERED IN ETP AND THE GROUP OF COUNTRIES THAT CONSTITUTE
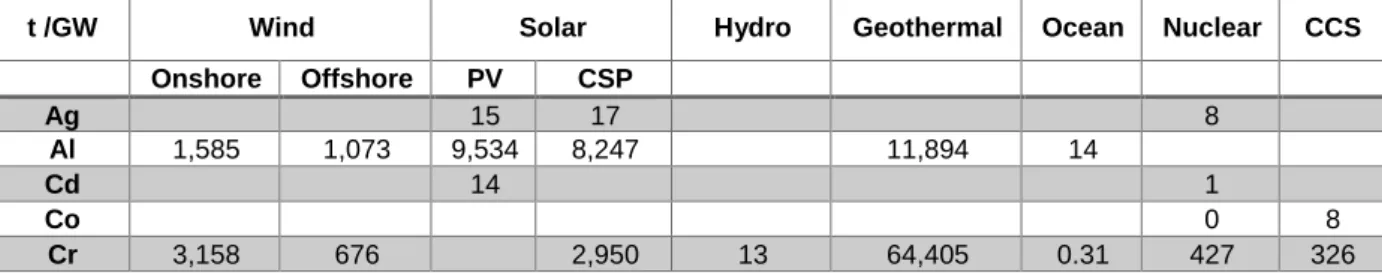
AFRICA + GROUP. IN BOLD ARE THE COUNTRIES FOR WHICH THERE IS INDIVIDUAL DATA. ... 15 TABLE 3 - MATERIALS USE FACTOR FOR THE ELECTRICITY GENERATION TECHNOLOGIES CONSIDERED IN THIS THESIS. BASED ON
JRC (2011, 2013, 2016); GARCIA - OLIVARES ET AL. (2012); ASHBY, ATTWOOD AND LORD, (2012); B.GUEZURAGA (2012); CORONA ET AL. (2017); ELSHKAKI & GRAEDEL (2013); GAMESA, (2014); KAVLAK (2015); KLEIJN AND VOET (2010); KLEIJN ET AL, (2018); OHRLUND (2012); PIHL,_ET AL (2012); PRIMARD, PIERRE (2015);TILL ZIMMERMANN (2013); USGS (2011); VESTAS, (2012); WORLD BANK (2017); ZIMMERMANN (2013); ... 15 TABLE 4 - SHARE OF GROSS ELECTRICITY GENERATION, SHARE OF RENEWABLES, TOTAL ELECTRICITY GENERATION AND TOTAL
INSTALLED CAPACITY ACCORDING TO THE THREE SCENARIOS UP TO 2060 FOR THE WORLD ... 17 TABLE 5 - AVERAGE ANNUAL CHANGE OF INSTALLED CAPACITY FOR ELECTRICITY GENERATION TECHNOLOGIES FROM 2014 TO
2060 ... 18 TABLE 6 - GROSS ELECTRICITY PRODUCTION IN THE YEAR 2014 AND 2060 ACCORDING TO THE THREE ETP SCENARIOS (TWH) 25 TABLE 7 - COMPARISON OF INTERNAL COMBUSTION VEHICLES GROWTH IN THE THREE SCENARIOS, FROM 2014 TO 2060
(SOURCE: ETP 2017) ... 26 TABLE 8 - MATERIAL USE FACTORS USED IN THE QUANTIFICATION OF TOTAL MATERIAL REQUIREMENTS FOR EV’S. (WORLD
BANK, (2017); KLEIJN ET AL, (2018); JRC (2013,2016) ... 28 TABLE 9 - MATERIAL USE FACTORS USED IN THE QUANTIFICATION OF TOTAL MATERIAL REQUIREMENTS FOR ENERGY STORAGE. . 29 TABLE 10 - ASSESSMENT OF THE 31 MATERIALS CONSIDERED IN THIS STUDY IN TERMS OF GLOBAL ANNUAL PRODUCTION, GLOBAL
RESERVES, ESTIMATED REMAINING YEARS OF PRODUCTION AND PERCENTAGE OF RESERVES ANNUALLY MINED IN 2016. SOURCE: (REICHL, SCHATZ, AND ZSAK 2017) (USGS 2017B) ... 30 TABLE 11 - GROWTH OF PRODUCTION OF DIFFERENT MINERAL CATEGORIES AND OF GLOBAL POPULATION; SOURCES:
(WWW.WORLD-MINING-DATA.INFO AND UNPOPULATION DIVISION 2016 DATASET) ... 32 TABLE 12 - OVERALL CONSUMPTION OF ELECTRICITY, DIESEL AND WATER FOR EXTRACTION PHASE; SOURCE: (NORGATE AND
HAQUE 2010) ... 34 TABLE 13 - FACTORS USED FOR CALCULATING ENERGY DEMAND FROM METAL EXTRACTION. SOURCE: (NORGATE AND HAQUE
2010) ... 34 TABLE 14 - ASSUMPTIONS MADE ... 35 TABLE 15 - TOTAL MATERIAL REQUIREMENTS FROM 2014 UNTIL 2060 ACCORDING TO THE THREE SCENARIOS. GROWTH
COMPARISION BETWEEN THE THE THREE SCENARIOS. ... 37 TABLE 16 - TOTAL DEMAND OF MATERIALS PER LOW-CARBON ENERGY TECHNOLOGY, ACCORDING TO EACH SCENARIO UP TO
2060 ( HIGHLIGHTED ARE THE HIGHEST SHARES OF EACH MATERIAL) ... 41 TABLE 17 – MATERIALS NOT PRODUCED IN EACH REGION ... 47 TABLE 18 - MINERALS CATEGORIZED BY PERCENTAGE OF THE AVERAGE ANNUAL REQUIREMENTS OF THE REGIONS ANNUAL
PRODUCTION IN 2016, FOR THE RTS UNTIL 2060 ... 48 TABLE 19 - MINERALS CATEGORIZED BY PERCENTAGE OF THE AVERAGE ANNUAL REQUIREMNENTS OF THE REGIONS ANNUAL
PRODUCTION IN 2016, FOR THE 2DS UNTIL 2060 ... 48 TABLE 20 - MINERALS CATEGORIZED BY PERCENTAGE OF THE AVERAGE ANNUAL REQUIREMNENTS OF THE REGIONS ANNUAL
PRODUCTION IN 2016, FOR THE B2DS UNTIL 2060 ... 49 TABLE 21 - NUMBER OF MATERIALS NOT PRODUCED IN THE REGION PLUS NUMBER OF MATERIALS WHICH REQUIRE 100% OR
MORE OF THE KNOWN RESERVES FOR THE TOTAL REQUIRED UNTIL 2060; ( IN BOLD ARE THE MATERIALS THAT ALSO SHOW PROBLEMS WITH THE ANNUAL PRODUCTION) ... 50 TABLE 22 - ESTIMATED TIME GAPS FOR THE OCURRENCE OF BOTTLENECKS, ACCORDING TO EACH SCENARIO. ... 53 TABLE 23 - SUMMARY OF THE PERFORMANCE OF THE VARIOUS REGIONS, ACCORDING TO THE THREE SCENARIOS AND SEVEN
INDICATORS. ... 53 TABLE 24 - TOTAL WORLD ENERGY CONSUMPTION FOR EXTRACTION OF ALL REQUIRED MATERIALS UNTIL 2060, ACCORDING TO
THE B2DS ... 55 TABLE 25 - TOTAL ENERGY CONSUMPTION PER REGION ACCORDING TO EACH SCENARIO ... 56
L
IST OF ABBREVIATIONS AND ACRONYMS
2DS 2º Degree Scenario
ASEAN Association of Southeast Asian Nations B2DS Beyond 2º Degree Scenario
BEV Battery Electric Vehicles CCS Carbon Capture And Storage CSP Concentrated Solar Power ETP Energy Technology Perspectives EV Electric Vehicle
GDP Gross Domestic Product
GHG Greenhouse Gases
HEV Hybrid Electric Vehicle IEA International Energy Agency
OECD Organisation For Economic Co-Operation And Development PHEV Plug-In Hybrid Electric Vehicle
PV Photovoltaics
RE Rare Earth’s
REE Electrical and Electronic Waste
RES Renewable Energy Sources
RTS Reference Technology Scenario T&D Transmission & Distribuiton USGS United States Geological Survey
Ag Silver In Indium Sn Tin
Al Aluminium Li Lithium Ta Tantalum
B Boron Mg Magnesium Tb Terbium
C Graphite Mn Manganese Te Tellurium
Cd Cadmium Mo Molybdenum Ti Titanium
Co Cobalt Nb Niobium Va Vanadium
Cr Chromium Nd Neodymium W Tungsten
Cu Copper Ni Nickel Zn Zinc
Dy Dysprosium Pb Lead Zr Zirconium
Fe Iron Pr Praseodymium RE Rare Earths
1
I
NTRODUCTION
1.1
Framing and motivation
Climate change is one of the biggest global concerns of the XXI century. Since the beginning of the industrial age, emissions of greenhouse gases (GHG) have escalated to annual amounts never seen before, mostly due to the replacement of human work by machines that operate by burning fossil fuels either directly or indirectly by using electricity. The use of electricity became widespread in the late XIX and early XX centuries when it became firstly generated via the burning of coal, and later other fossil fuels as oil, natural gas and much more recently renewable energy sources (RES). The scientific community has long warned about the consequences of pollution on the environment and ecosystems, whether it is in solid, liquid or gaseous mode.
The speed at which Human beings exploit the world resources is a concern that comes from the late XIX century with the publication of the article “An Essay on The Principle of Population” by Thomas Malthus (Malthus 1798). Malthus concluded that the speed at which the population was growing was far superior than the speed of which we could produce food, with the first growing geometrically and the second arithmetically. This theory marked the beginning of an issue previously non-existent: the thought of limits of resources on the planet or of a minimum speed at which they could be restored.
The work by Malthus served as a base for the publication of the book entitled “The Limits to Growth” (1972) by the Club of Rome, a group of 30 people from the most diverse scientific areas. Using Mathematical models, this group anticipated that the current growth of the world economy, population and subsequent consumption of resources and ecological footprint, could not be sustained for longer than 2100. The Club then pointed out that the only solution is to take a quick and strong global policy so as not to worsen the future of the planet and of humans. The ideas in this book are strongly correlated with this dissertation. Not only is there a need to try and revert the level of existent pollution, with a transition to a low-carbon energy system, but also the need not to have shortages in the stock of resources, being them non-renewables, such as metals and minerals, or renewable as water and biomass. It is also essential to be aware of the impacts produced by exploration and extraction of resources (Nykvist et al. 2013).
Within this context a very urgent necessity is the world’s energy transition to a low-carbon system. This is worrying because not only does it need to happen, as it must happen in a relatively short period and at a global scale. The magnitude of the low-carbon technologies to be implemented and the probable extinction of traditional technologies based on fossil fuel makes this transition a huge challenge for the XXI century (Tollefson 2018)
In this context, the Paris agreement, ratified by 184 parties (UNFCCC 2018), has stated it is necessary to carry out a quick reduction of GHG so as not to exceed the rise of 2 º C of the global average temperature compared to the pre-industrial period. Approximately 2/3 of GHG emissions stem from the generation and use of energy, and the reduction of dependence on fossil fuels is therefore necessary. The global energy system needs a historical change, requiring a new energy mix based on low-carbon technologies (UNFCCC 2015). There is no time to lose and thus this transition will have to be economically viable, it should not present obstacles in the supply chains of the necessary resources and should not exacerbate environmental and social impacts (loss of biodiversity, poor human health) (de Koning et al. 2018)(Tollefson 2018)
Therefore, any obstacles to this transition, whether politico-economical or due to availability of resources, need to be identified, assessed and overcome. Another issue to be considered is that the problem of climate change is global and non-regional, and not always the most polluting areas will be the ones who
Another one of the problems for this transition is the needs for use of materials. Low-carbon energy technologies have a much higher requirement for materials than traditional energy technologies currently used, which are manly the burning of coal for production of electricity and oil for transportation of passengers and goods (Kleijn 2012).
Not only large quantities will be necessary, but also there is a very large diversity and complexity of the materials required, some of which are only produced as by-products and/ or produced in only a few regions of the planet (Leopoldina, Acatech, and Akademienunion 2018). A fourth existing problem is the competition between uses, since we live in an age also entitled the 4th Industrial Revolution, where small sized technology devices are a part of everyone’s daily life (Goosey 2012). These devices such as smartphones, computers, sound systems, televisions, household cleaning appliances, food preparation appliances, etc. often use the same raw materials as the low-carbon technologies. The relative short lifespan of these appliances, their reduced mass, the diversity of materials embedded and the great and growing number of consumers worldwide, create the current problem of waste electrical and electronic equipment (WEEE). The WEEE are a problem because not only it presents hazardous waste for the environment, as it also represents a problem for recycling and recovery of materials due to the lack of economic incentives to do so. Such a thing can only be reversed in case the economic value of the materials used increases or a more efficient method is found for collecting and recycling them (Goosey 2012).
Among all material needs for both low-carbon energy technologies and other technologies, it should be mentioned that some of them are considered “critical”. Critical materials are those that are essential for economic development, as well as those at risk of not being available in large enough reserves at both regional and global level. A material can be critical for one country or continent and not for another. If the risk is at a global scale it is necessary to predict situations of insufficiency to be able to find alternative paths either by substitution of the material, by better recovery trough recycling or by a more efficient use of it, all in a timely manner. If the insufficiency is only at regional level, there is a need for geopolitical stability that allows the exchange of materials between regions that produce and the ones that require them.
In global terms the world’s metal production has been doubling every 20-25 years since the beginning of the last century (Schodde 2013). The mining industry is currently responsible for a considerable high share of global emissions, as well as for huge environmental and social impacts. due to changes in soil use, waste production and the overwhelming energy use in the course of extraction and processing. In recent years the concentration of the nearest ores to the surface has been diminishing (Norgate and Haque 2010). This leads to higher energy consumption for the exploitation of viable deposits at greater depths and for processing minerals of lesser purity.
The energy transition comes to aggravate this situation due to the large amount of raw materials it requires. The International Energy Agency (IEA) has produced several publications which report and create hypothesis for possible future outcomes of the global energy system till 2050 and 2060. One of the most well-known of such documents is the Energy Technology Perspectives (ETP 2017), which presents three contrasting energy system scenarios up to 2060 for the planet as a whole and for its major geographic regions. The scenarios are named: Reference Technology Scenario (RST), 2-Degrees Scenario (2DS) and Beyond 2-Degrees Scenario (B2DS) and will be presented further in this dissertation.
1.2
Objectives and scope of the dissertation
With this dissertation it is intended to quantify the need of materials resources for the IEA’s three scenarios regarding main low-carbon technologies for electricity generation, energy storage and electric transport, for several major regions of the planet, as well as estimate energy consumption and emissions arising from the extraction of all the materials quantified and required for the transition to a low-carbon energy system. The analysis is done up to the year of 2060, according with the ETP 2017 scenarios.
The analysis was performed for the period 2014 till 2060 for the following geographical areas: BRICS (Brazil, Russia, India, China, South Africa), ASEAN, EU, USA, Mexico, Africa + as well as for the whole World, the OECD and the non-OECD countries.
The definition of materials considered in the dissertation are those used in each of the low carbon technologies considered. A total of 31 materials are studied, namely: Bauxite, Boron, Cadmium, Chromium, Cobalt, Copper, Gallium, Germanium, Gold, Graphite, Indium, Iron, Lead, Lithium, Magnesite, Manganese, Molybdenum, Nickel, Niobium, Palladium, Selenium, Silver, Tantalum, Tellurium, Tin, Titanium, Tungsten, Vanadium, Zinc, Zircon, Rare Earths
The following research questions were answered:
- Are there enough materials resources to ensure the deployment of the IEA’s scenarios for a transition to a low carbon energy system?
- Which materials are more critical for this transition, globally and per region? - Are there enough resources for the major regions of the planet?
- What is the expected growth of mining operations to meet each of the three IEA’s scenarios needs? -What could be the implication in terms of energy consumption associated with the extraction of the raw materials necessary for the transition to a low carbon system?
1.3
Structure of Dissertation
This dissertation starts by analysing the different existent scenarios for the energy transition to a low carbon energy system. This is followed by a review of different studies in the same theme, comparing methodologies, materials and boundaries considered. The objective of this dissertation is defined based on the identified knowledge gaps.
Section 3 describes the used methodology. It is structured in 4 sub sections: 1) materials use factors for the low-carbon technologies; 2) IEA low carbon scenarios and estimated material needs; 3) analysis of global mineral productions and reserves; 4) estimate of energy consumption from materials extraction. The results are then presented in section 4 starting with an overview of the quantified use of materials’ needs for low-carbon energy technologies till 2060, both at global and regional level. This is followed an assessment of potential materials’ supply bottlenecks per region and per technology. An estimate of the energy consumption needs for the extraction of materials in the various regions is presented.
Section 5 concludes the dissertations and highlights the necessary future developments for a more thorough study, as well as the impacts that new emerging technologies can have on the analysis made in this dissertation.
2
L
ITERATURE
R
EVIEW
In the next section a simple comparison is made between the scenarios of the ETP17 and others produced by private companies such as Equinor and public organizations like the World Energy Council. This comparison is important in order to evaluate the different options and dimensions for the energy transition, according to different perspectives.
This subject already has had several studies which based on scenarios try to estimate the necessary future decisions that make sure there is enough supply for the various economic activities, such as the studies presented on Table 1 which will be detailed further in this section, The literature review is concluded with an overview of the most relevant environmental impacts associated to mining activities.
2.1
Brief overview of low carbon energy scenarios
The creation of low carbon energy scenarios is of most importance due to the real need to make the energy transition to a low carbon energy system happen. Energy scenarios provide a framework for exploring different paths into the future, including various combinations of technology options and their implications (UNDP 2000). As energy systems are of large proportions, changes in it are slow and require long time horizons. Scenarios are neither predictions nor forecasts but simple options or paths of how the future might unfold and the consequences of different choices. Energy scenarios are a useful tool for industry experts, government officials, academic researchers and general public for their policy-making, planning and investment decisions (Paltsev 2016). Some scenarios describe the trajectories that are required to drive the energy system towards a specific objective such as a particular atmospheric CO2 level (IEA, 2015), while some other scenarios look at the current policy development to stress that the current trajectory leads to some undesirable outcomes that need to be corrected with future policies (Clarke et al. 2014) (Paltsev 2016). “In scientific energy assessments, scenarios are usually based on an internally consistent, reproducible set of assumptions or theories about the key relationships and driving forces of change, which are derived from our understanding of both history and the current situation” (UNDP 2000). Energy is essential for our current society in all its forms, but electricity is expected to play the major role in our future energy system.
Besides the already mentioned IEA ETP scenarios there are other scenarios, namely from the World Energy Council (WEC) and Equinor. “Formed in 1923, the Council is the UN-accredited global energy body, representing the entire energy spectrum, with over 3,000-member organisations in over 90 countries, drawn from governments, private and state corporations, academia, Non-Governmental Organisations (NGOs) and energy stakeholders.” (WEC 2016)(WEC 2018). Other highly prominent scenarios come from Equinor (ex-Statoil) a Norwegian multinational energy company present in 36 countries, with 67% owned by the Norwegian state, that focuses mainly in fossil fuels (oil and natural gas), but it also has total or partial ownership of wind farms (290 MW in production)(Equinor 2018a). It was selected by Forbes magazine in 2018 as the 91st largest global oil and gas public company (Forbes 2018).
The report by Equinor “is published for the 8th consecutive year. It presents three scenarios; Reform, Renewal and Rivalry, that span a vast outcome space for all important characteristics of the global energy system, such as macroeconomic development, global energy demand, GHG emissions, energy mix and oil and gas markets towards 2050. The report shows how policy, technology and market conditions can move development in different directions, both desired and undesired” (Equinor 2018b). Reform build on recent and current trends within market and technology development, rather than policy support, to be the main driver of change. Renewal represents a future trajectory, supported by strong, coordinated policy intervention, that delivers energy-related emission reductions consistent with the 2°-target on global warming. Rivalry describes a volatile world, where development and policy focus are determined mainly by geopolitics and other political priorities than climate change.” (Equinor 2018b)
The report by WEC presents three scenarios: “Modern Jazz, which represents a ‘digitally disrupted,’ innovative, and market-driven world. Unfinished Symphony, a world in which more ‘intelligent’ and sustainable economic growth models emerge as the world drives to a low carbon future, and a more fragmented scenario called Hard Rock, which explores the consequences of weaker and unsustainable economic growth with inward-looking policies. All three scenarios have then been quantified using a global, multi-regional energy system model.” (WEC 2016)
The IEA presents very ambitious scenarios which estimate a growth in energy consumption, as well as in electricity sourced from renewable sources. The B2DS can be compared with the Unfinished Symphony scenario by(WEC 2016), which estimates that by 2060 a larger share of renewables in the electricity mix, but a total TWh generated of about 8,500 TWh lower than the IEA’s most ambitious scenario (B2DS)(WEC 2016). The Equinor’s best possible scenario regarding RES is called Renewal and has a 40% share of renewable energy and about 40,000 TWh of total electricity generation, by 2050 (Equinor 2018b)
Source Time
Frame Scenarios
Share of low carbon technologies in the overall electricity mix
World generated electricity in TWh IEA ETP 2017 2060 RTS 45% 53,429 2DS 74% 50,662 B2DS 78% 53,123
World Energy Council 2016 2060
Hard Rock 55% 44,914
Modern Jazz 60% 48,491
Unfinished
Symphony 81% 44,474
Equinor Energy Perspectives 2018 2050
Rivalry 23% 38,000*
Reform 30% 45,000*
Renewal 50% 40,000*
*aproximated values
The two scenarios compared with the ETP originate in very different organizations, with different views of future energy pathways. Both have into account some type of data per regions of the world, as well as data on electric vehicles sales, which makes them comparable to the scenarios used in terms of technologies covered. It was the objective of this short section to compare different energy scenario sources with source of the scenarios used. The are other energy scenarios which are not here presented and there is also more information than the one here presented. A deeper comparision should be done but it was out of this dissertation objectives and it is left as future developments.
2.2
Studies that assess material needs for low-carbon energy technologies
There are several studies that try to estimate and analyse the risks associated with the transition to a low-carbon energy system. Some focus on the global level such as (Roelich et al. 2014), (Öhrlund Isak 2012), (Elshkaki and Graedel 2013), (WWF 2014), (Grandell et al. 2016), (World Bank Group and EGPS 2017), (de Koning et al. 2018)) that will be further described in this section, while others focus their analysis at a regional level. This is case of the word on the following authors for the EU: ((Moss et al. 2011, 2013), (Blagoeva, Alves Dias, et al., 2016)). In this EU-wide analysis the authors consider as critical materials those which have a higher consumption than the production and/or reserves and a great importance for the energy transition. The next table summarizes the most relevant studies assessing materials needs for low-carbon-energy technology deployment.
Table 1 - Studies that assess the material needs for low-carbon technologies Authors End-year for the analysis Spatial scope Low-carbon energy technologies Materials Considered Most Critical by the authors I (Moss et al. 2011) 2030 EUROPE NUC, SPV, WO & WOF, CCS, BIO, T&D
Te, In, Sn, Hf, Ag, Dy, Ga, Nd, Cd, Ni, Mo, V, Nb, Cu, Se Pb, Mn, Co,
Cr, W, Yt, Zr, Te
Dy, Nd, Te, Ga, In
II (Dawkins et al. 2012) 2035 GLOBAL SPV WO & WOF EV & HEV
Li, Co, Nd, In, Te In, Te
III (Öhrlund I.
2012) 2030 GLOBAL
SPV, WO & WOF
Al, Ag, B, Cd, Co, Cr, Cu, Ga, In, Pb, Se, Si,
Sn, Te, Dy, Fe, Mn, Mo, Nb, Nd, Ni, Pr, Sm,
Tb, Zn
Ga, In, Se, Te, Dy, Nd, Pr, Tb IV (Elshkaki and Graedel 2013) 2050 GLOBAL
NUC, BIO, GEO, HYDRO, CSP,
SPV, WO & WOF
Ag, Al, Cd, Cr, Cu, Fe, Ga, Ge, In Mo, Ni, Pb, If, Te, Zn, Nd, Dy, Mg
Mn
Ag, Te, In, Ge
V (Moss et al.
2013) 2030 EUROPE
HYDRO, GEO, OE, EV, FC, ES,
EL
Li, C, Nd, Pr, Te, In, Sn, Pt Tb, I, Yt, Ge, Ga
Dy, Nd, Te, Ga, In, Eu, Tb, Y, Pr, C, Ge, Pt, Re, Hf
VI (WWF 2014) 2050 GLOBAL
SPV WO & WOF EV, EL, T&D
In, Ga, Te, Y, Nd, Ag,
Li, Co In, Ga, Te, Li, Co
VII (Blagoeva et
al. 2016) 2030 EUROPE
SPV WO & WOF
EV & HEV
Nd, Pr, Dy, Te Ag, In, Ga, if, Cu, Cd, Te, Li,
Co, C Dy, Eu, Tb, Y, Pr, Nd, Ga, Te VIII (Grandell et al. 2016) 2050 GLOBAL PV, CSP WO & WOF EV, ES, EL, FC
Ag, Nd, Pr, Dy, Tb, Yt, La, Ce, EU, Co, Pt, Ru,
In, Te
Ag, Te, In, Dy, La, Co, Pt, Ru
IX
(World Bank Group and EGPS 2017)
2050 GLOBAL WO & WOF,
SPV, ES
Al, Fe, Mo, Cr, Li, Ag,
Cu, Pb, In, Mn, Zn Not available
X (de Koning et
al. 2018) 2050 GLOBAL
SPV, WO & WOF
NUC, EV
Al, Cu, Cr, Dy, Fe, In, Li, Nd, Ni, Pb, Zn
Any unlikely to be a bottleneck
Note: SPV - Solar Photovoltaics; CSP – Concentrated Solar Power; WO – Wind Onshore; WOF – Wind Offshore; Hydro – Hydropower; GEO – Geothermal ; OE – Ocean Energy; CCS – Carbon Capture and Storage; NUC – Nuclear; EV – Electric Vehicles; FC – Fuel Cells; ES – Energy Storage; EL - Efficient Lighting
For quite some time, it has been investigated the issue of availability of raw materials to meet the needs of the world and/or its regions. An example is the study carried out in 1975 funded by the Department of Defence of the United States of America (Curtis M. Jackson and Dunleavy 1975). The study assessed the need of materials for 57 existing and emerging technologies at the time, eventually selecting six for further research. Of the selected technologies the authors concluded that two technologies presented problems due to the materials used: 1) Fuel Cells, because of the need for Platinum Group Metals (PGM) and 2) Superconductors, because of the need for helium, niobium, copper, nickel and chromium. (Curtis M. Jackson and Dunleavy 1975)
Critical raw materials (CRMs) are defined by the US Geological Survey as “Mineral commodities that have important uses and no viable substitutes, yet face potential disruption in supply” (USGS, 2017). The
European Commission, which has released the first list of CRMs in 2011, defines it in a similar way as “raw materials of high importance to the economy of the EU and whose supply is associated with high risk” without specifying if they are to be used in technology (European Commission 2010). With these two definitions it can be concluded that the main features that define a material as critical are supply risk and economic importance for the region and its industries.
After the adoption of the Raw Materials Initiative by the European Commission in 2008, the Joint Research Centre (JRC) published a report on the availability of raw materials for the energy transition to low-carbon technologies as portrayed by the EU SET plan (Strategic Energy Technology Plan). In this plan and report six energy technologies were considered: nuclear, solar PV and CSP, wind, bioenergy, CCS, transmission and distribution lines (European Commission 2015) (Moss et al. 2011). The objectives of the EU and of the SET plan are to reach 3 targets until 2020: 1) 20% reduction of CO2 emissions in relation to 1990, 2) 20% of gross of energy consumption from RES and 3) 20% reduction in primary energy consumption through energy efficiency measures. With the most ambitious scenario in mind, the authors selected materials that would require at least 1% of world production, which narrowed the initial list of 60 materials to 14.
To evaluate the criticality of each material the authors applied four criteria: - Likelihood of a rapid increase in worldwide demand;
- Limitations on the increase in annual production, within a short temporal space; - Supply risk on the exporting countries;
- The reserves available in the exporting regions;
Based on these four criteria the materials were categorized has having high, medium or low criticality. The study went on with the release of two other reports by the JRC. In the second report, released in 2013, the authors of the first added three electricity generation technologies to the previous six analysed in 2011 (Hydropower, Geothermal and Ocean energy), as well as other non-energy producing technologies, but also essential for the transition to a low carbon energy system (Fuel cells and Hydrogen, Electricity storage, Electric vehicles, Desalinization). This new report had into account not only the SET plan, but also the EU Energy Roadmap 2050, with the long-term goal of reducing greenhouse gas emissions by 80-95%, when compared to 1990 levels (European Commission 2012). Considering the new additional technologies in the 2013 report and a review of the six from the first report, the list of CRMs broadened from 5 to 14 materials considered of high criticality.
In 2016, the JRC published a new study, this time with a greater focus on wind energy, solar PV and on electric vehicles. In this study it was used a new methodology which relied on sets of indicators aggregated in two dimensions, upstream and downstream. This way it has in consideration multiple factors that may come into play in the future such as: mineral resources availability, current and potential mining/refining suppliers, EU reliance on imports, macroeconomic, environmental and geopolitical factors, recycling and substitution. The JRC three reports also have into account key mitigation aspects such as increasing the regional production, recycling and potential substitution of materials (Darina T. Blagoeva et al. 2016) With a focus on the global level, there has been an increased attention in recent years regarding the availability of CRMs for the low carbon energy technologies of the necessary energy transition. The World-Wide Fund for Nature (WWF) in partnership with consultancy company Ecofys released a report in 2014 regarding the issue of potential bottlenecks for the low-carbon energy technologies (WWF 2014). For this study, two scenarios were used, “The Energy Report” (TER) created by Ecofys and WWF and “New Policy scenario” (NPS) from the IEA. The TER estimates a global energy system based 95% on renewable energy and excludes CCS and nuclear energy by 2050. The IEA scenario is a business as usual (BAU) scenario that runs until 2035. From the comparison of these two scenarios, the WWF and Ecofys concluded that “many of the material bottlenecks for the TER scenario are not relevant for the NPS” and that “many of the material bottlenecks for the NPS are also not relevant for the TER scenario.” This is due to the differences
Indium, Gallium, Tellurium, Lithium and Cobalt. On the other hand, the NPS envisions an energy system still very dependent of fossil fuels and thus not as demanding of these materials.
Another work regarding the effect of material scarcity on low carbon energy technologies was developed by the Stockholm Environment Institute in partnership with the business leader’s initiative 3C (Combat Climate Change) (Dawkins et al. 2012). This study focused on wind and solar energy and on electric vehicles, following the IEA scenarios presented in the World Energy Outlook 2010 document and the World Economic Forum (WEF) scenarios presented in the Mining and Minerals Scenarios 2010. The authors identified five metals that they considered to be the most crucial to these technologies: cobalt, lithium, neodymium, indium and tellurium, and did a more in-depth analysis. In order to assess the criticality of each material, the research team used a calculator created by SEI which considered factors such as: demand of virgin ore, recycling, other demand, sub-technology mix and material use efficiency and the growth or changes in all this until 2035. It was concluded that of the five materials analysed, indium and tellurium presented a high risk of medium- and long-term supply shortage, while neodymium presented a medium risk in the medium term and a high risk in the long term. For lithium and cobalt, the results shown a limited risk of supply in the long term. With these results the group concluded that the solar technologies Cd-Te (Cadmium telluride) and CIGs (copper indium gallium selenide solar cell) are the ones which present the greatest risk. (Dawkins et al. 2012)
The study by STOA (Öhrlund Isak 2012) focuses only on wind and solar energy and concluded that eight of the elements (gallium, indium, selenium, tellurium, dysprosium, neodymium, praseodymium and terbium) may have its demand increase greatly due to the large deployment of photovoltaic cells and permanent magnet turbines. Other meaningful conclusions by the author were that there is a small capability of substitution of any of the eight materials, but a possibility of using other sub-technologies that do not require these materials. The author also calls to the attention of its readers that the recycling rate, at the time of the study, was less than 1%.
The work by (Elshkaki and Graedel 2013) also researched the materials required for electricity generation technologies at a global scale including, not only renewable energy technologies, but also the fossil fuel based technologies, such as coal , gas and oil. The study develops an estimate from 1980 until 2050 and has into account the efficiency of the technologies, their performance ratio, utilization rate, materials content, production capacity from primary and secondary sources and the possibility of substitution, as well as the inclusion of policy measures and of impacts of transitioning from fossil fuel technologies to low carbon technologies. This was possible due to the use of a multi-level dynamic material flow and stock model. It is also stated that the analysis is carried out on country and regional levels, but this data is not presented. The two authors concluded mainly that for all the metals needed for wind power there is no risk of supply bottlenecks constraining its long-term development. For the PV solar technologies, it was found out that silver, tellurium, indium and germanium create risks for the installation of the diverse thin film technologies that need each of these. The base metals (aluminium, copper, chromium, lead and iron) will present no pressure for the energy transition under the two scenarios used by the authors, with the exception of nickel, which requires an increase in production, although its demand in the short term can be fully met by secondary resources.
Using the TIMES model generator and the scenarios developed by the Intergovernmental Panel on Climate Change (IPCC) Fifth Assessment Report, the study by (Grandell et al. 2016) analyses the need for special metals for the installation of solar, wind, electricity storage, electrolysis, hydrogen storage, fuel cells, electric vehicles and energy efficient lighting until 2050 at a global scale. After analysing the global demand for fourteen materials (eight rare earth materials plus cobalt, platinum, ruthenium, indium and tellurium) this study concluded that silver used in solar photovoltaics and concentrated solar power is the main material at risk, since the model returned a demand for this material which is approximately 450% of total known reserves. Other materials at risk include tellurium, indium, dysprosium, lanthanum, cobalt, platinum and ruthenium. According to the authors some of these materials are not at risk of supply bottlenecks, even though all show consumption amounts larger than the estimated reserves and resources, since there is a large proportion that could come from secondary production already in place today. This is the case for
platinum. With this analysis, the authors concluded that the scenario considered is not attainable, at least with the current known technologies and metal resources.
One of the most recent reports regarding the issue of critical materials for low-carbon technologies was produced and released by the World Bank in 2017 (World Bank Group and EGPS 2017). Using three scenarios by the IEA ETP 2015 (2DS, 4DS and 6DS) the authors made projections for materials demand up to 2050. The report analyses aluminium, nickel, cobalt, copper, iron ore, lead, lithium, manganese, rare earth metals, cadmium, molybdenum, indium, silver, titanium and zinc with a special focus on wind, solar and energy storage batteries (including electric vehicles). It has a special aim to understand the implications the energy transition will have on resource-rich developing countries and does this by mapping the production and reserves of the above metals. It concluded that countries in South America are in an excellent position to supply other countries in terms of copper, iron ore, silver, lithium, aluminium, nickel, manganese, and zinc. Africa also has a good position regarding platinum, manganese, bauxite, cobalt and chromium, but the region that has the best position is Asia and specially China, with large reserves and production of the much-needed rare earth metals as well as all other, thus being able to compete with whole continents in terms of production.
The report is cautious in providing actual conclusions by saying that it is hard enough to make a prediction on the sub-technologies (or intra-technologies) that are going to be dominant or the market share that they will occupy, and that each of these sub-technologies has a different speciality metal attached. It goes as far as using the example of lithium showing that the market share of the Li-ion technology has a major impact on the overall demand. For example, variation in between Li-ion technology market share representing 30% of vehicles batteries, 40% of grid-scale storage and 33% of decentralised energy storage or representing 50% of each market creates a difference in world demand of about 20 million tonnes of lithium.
The most recent study reviewed in this dissertation comes from (de Koning et al. 2018) and considers all the available electricity producing technologies electric mobility according with 4 scenarios. This is one of the few studies which assesses, not only speciality materials, but also some of the so-called base materials (Al, Cu, Ni, Pb, Zn)). The materials analysed were aluminium, copper, nickel, chromium, indium, neodymium, dysprosium, lithium, zinc and lead, at a global scale. In this study the authors also investigate, besides the annual demand and supply for these materials, the historical growth rates of supply and known reserves. This is an approach that is useful, but may also be deceiving, as what happened in the past does not necessarily repeats itself in the future, particularly regarding non-renewable resources such as minerals. The study does not consider recycling of materials as a supply option which might make the total demand an overestimation. The conclusions that were made are that the demand required up to 2050 can be met through the historical growth rates of supply and reserves. Still, the demand for these eleven materials should grow by a factor of 3 – 4.5 compared with the year 2000. Other aspects that are called to attention are that while no bottlenecks are likely to happen for these eleven materials, the transition is an uncertain one which causes big investments on new mines of a high-risk character. Also, the time it takes to open new mines (average of 10 years), the lower ore grades and concerns about environmental impacts of mining might create obstacles not foreseen that could constrain material supply.
Independently of the source of the scenarios used in each of these studies, all agree that the main low-carbon energy technologies for this transition will be wind and solar energy. These two sources of energy are readily available, well studied and in constant improvement. But since they will be the backbone of this transition, and due to being variable intermittent electricity producers, it will be needed high amounts of installed capacity. This presents a problem as they are more metal intensive than current fossil fuel-based electricity plants and thus more materials will be needed.
(CdTe, CIGs and a-Si) and the use of rare earths in permanent magnets of electric vehicles and wind turbines. There is also some uncertainty on the future batteries features either for stationary electricity storage or for electric vehicles. Although lithium-ion batteries show the best current efficiency and life time, they are very energy- intensive to produce and difficult to recycle.
From all the studies reviewed it is understandable that the objective of this dissertation has not still been accomplished. That is, the objective of quantifying the required materials for the energy transition to a low carbon energy system per region of the world. This regional analysis helps to better assess the regions which present less supply risks and the regions which lack production of essential materials and are dependent on imports. Another gap observed in the current literature has to do with the environmental impacts and energy consumption required for the extraction of materials.
2.3
Overview of environmental impacts of the mining industry
The mining industry is responsible for a large number of environmental impacts and is a high consumption energy (mainly diesel and electricity) and water linked to the various activities of commencing and operating a mine (ELAW 2010). Figure 1 resumes the main stages common to all mines but excludes the operations of processing the material into a finished product.
Figure 1 - Stages of a mining project; Source: (ELAW 2010)
During stage I, a geologist selects a site with the most potential of having large size mineral deposits. During this exploratory phase deep, shallow holes (boreholes) are excavated by large machines which sometimes require the clearing of wide areas of vegetation in order pass through. These sites may not prove worthy of moving into the next phase in case the ore deposit is not big enough or if it is of a low ore grade. Once a high value site is found, the engineers start planning the mine development. This entails the planning of wide access roads or rail networks for machinery and transport of ore or finished product. There is also the need to plan other infrastructures, such as houses for the workers, processing plant, waste rock and tailings storage, water treatment plants etc. At this time, it is necessary to decide if the mine will develop on the surface or underground. In case the mine develops as an open-pit (surface) mine it’s necessary to remove vast amounts of rock which lays on top of the deposit (overburden/waste rock), as well as all the existent vegetation. As the open pit mine gets deeper it may sometimes hit groundwater tables or aquifers
Exploration
• Surveys, field studies, and drilling test boreholes and other; exploratory excavations;
Development
• Construction of access roads; • Site preparation and clearing;
Active mining
• Open-pit mining; • Underground mining;Disposal of overburden and waste rock
• Disposal of material on top to allow access to the metallic ore deposit;
Ore extraction
• Use of machinery,such as loaders, haulers, and dump trucks, which transport the ore to processing facilities usinghaul roads.
which requires that the water will be needed to be constantly pumped out of the mine, increasing energy the mine consumption. All the previous factors make this type of mining the most environmental destructive type. For an underground type not as much of waste rock needs to be removed as the access to the ore deposit is made through tunnels. This type of mine is much less environmental invasive, but a lot costlier, energy intensive and involves higher risks for workers such as risks of collapsing or quality of air inside the mine. After the mine has been built the ore extraction may commence and with it different environmental and social impacts, regardless to the type of mine being explored. A factor of great importance is the rehabilitation of the area and a return to its natural form. The problem is the mines operate for many decades and habitat restauration is very difficult, slow and costly process which gives no economic incentive to the prospectors of the closing mine.
Figure 2 - Most common impacts of mines construction and operation. Based on (ELAW 2010).
Large-scale mining projects have the potential to alter the global carbon budget in at least the following ways: (1) Lost CO2 uptake by forests and vegetation that is cleared in order for mining to begin; (2) CO2 emitted by machines consuming fossil fuels that are involved in extracting and transporting ore (e.g., diesel-powered heavy vehicles); and (3) CO2 emitted by the processing of ore into metal (e.g., by pyro-metallurgical versus hydro-pyro-metallurgical techniques). (ELAW 2010)
All operations of a mine create serious impacts in the surrounding areas and atmosphere. Mining is the backbone of our civilization and is not disappearing as an economic activity because some materials are not recycled, as for example lithium, and because of the increasing population (Kleijn 2012). When impacts cannot be avoided there is the need to mitigate them, regardless of them being of social, economic or environmental type. In a mine this is a true challenge but not impossible - it requires a complete assessment of future operations and impacts in order to plan ahead the actions required to reduce them. There is also the need to improve efficiency of energy consumption by improving machinery efficiency, to reduce the use of fossil fuels and instead use electricity from renewable sources (Norgate and Haque 2010)
The energy transition will most probably require a large share of the global materials annually mined which will potentially increase the overall production.
• Tailings leaching can contaminate surface and underground water bodys; Impacts on water
• Particles emissions, direct GHG emissions from machinery; Impacts on air
• Habitat destruction and desflorestation, noise and human movement; Impacts on wildlife
• Explosions, contamination by toxic materials, high land use and change; Impacts on soil
• Poor work conditions;
• Health issues and hazard dutties; Social impacts
3
M
ETHODOLOGY
The entire analysis was carried out on the basis of the IEA ETP 2017 scenarios. In order to evaluate the possibility of material supply bottlenecks, different variables had to come into play. The estimated installed capacity of electricity generation technologies, number of hybrid and electric vehicles and electricity storage capacity according to the three scenarios were retrieved from ETP data for the different regions, with some assumptions when necessary. The materials use factors were gathered based on similar studies and life cycle assessments of specific technologies. Annual production of each material was collected for the year 2016 and retrieved from the annual publication (WMD, 2016) published by the Federal Ministry of Sustainability and Tourism of Austria. With all the previous information it was possible to assess the materials which present a higher risk of supply for each region and the materials which currently do not present the necessary production level to satisfy the demand by energy transition to a low carbon energy system according to each scenario.
3.1
Methodological approach
The following steps were followed:
I. The new installed capacity was obtained for the different scenarios and for the time intervals 2014-2025, 2025-2030, 2030-2035, 2035-2040, 2045-2050, 2050-2055 and 2055-2060. It has been assumed that growth within each interval remains constant over time. It was also assumed that the end of life and replacement of the different technologies are already considered on IEA ETP scenarios. An average value of new capacity annually installed (GW/year) was attained by dividing the value for the interval by the number of years that composes it. The same process was held for each region of the ETP and for each low-carbon technology. For the stock of electric vehicles (EV’s) and battery storage capacity there was only data for the whole world in ETP 2017. In order to have a more complete quantification, it was necessary to distribute the data available across the considered regions. The stock of vehicles was thus distributed according to the share of total electricity consumption in transports stated for each region. The battery’s capacity was allocated according with the share of variable renewables (wind and solar) per region.
II. Based on the available literature, particularly similar studies and life-cycle analyses of specific technologies, material use factors associated to low-carbon technologies were obtained (tonne of material / GW capacity installed). When several values from different sources were found, it was chosen to use the average of all.
III. The data of the annual production of the materials quantified in this study were retrieved from the annual publication (WMD, 2016) published by the Federal Ministry of Sustainability and Tourism of Austria in cooperation with the International Organizing Committee for the World Mining Congresses (publicly available at http://www.world-mining-data.info). This source has been chosen among other available because: 1) it is possible to download a spreadsheet with all the necessary mineral commodities in different tabs; 2) it shows all values for 2016; 3) it shows information for all the producing countries; 4) all data is for mineral content. The exception to the use of this source occurred with Indium and Cement, as no values were available. In the case of Indium, the data came from the British Geological Survey (BGS, 2016) annual publication, and in the case of Cement from the United States Geological Survey (USGS, 2016) because BGS only has values for European countries. BGS and WMD follow a similar methodology and show the production for
all countries, which does not happen with USGS, that only shows the top producers and aggregates the remaining as “rest of the world”.
IV. To analyse the potential of supply bottlenecks across the different mineral commodities, it was necessary to obtain values of the world and regional mineral reserves. For this the only data available in the world is from USGS, and so it was the one used. Some inconsistencies in the data were found as sometimes there was only data for the reserves of a few countries and none for others that also produce the same minerals.
V. The data of the annual new installed capacity was multiplied by the materials use factors in order to estimate the total amount of materials required annually.
VI. The total amount of materials was then divided by the annual production of mineral commodities of each region and conclusions were taken.
VII. The theoretically energy consumption associated to the extraction of the estimated material needs was calculated for the ETP 2017 three scenarios by crossing data from two sources: one for the ore grades and the other an LCA of 3 mines, both further presented in the next sections.
VIII. An overall evaluation (ranking) was made on the basis of data from the different sources mainly IEA and WMD 2016. The author developed a set of seven indicators to compare the different studied regions regarding risk for bottleneck occurrences and materials imports.
IX. The indicators are:
i. Nº of materials NP – The number of materials not produced in the region, out of the 31 considered;
ii. Nº of materials > 100% - Number of materials for which the estimated amount required is equal or superior to all the production in 2016;
iii. Nº materials > 500% - Number of materials for which the estimated amount required is equal or superior to five times the production in 2016;
iv. Nº Reserves >100% - Materials which require more virgin material than the regional estimated reserves;
v. Growth installed capacity – Amount of new electricity capacity added to the region; vi. Growth electricity demand – Amount of electricity produced/consumed in the region; vii. Average global demand of each material – Estimated share of the total amount of
materials quantified of each region;
Each indicator has the value of 1 to 3 and the results presented are the average of the values obtained by each region in each indicator.in each of the three scenarios. Based on the sum of the grades (1-3) of each category, the different regions were ranked from 1-10 with the higher level representing a higher risk for bottleneck occurrences and materials imports.