Science and Information Technology Department
The loyalty of European tourists from a destination country
perspective
Ricardo Jorge Maria Correia da Silva
Dissertation submitted as partial fulfilment of the requirement for the degree of Master in Information Systems Management.
Orientador
Doutor Raul Manuel Silva Laureano, Professor Auxiliar, ISCTE-IUL
i
Acknowledgments
First of all, I would like to thank Professor Raul Laureano for his attention, advice, motivation and persistence. Without your support it would not have been possible to submit this project.
To the family, for the motivation and support given not only during the realization of the dissertation but throughout the entire academic course.
To friends, for the friendship and support given, making it possible to overcome all difficulties during the entire masters.
At last, I would like to thank everyone who, in one way or another, have contributed to this thesis. My sincere thanks!
ii
Resumo
O Mercado do turismo representa em muitos paises um peso significativo na sua economia. Contudo, este mercado tende a ser volátil e, deste modo, de forma a garantir uma sustentabilidade económica, é necessário garantir a lealdade dos turistas. A lealdade é influenciada pela satisfação sendo que esta é resultado de diferentes determinantes ao longo da viagem.
A possibilidade de verificar quais turistas mais leais permite que as agências de turismo, assim como as organizações governamentais posicionarem e alterarem a sua estratégia de forma a potencializar e aumentar a lealdade dos turistas.
De forma a avaliar a lealdade dos turistas, foram realizadas diferentes análises e tecnicas de data mining de forma a verificar quais os turistas mais leais, e quais os tipos de lealdade existentes. Foi ainda criado um modelo preditivo de forma a avaliar a influência das variaveis sócio-demográficas na lealdade dos turistas.
Para tal foram utilizados dados de três anos concecutivos (2014, 2015 e 2016), referentes aos dados do Flash Eurobarometer, de um modo específico, utilizando o questionário “Preferences of European toward tourists”, onde foram estudados dados referentes aos turistas da Europa 28.
Através das tecnicas mencionadas, foi possível verificar quais os turistas mais ou menos lais assim como prever o destino de férias dos turistas. Por fim, foi ainda possível ver o impacto das caracteristas socio-demográficas na lealdade dos turistas e qual o seu peso.
iii
Abstract
Tourism market represents in many countries a significant weight in its economy. However, this market tends to be volatile and, in order to ensure economic sustainability, it is necessary to ensure the loyalty of tourists. Loyalty is influenced by satisfaction and it's a result of different determinants along the trip.
The ability to analise which tourists are more loyal allows tourism agencies as well as government organizations to position and change their strategy in order to boost and increase the loyalty of tourists.
To evaluate the loyalty of the tourists, different analyzes of data mining techniques were carried out to verify the most loyal tourists, and the type of loyalty. A predictive model was also created in order to evaluate the influence of socio-demographic variables on the loyalty of tourists.
In order to do so, it was used three-year data (2014, 2015 and 2016) for the Flash Eurobarometer, in a specific way, using the "Preferences of European toward tourists" questionnaire, where were studied data from Europe 28.
Through the techniques mentioned, it was possible to verify, which tourists are the most loyal and which are the least, as well predict the holiday destination of the tourists. Finally, it was still possible to see the impact of socio-demographic characteristics on the loyalty of tourists and their weight.
iv
Index
Chapter 1 - Introduction ... 1
1.1. Theoretical background and motivation ... 1
1.2. Problem and research objectives ... 4
1.3. Methodology ... 5
1.4. Structure ... 5
Chapter 2 – Literature review ... 6
2.1. Tourism - Concept and relevance ... 6
2.2. Loyalty ... 7
2.2.1. Concept and Evolution ... 7
2.2.2. Loyalty Phases ... 7
2.2.3. Micro vs Macro Loyalty Levels ... 8
2.2.4. Destination Loyalty ... 9
2.3. Loyalty determinant’s – Travel Phases ... 10
2.3.1. Pre-Travel ... 10
2.3.2. On travel ... 12
2.3.3. Post-travel ... 14
Chapter 3 - CRISP-DM ... 16
3.1. Business understanding ... 16
3.2. Data understanding and preparation ... 17
3.3. Modelling ... 24
Chapter 4 – Ressults and Discussion ... 26
Chapter 5 – Conclusion and Limitations ... 38
5.1. Conclusions ... 38
5.2. Contributions ... 38
5.3. Limitations of the Research ... 39
5.4. Further Research ... 39
References... 40
v
List of Tables
Table 1 - Nationality ... 19
Table 2 - Distribution of the socio-demographic characteristics ... 20
Table 3 - Distribution of the occupation related characteristics ... 21
Table 4 - Holidays Taken Last Year ... 22
Table 5- Holidays plan this year ... 23
Table 6 - Predicting models to classify loyalty using CART algorithm ... 24
Table 7- Predicting models to classify loyalty using CHAID algorithm ... 25
Table 8 - Crosstable - Holidays taken last year x Holiday plan this year. ... 27
Table 9 - Distribution of country type visited and to visit ... 28
Table 10 - Distribution of loyalty related chacacteristics ... 29
Table 11 - Distribution of country type to visit this year by country type visited last year ... 29
vi
List of Figures
Figure 1 - Hypotethital evolution of a tourist area. (Butler, 1980) ... 2
Figure 2 - ROC for the different CART models ... 30
Figure 3 - Gains chart for the different CART models... 30
Figure 4 - ROC for the different CHAID models ... 31
Figure 5 - Gains chart for the different CHAID models... 31
Figure 6 - Predictor importance of loyalty ... 36
Figure 7 - Distribution of the predicted loyalty by nationality ... 36
Figure 8 - Distribution of the predicted loyalty by nationality region... 37
vii
List of Abbreviations
AUC – Area Under The Curve
CART - Classification and Regression Trees
CHAID - Chi-square Automatic Interaction Detector
CRISP-DM - Cross Industry Standard Process for Data Mining EU – European Union
GDP - Gross domestic product LOS - Length of stay
ROC - Receiver Operating Characteristics
SPSS - Statistical Package for the Social Sciences UNWTO - United Nation World Tourism Organization
1
Chapter 1 - Introduction
1.1. Theoretical background and motivation
Many European countries are nowadays dependent on tourism, such as Portugal, Malta and Greece. For instance, in Portugal, tourism has been increasing sharply and in the first half of 2017 it was registered a growth of 20% over the previous year (Turismo de Portugal, 2017), with tourism weighing around 5.8% of GDP (World Travel & Tourism Council, 2017), numbers that show its importance.
The concept of tourism has evolved over the years. The first definition of tourism was made by Guye and Feuler in 1905. The authors defined Tourism as “a phenomenon which
is dependent on the people’s increasing need for a change and relaxing, the wish of recognizing the beauties of nature and art and the belief that nature gives happiness to human beings and which helps nations and communities” (Esen & Uyar, 2010).
However, the definition has undergone significant transformations and the reason, the length and the satisfaction of the trip have become important factors to be considered as well. Nowadays the definition has been unified by the World Tourism Organization as “a
social, cultural and economic phenomenon which entails the movement of people to countries or places outside their usual environment for personal or business purposes”
(UNWTO, 1994:4-5).
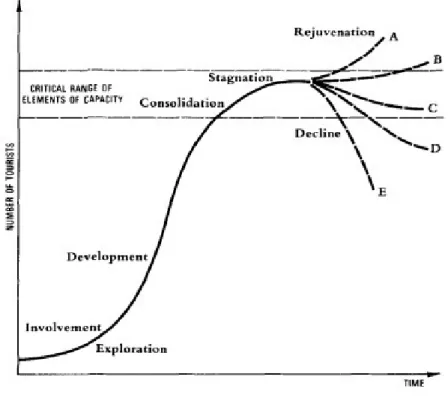
Turism develops in three stages: i) discovery, ii) local response and initiative, and iii) institutionalized ‘institutionalization. It is also explicit in Christaller’s concept that types of tourists change with the tourist areas (Butler, 1980).
To explore the evolution of tourist areas, a recognizable cycle using a basic S curve is presented to illustrate their waving and waning popularity. There can be no doubt that tourist areas are dynamic, that they evolve and change over time. There are a variety of factors which are responsible for the initial popularity of the area. including changes in the preferences and needs of visitors, the gradual deterioration and possible replacement of physical plant and facilities, and the change (or even disappearance) of the original natural and cultural attractions. In some cases, whilst these attractions remain, they may be utilized for different purposes or come to be regarded as less significant in comparison with imported attractions (Butler, 1980).
According to Christaller (1963), the first people to discover a place are usually the painters. In search of art and inspiration, painters are the pioneers and, gradually, the place
2 develops as a so-called artist colony. Soon, a cluster of poets follows, kindred to the painters, then cinema people, gourmets, and the jeunesse dorde.
The place becomes fashionable and the entrepreneur takes notice. They capitalize on the good name of this former painter’s corner and on the gullibility of tourists. Finally, tourist agencies come with their package rate travelling parties; Now, the indulged public avoids such places. At the same time, in other places the same cycle occurs again as more and more places become fashionable (Christaller, 1963).
Figure 1 represents an evolution based on the number of tourists over time. When some areas reach the Stagnation stage it can be ascertained that the peak numbers of visitors will have been reached. Capacity levels for many variables will have been reached or exceeded, with attendant environmental, social, and economic problems (Butler, 1980).
As we can see in Figure 1 there are different ways that the curve can follow up. To explain the different hypotheses, a phase of decline and one of rejuvenation will be exposed.
Figure 1 - Hypotethital evolution of a tourist area. (Butler, 1980)
In the rejuvenation phase the existence of a change in the tourism attractions that the place is based is implicit. In this case it is important to explore different areas that nowadays are not explored either by creating a new attraction or by exploiting natural resources that were not yet explored. Nonetheless, a new way of presenting to tourists is
3 necessary. If the country does not have the capacity for this transformation it will result in a phase of decline.
As mentioned, the alternative is the decline stage and that means that the country is not able to compete with the new attractions provided by other countries. That will result in a declining market, both spatially and numerically. As countries change many factors could affect the cycle of tourism area. So, either because there was a terrorist's attack that leads to a lack of tourists, a major event such as web summit that brings people all around the world to visit and explore the country or the creation of a resort that creates the facilities needed for the country's next phase, countries must have the ability to stand out from the others to ensure the loyalty of tourists.
Tourism loyalty is the key to understand what makes a tourist return to a destination that he likes and this concept is especially important to the companies that are responsible for tourism marketing and tourism management, so they can understand and go after the tourist’s needs. To avoid entering a phase of decline, there are different determinants that can influence a person to return to their destination country.
The literature about loyalty and its determinants is focused on a micro level, such as loyalty to a hotel (Kandampully, 2000) or a cultural (Kim, Suh & Eves, 2010) or sporting event (Gedenk Neslin, 1999). Thus, in the current competitive context between countries, loyalty analysis should also focus on a macro level, that is, at the countries level or even at the continents level where studies are scarce (Talib, et al. 2015).
Morevoer, the existing studies tend to be based on small samples with data collected through a questionnaire (Kozak & Rimmington, 2014) and are often limited to verifying hypotheses stated by theories through statistical techniques in a new context (Kozak & Rimmington, 2014). By expanding the data universe to the European tourists, it becomes possible to recover different techniques of data mining and to extract useful and new knowledge for the different tourism stakeholders.
4
1.2. Problem and research objectives
Thus, it is essential for countries not only to gain new markets (tourists), but also to ensure the loyalty of their tourists to the country. Having established this, a new problem arises of how to increase the level of loyalty to the country in an extremely competitive European context.
Faced with this problem, the following objectives are defined, O1. Identify pairs of countries visited in consecutive years. O2. Evaluate loyalty to one's country, foreign country, or both.
O3. Identify socio-demographic characteristics that may explain loyalty, i.e., identify profiles of loyal tourists.
In order to achieve these objectives, this research aims at European tourist’s behaviour (EU 28) in light of a certain experience in each country to ascertain whether they would return to the same country the following year. This is a theme to be associated with different socio-demographic characteristics to evaluate if tourists coming from a certain country have more tendency to return to the same destination if they have an enjoyable experience or not.
This study allows tourism professionals access to new knowledge to collect information in order to optimize their own advertising to reach the desired people. Additionally, in a scientific approach, the study, based on a sample of thousands of European tourists, will allow us to evaluate the data mining techniques that produce the best results at the level of a new context (loyalty to the destination country) and, in parallel, it allows analysis of loyalty in a broader European context which may or may not confirm some predictive models of loyalty (obtained at micro level).
Lastly, the study will identify differences between countries, both origin and destination, which will allow each to know the reality of the others and position itself in the best way to attract more people to visit the country.
As mentioned, the alternative is the decline stage, and which would mean that the country is not able to compete with the new attractions provided by other countries. That will result in a declining market, both spatially and numerically.
5
1.3. Methodology
This research used the CRISP-DM (CRoss-Industry Standard Process for Data Mining) methodology, which is composed of six phases: business understanding, data understanding, data preparation, modelling, evaluation, and deployment (Chapman et al., 2000).
In the business understanding phase, the goal is to evaluate what leads tourists to be loyal to the country of destination. This analysis has the aim of understanding what leads tourists to become more loyal. In particular, widentify profiles of loyal and non-loyal tourists
Given that the data from Eurobarometer (European Comission, 2015) is available and not appropriately studied and the expensive and time-consuming nature of the activity of data collection, this study uses the data collected by the Eurobarometer from tourists of 2014 to 2016 in the 28 countries in the European Union.
In the second phase of CRISP-DM – data comprehension – 630 attributes collected from 90.101 European tourists were analysed and included in the Excel database. Given the size of the data, it is also necessary to prepare it and transforme it to reach the outcome.
In the modeling phase different analyses were carried out using contingency tables, the apriori model and classification trees. During this phase, all the variables considered to be eligible were tested to assess the loyalty of European tourists. The models were evaluated in the fith phase of the methodology.
In the last phase, deployment, the intention is to present this dissertation and its results to the tourism loyalty by presenting it in conferences and also publishing it in scientific papers.
1.4. Structure
This dissertation follows a traditional structure. In addition to this introduction, it contains four other chapters. Chapter 2 – Literature Review – includes an overview of tourism, together with pre, during and post-travel tourist behaviour, loyalty with destination and with accommodation and a summary of the studies found. In chapter 3 – Methodology – the CRISP-DM methodology is described, with emphasis on the comprehension, preparation, modelling and evaluation phases. In chapter 4 – Results – the findings are presented and discussed. In chaptper 5 – Conclusions – the conclusions are described focusing on contributions and study limitations.
6
Chapter 2
– Literature review
2.1. Tourism - Concept and relevance
The first step is to analyse the meaning of tourism and tourist to understand what leads a person to be loyal to a holiday destination. When reviewing the literature, it was verified the existence of a resemblance between trust, satisfaction and loyalty (Vieira, 2016), so it is necessary understand their differences and issues before the data analysis.
Tourism, according to the dictionary, is “the commercial organization and operation
of holidays and visits to places of interest". The word emerged late in the era of the grand tour, English wealthy classes whereby young men were dispatched on extensive circuits of continental Europe to finish their education. Its roots include the Greek term for a tool used to describe a circle, reflected in the essential feature of tourism, returning to the point of departure (Leiper, 1979).
Travelling has always been an intrinsic feature of the human being. The first civilizations would travel to seek food and shelter and, with the evolution of society, travelling started to have as objective prominent but became limited to trade, pilgrimage, studies, migration, royal affairs and exploration.
The first definition of tourism emerges in 1905 and referes to tourism as “A
phenomenon unique to modern time which is dependent on the people’s increasing need for a change and relaxing, the wish of recognizing the beauties of nature and art and the belief that nature gives happiness to human beings and which helps nations and communities’ approaching to each other thanks to the developments in commerce and industry and the communication and transportation tools’ becoming excellent” (Esen &
Uyar, 2010).
The term tourism suffers a lot of changes with the passing of the years and in 2000, the World Tourism Organization, The Commission of the European Communities and the United Nations in a first attempt to unify the term tourism, defined this as “an activity
that comprises other activities of persons traveling to and staying in places outside their usual environment for not more than one consecutive year for leisure, business and other purposes" (World Tourism Organization, 2001).
In 2005, the World Tourism Organization succeded in unifying the definition in order to prevent missunderstandings, so, nowadays the tourism is defined as “a social, cultural
7
and economic phenomenom which entails the movement of people to countries or places outside their usual enviorment for personal or business purposes. These people are called tourists and tourism has to do with their activities and experiences” (UNWTO, 2018).
2.2. Loyalty
2.2.1. Concept and Evolution
The concept of loyalty has been evolving over the years. In general, loyalty is defined by the repetition of purchase, either at the frequency level or by the quantity of products of the same brand acquired. Loyalty is defined by Oliver in 1999 as a commitment to repurchase a product or service consistently in the future. This causes a repetitive set of purchases of the same brand and set of brands, regardless of all influencers (positives or negatives) and all marketing companies that should influence the consumer's buying decision. That definition leads to an existence of loyalty phases and different ways that loyalty could affect the behaviour of the people (tourists).
2.2.2. Loyalty Phases
Oliver’s framework (Oliver, 1999) follows a model divided in a cognition, affect, conation, nonetheless, it is different in measure, according to the point of view, however, in a different approach, according to their point of view, each tourist becomes "loyal" in a phased way and is influenced by different factors that directly change their behavior. In this study, tourists from different countries may be affected in different ways, based on their cultures and quality of life. According to Oliver, consumers are influenced to become loyal in a cognitive sense first, consecutive in an affective sense, afterward in a conative manner, and eventually in a behavioural manner, which is described as "action inertia."
The first phase, denominated as cognitive loyalty, is based on brand advertising (or referring to the case study, a country). This stage is called cognitive loyalty or loyalty based only on brand belief. Cognition can be based on information acquired either directly or indirectly including information based on recent experiences (Oliver, 1999). In this case loyalty is associated with a feeling of satisfaction and a good performance that leads to a habit.
Affective loyalty is the second phase of loyalty profess, in this case a person has been evolving a satisfaction sensation towards and a brand or a country due to a series of good
8 experiences. Loyalty at this stage is still very much conditioned by the number and type of alternatives available (Sambandam & Kenneth, 1995). Commitment at this stage is referred to as affective loyalty and this is seen in the minds of consumer consumers with a feeling of cognition and affection. Considereing that cognition is directly subject to counter argumentation, affect is not as easy to change the opinion.
Loyalty in this case is directly related to an existing appreciation of the brand or country. However, like cognitive loyalty, it is still very volatile and susceptible to competition and different alternatives. In fact, many of the people who end up leaving the mark at this stage, define their experience as positive and were even satisfied with the product. In this way a level of commitment would be preferable, thus guaranteeing a greater loyalty (Oliver, 1999).
Cognitive loyalty is related to desire and is the phase after affective loyalty. At this stage loyalty is influenced by episodes of satisfaction and affection regarding the brand. The concept of cognitive is related to a desire, in this case the purchase of the brand or return to the country that one liked. Cognitive loyalty is associated with a desire to purchase a product and this wish is stronger than in affective loyalty. However, despite its intent to purchase this may be unfulfilled, with room for a deeper level of commitment (Oliver, 1999).
Action loyalty is the study of the mechanism by which intentions are converted to actions and its is referred to as "action control" (Kuhl and Beckmann 1985). All previous loyalty phases are reflected in the fact that the consumer is ready to go back and bought the product (in this case study, that the tourist is willing to return to the country), however, if alternatives appear, they can cause the consumer loses brand loyalty. It is necessary that loyalty reaches a level where, regardless of the obstacle, the consumer re-acquires the product or the service. Action loyalty is perceived as a necessary result of the engagement of these three states. If this commitment is achieved, an inertia of action develops, which leads the consumer to repurchase.
2.2.3. Micro vs Macro Loyalty Levels
Loyalty research into brand loyalty and/or consumer loyalty dates back well more than 40 years. According to Jacoby and Chestnut (1978), its history extends back to Copeland’s (1923) study on a phenomenon that he labelled as “brand insistence.”
9 Generally, there are two different approaches to loyalty: A micro level one where the focus is on a brand, a space and/or an influence maker; A macro or aggregate level one where the focus refers-to a big company (Jacoby & Chestnut, 1978)
There are different analyses at a micro level, either in a hotel, in a event or even in a unique country. However, in a macro concept where the concept of loyalty is related in a country of destination perspective, there are a lack of studies.
2.2.4. Destination Loyalty
As mentioned, repeat purchases or recommendations to other people are most usually referred to as consumer loyalty in the marketing literature (micro level). The success of a marketing campaign is directly related to the level of loyalty that consumers reach. (Flavian, Martinez, & Polo, 2001).
Similarly, travel destinations can be considered as products, and tourists may revisit or recommend travel destinations to other potential tourists such as friends or relatives.
However, the study of the usefulness of the concept of loyalty and its applications to tourism products or services has been limited, even though loyalty has been thought of as one of the major driving forces in the competitive market (Dimanche & Havitz, 1994).
In the last decade, tourism and leisure researchers have incorporated the concept of consumer loyalty into tourism products, destinations, or leisure/recreation activities (Backman & Crompton, 1991; Baloglu & Mangaloglu, 2001; Mazanec, 2000; Pritchard & Howard, 1997; Selin, et al, 1988).
Usually, loyalty is categorized in the following ways: (1) the behavioural approach, (2) the attitudinal approach, and (3) the composite approach (Jacoby & Chestnut, 1978). The behavioural approach is related to consumers’ brand loyalty and has been characterized as frequent purchase or probability of purchase. The measurement of this approach lacks a conceptual standpoint and does not attempt to explain the factors that affect customer loyalty. Namely, the desire to revisit or recommend a country to other potential tourists, may not be fully explained in full by loyalty. (Dick & Basu, 1994).
The attitudinal approach is based on consumer brand preferences or intention to buy and consumer loyalty and it is related to the loyalty phases described by Oliver (1999). This approach relates loyalty in terms of psychological commitment.
10 In the field of tourism, this refers to cases in which the image that the tourist has on a country is not the best, but the tourist continues to have a desire to visit it (Backman & Crompton, 1991).
Lastly, the combination or composite approach is a confluence between the attitudinal approaches and the behaviour approach (Backman & Crompton, 1991). Usually, it is recognized that customers who purchase and have loyalty to particular brands must have a positive attitude toward those brands. This approach has limitations and even some researchers have discounted only the behavioural or attitudinal approach and have suggested integrating the two (Backman & Crompton, 1991). Thus, the reviewed literature suggests that it is necessary to build a relationship of satisfaction and motivation around the client so that there is a bond of loyalty (Isoraité, 2016).
2.3. Loyalty determinant’s – Travel Phases
2.3.1. Pre-Travel a. Tourist
A classic example deals with the terms used to denote persons who travel. While words like “, traveller”, “visitor”, “passenger”, and “guest” may connote indifferent, acceptable or positive meanings, the term “tourist” often connotes a rude, humorously dressed, misbehaving, unsophisticated oaf tangled in the straps of a camera. While most people who are traveling to places outside of their own home environments willingly label themselves as travellers, guests, or visitors, they seldom call themselves “tourists” reserving the term for other people (D. Hunt & Layne, 1991).
A tourist is an individual “who travels for a period of 24 hours or more in a country
other than that in which he usually resides” (Shaw & Williams, 2009).
b. Personal Characteristics
The personal characteristics of the tourist, such as place of residence, age, income, level of education, place of residence, personal motivation to travel, previous visit experiences, gender and marital status are important factors to determine satisfaction (Ragavan, Subramonian & Sharif, 2014; Sarra, Di zio & Cappucci, 2015; Lu et al., 2015).
The income has influence in motivations and satisfactions of tourist. Acording to Jarvis et al. (2016), a person with a higher income tend to me more satisfaied with their trip. On the other hand, Lu et al. (2015) concluded that regarding with travel motivations and
11 tourist satisfaction, income has a negative influence which means that a higher income leads to a lower level of travel motivations and satisfaction.
Travel motivations have a positive correlation with shopping behaviour and satisfaction, which means that a tourist, motivated to travel, will have a higher consumption of products/experiences and a higher satisfaction too (Lu et al., 2015).
Motivation has been referred to as psychological/ biological needs and wants, including integral forces that arouse, direct, and integrate a person’s behavior and activity (Dann, 1981; Woo, Et al, 2011).
In tourism research, this motivation concept can be classified into two forces, Push and pull motivations (Dann, 1981). Push motivations are related to the tourists’ desire, while pull motivations are associated with the attributes of the destination choices (Cha, McCleary, & Uysal, 1995; Crompton, 1979; Dann, 1981; Woo, Et al, 2011).
Push motivations are related with the desire for rest and relaxation, the sensation of escape, in search of prestige, fitness and healt, social interacions and adventure, exicetment and family (Crompton, 1979).
Pull motivations explores the destination’s attractiveness, such as cultural, nature or commerce such as shopping, parks, beaches, recreation facilities, cultural attractions, entertainment, natural scenery.
Studies have proven that push and pull motivations have been primarily utilized in studies of tourist behavior. The discoveries and issues undoubtedly play a useful role in attempting to understand a wide variety of different needs and wants that can motivate and influence tourist behavior.
For tourism companies maximize, the loyalty of tourists requires careful management of points of interest and all factors related to the image of the country thus ensuring the satisfaction of tourists.
c. Destination Image
Destination Image constitutes as an overall impression with some emotional condition (Oxenfeldt, 1974). That impression is a perceptual phenomenon that turns up in consumer’s emotional interpretation with cognitive and affective components.
Destination image is an interactive system of thoughts, opinions, feelings, visualizations, and intentions toward a destination (Költringer & Dickinger, 2015; Tasci
12 & Gartner, 2007). An overall or composite result from interactions between these consumer choice attitudes (Lin, et al, 2007; Pike & Ryan, 2004).
Destination image influences tourists in the process of choosing a destination and revisiting the destination in the future (Hosany & Prayag, 2013; Zeugner-Roth, Diamantopoulos & Žabkar, 2015).
The concept of destination image is related with destination loyalty. It also has been operationalized as consisting of two components: a perceptual-cognitive component that captures knowledge and beliefs about a destination’s attributes and an affective component that describes feelings toward a destination (Beerli & Martín, 2004).
The cognitive and affective components work to influence the overall image of a destination in the mind of past or prospective tourists (Baloglu & McCleary, 1999). Cognitive and affective image, with some of the cognitive components influencing the affective and overall image perceptions, suggest that cognitive image components are not evaluated all the same.
d. Word-of-Mouth
Word-of-Mouth is defined as “informal communication between private parties
concerning evaluations of goods and services” (Anderson 1998).
Word-of-mouth happens in the context of a specific situation (Allsop, Bassett, and Hoskins, 2007) and may contain both cognitive and emotive elements (Sweeney, Soutar, and Mazzarol, 2012).
The impact of word-of-mouth could be tremendous because consumers who have not experienced a product or service will to be credible and trustworthy coming from an experienced personal source (Allsop, Bassett, and Hoskins, 2007). It has been shown to be the information source most frequently used by tourists (e.g., Andereck and Caldwell 1994; Bieger and Laesser, 2004) and is therefore of critical importance to tourism destinations and businesses.
2.3.2. On travel a. Frequency
Frequency, in this context, is the amount of travelling that a person does in a year. The number of trips carried out in a year usually varies between one and thirty trips per year, and in the case of travel, these tend to travel three times a year (Losada et al., 2016).
13 Available time, gender and economic status are the main characteristics that influence the frequency of travel. Studies say that, in terms of gender, the elderly women travel more frequently than men. This result may be related to the greater number of women in the third idea and the growth of female independence in the last decades (Vieira, 2016). Refer to the financial advice, and fulfilling the specs, people with more money tend to make more trips. Simultaneously, people with more available time tend to travel more (Losada et al., 2016).
b. Length of Stay
Duration or Length of stay (LOS) is the time (in days) that tourists stay travelling, i.e., staying in a place different than their homes. There are differente atributions and caharacteristics that influence de Length of Stay, such as travel cost, nationality, socio-demographic characteristics and destination attributes (Peypoch et al., 2012).
c. Behaviour
To adquire travel experiences, products or services are influenced by Tourist behaviour who represent tourist personality and characteristics. According to Gazley and Watling (2015) the fact that a person travels directly influences his behavior. People while travelling try different experiences, such as, meeting different people, going to an unusual kind of events, try new food and normally enjoying knowing and experience the host culture.
The behaviour is also influenced by the way a person expresses feelings and this is essentially shaped by experiences during the journey. Self-expression can influence behavior and is different from person to person.
People who loves to share their achieving at the travel to themselves and to others tend to be more self-expressive. Tourists who are less self-expressive will travel more and will not be concerned about acquiring products or experiences with the intent of showing others (Gazley & Watling, 2015).
A person who is more self-expressive tends to constantly be having different experiences and is less interested about the meaning of products and experiences they consume.
14 2.3.3. Post-travel
Trust and consumer satisfaction are the seeds for behavioral loyalty not only because they increase attitudinal loyalty in a high-involvement, high-service product market but also because they directly or indirectly persuade the consumer to invest in specific assets. Marketers should not count on satisfaction alone to induce consumers to invest in specific assets. Loyalty programs and properly trained personnel are but two examples. In the future, database assets may prove critical. Marketers can build up a consumer database to accumulate data on past usage, purchases, complaining behaviours, and returns (Vieira, 2016).
a. Satisfaction
The tourism experience is unique, emotionally charged, and with a high personal value (McIntosh & Siggs, 2005). Companies and Governaments should provide unforgettable, satisfactory, and extraordinary experiences to their customers (Nikolova & Hassan, 2013).
The uses of satisfaction, to evaluate past consumer experience, are the performance of products and services, and the perceptions of the physical environment such as a neighbourhood and tourist destinations in the tourism context (Ekinci, Preciado e Sirakaya-Turk, 2013; Ross & Iso-Ahola, 1991).
There is no definition of satisfaction derived from the fact that researchers are unable to reach a consensus on it. Yet this is usually associated with a feeling, affective and evaluative that evolves according to your experience of the product (Wu, 2015).
Oliver (1997) defines satisfaction as “the consumer’s fulfilment response, the degree
to which the level of fulfilment is pleasant or unpleasant”. In a meta-analysis performed
for satisfaction, Geyskens et al. (1999) found that this construct is the most popular one among empirical investigations of channel relationships. According to Ruekert and Churchill (1984), the construct of satisfaction is of key importance in understanding channel relationships that lead to loyalty.
Satisfaction is a cumulative construct that includes not only satisfaction with a specific product, service or travel experience but also with the various aspects of the organization, such as the physical facilities and the interaction with employees. Moreover, satisfaction is positively related to trust (Anderson & Narus, 1990). According to Michell, Reast, and
15 Lynch (1998), satisfaction is the foundation of trust. In this study satisfaction is releated not only with trust but also with loyalty.
b. Thrust
Trust has been defined as: (1) a set of specific beliefs dealing primarily with the integrity, benevolence, and ability of another party (Doney & Cannon, 1997); (2) a general belief that another party can be trusted (Gefen, 2000; Hosmer, 1995), sometimes also called trusting intentions (McKnight, Cummings & Chervany, 1998) or "the willingness' of a party to be vulnerable to the actions of another" (Mayer, Davis & Sshoorman 1995); (3) the effect reflected in “feelings” of confidence and security in the caring response of the other party (Yee, 2004).
Despite the different definition of trust that exist in the past literatures, according to Gefen et al (2003), the conceptualization of trust is seen as a set of specific beliefs which includes integrity, benevolence, ability and predictability to be applied in e-commerce, specifically online shopping context. The definition is aligned with the past literatures where it has been widely used in studies related to ongoing economic relationship dealing with buyer-seller and business interactions (Yee, 2004).
In consonance with the definition of trust of Gefen et al. (2003), Lin and Wang (2006) who conducted their study in the m-commerce context have adopted the same view by defining trust as a set of specific beliefs dealing primarily with the integrity (trustee honesty and promise keeping), benevolence (trustee caring and motivation to act in the truster’s interest), competence (ability of trustee to do what the truster needs) and predictability (trustee’s behavioral consistency) of a particular m-vendor (Yee, 2004).
16
Chapter 3 - CRISP-DM
3.1. Business understandingAs mentioned in the literature review, the loyalty of tourists is influenced by satisfaction, and this, in other hand, is determined by different factors, whether be in pré-travel or on pré-travel phase. Moreover, the socio-demographic characteristics of tourists may be associated to the loyalty type.
With that, it is extremely important to the tourism companies to have this knowledge and try to predict where tourists will travel. In addition, there are several countries that have a high dependence on tourism which has a high impact on the local economy.
Therefore, the data studied is from Flash Eurobarometer 414 “Preferences of Europeans towards tourism 2015”. Moreover, only the tourists from EU who travelled at least once from 2014 to 2016.
Regarding the business goals, the first one is evaluate the loyalty of European tourists to the country of destination in a global prespective. The second objective is to identify profiles of loyal tourists with respect to their destination country. These two objectives allow travel agencies and Nacional organisms to better comprehend the travel preferences of the tourists and to develop better marketing campaigns promoting the destination.
In order to identify profiles of European tourists in a Big data prespective, it was necessary to gather the data collected in the different years, as well as to select the valid answers for analysis based on a treatment of variables and a filtering of answers. Finally, different classification algorithms or parametrizations should be tested in order to extrat useful knowledge.
The resources to be used are the IBM SPSS Statistics (v. 23) and the IBM SPSS Modeler (v. 18.).
17
3.2. Data understanding and preparation
As mentioned before, the data used in this study was collected from the Flash Eurobarometer 414 “Preferences of Europeans towards tourism” in the 28 countries of the European Union, conducted by TNS Political & Social at the request of the European Commission, Directorate-General for Internal Market, Industry, Entrepreneurship and SMEs (European Commission, 2015). The interviews were conducted by phone in the respective national language. The analysis already made to this questionnaire is very simple and descriptive and do not explore complex relationships among variables.
The data collected refer to the years 2014, 2015 and 2016, and it was necessary to combine the data so that it is possible to carry out the analyzes. This process forced a variable treatment since the questionnaires presented different variables with different structures, and also, different names were assigned to the variables according to the year. After the treatment of the variables and identification of their names, the data understang was started.
The data available consists of 91.328 tourists (around 30.000 for each year) and 629 variables, which need to be observed and cleaned in order to meet this study goals. For this study, only the tourists from EU who have traveled at least once to a European country and pretend to travel again to a European country in the follow year.
After analyzing the final data, it turned out that most people had responded that they wanted to travel to more than one country, just as they had traveled to more than one country last year. On the other hand, since few valid results were obtained, a transformation of the data was carried out, where it was considered only a trip made and a trip that was intended to travel. After this transformation the sample comprises 73.252 tourists.
From all the variables included in de data file retrieved, only the ones that can be related to tourist loyalty were maintained, resulting in 114 final variables to be studied. These variables were divided into three different subgroups: socio-demographic characteristics, holidays taken last year, and holidays plan this year.
Given the choice of increasing the number of entries, we did not take into account the satisfaction variables since the data did not allow us to know the satisfaction level for all trips.
18 In the data preparation phase, it was necessary to create different variables that allowed results more consistent in the modeling phase. Thus, both the nationality variable, holiday taken last year, and the variable holidays plan this year, were transformed simultaneously.
It was used to create a new variable D3_r1 (area of the European Union that the country of nationality belongs) to split the nationality countries into the European demographic divisions.
It was also created the variable D3_r2 (currency of the nationality country) to assign the value “Euro” or “Non-euro” to each country. The same was complete for the remaining variables (Holidays taken and holidays plan).
The country division was made using the following characterization (Vieira, 2016): • North European countries: Denmark, Finland and Sweden.
• Central European countries: Austria, Belgium, France, Germany, Ireland, Italy, Luxembourg, Malta, Netherlands and United Kingdom.
• Countries of the Iberian Peninsula: Portugal and Spain.
• Eastern European countries: Czech Republic, Hungary, Poland, Rep. of Cyprus and Romania.
• Balkan countries: Bulgaria, Greece, Latvia, Republic of Croatia, Slovakia and Slovenia.
• Baltics: Estonia and Lithuania.
The creation of the variable D3_R2 was made using the following information (UE, 2016):
• Euro: Germany, Austria, Belgium, Cyprus, Slovakia, Slovenia, Spain, Estonia, Finland, France, Greece, Ireland, Italy, Latvia, Lithuania, Luxembourg, Malta, Netherlands and Portugal.
• Non-euro: Bulgaria, Croatia, Hungary, Poland, Czech Republic, Romania, Sweden, Denmark and United Kingdom.
Six new variables were also created to categorize whether planned and realized trips were made to the own country, the foreign country, and the neighboring country.
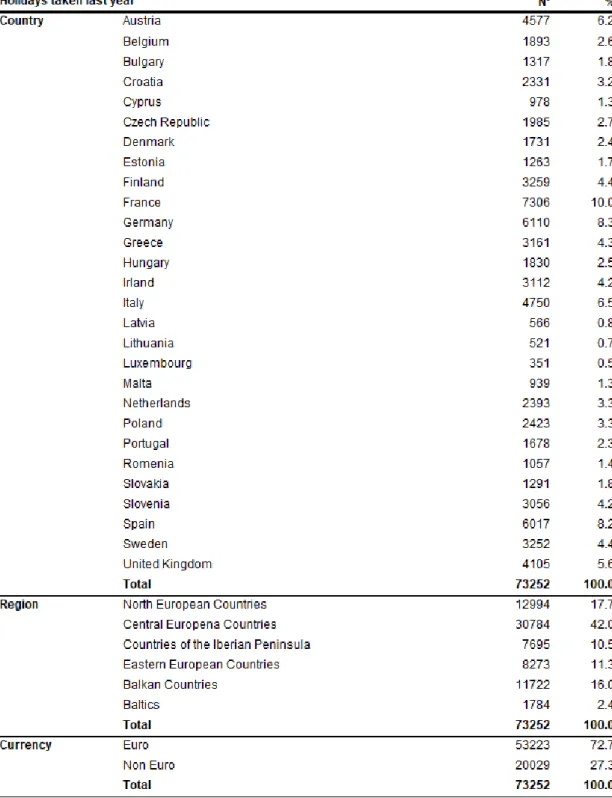
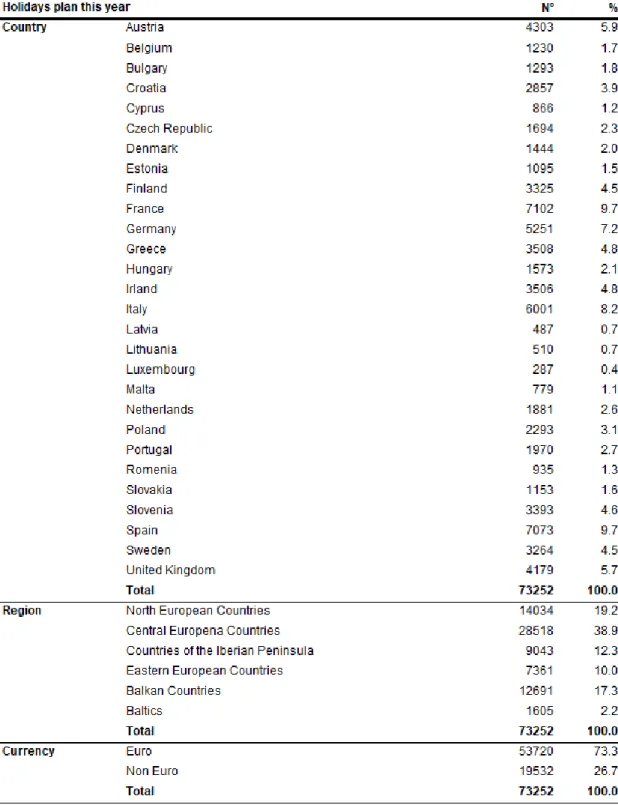
Table 1 to 5 are related to the tourist characterization and social demographic new variables.
19 Table 1 - Nationality Nº % Austria 4909 6.7 Belgium 3330 4.5 Bulgary 1438 2.0 Croatia 1316 1.8 Cyprus 949 1.3 Czech Republic 3558 4.9 Denmark 3992 5.4 Estonia 1040 1.4 Finland 3761 5.1 France 3707 5.1 Germany 4844 6.6 Greece 1454 2.0 Hungary 1597 2.2 Irland 4384 6.0 Italy 2645 3.6 Latvia 1058 1.4 Lithuania 762 1.0 Luxembourg 1991 2.7 Malta 718 1.0 Netherlands 4939 6.7 Poland 3218 4.4 Portugal 1152 1.6 Romenia 1303 1.8 Slovakia 2590 3.5 Slovenia 1759 2.4 Spain 2313 3.2 Sweden 3938 5.4 United Kingdom 4587 6.3 Total 73252 100.0
North European Countries 11691 16.0
Central Europena Countries 36054 49.2
Countries of the Iberian Peninsula 3465 4.7
Eastern European Countries 10625 14.5
Balkan Countries 9615 13.1 Baltics 1802 2.5 Total 73252 100.0 Euro 48305 65.9 Non Euro 24947 34.1 Total 73252 100.0 Nationality Nationality region National currency
20 Table 2 - Distribution of the socio-demographic characteristics
Nº %
15 - 24 Years 4989 6.8
25 - 39 Years 12699 17.3
40 - 54 Years 21299 29.1
55 Years and older 34265 46.8
Total 73252 100.0 Male 33413 45.6 Female 39839 54.4 Total 73252 100.0 Up to 14 years 1841 2.5 15 years 2084 2.9 16 years 3550 4.9 17 years 3355 4.6 18 years 9374 12.9 19 years 6460 8.9 20 years 4896 6.7 21 years 4768 6.6
22 years and older 32306 44.4
Still studying 3922 5.4
No full-time education 184 0.3
Total 72740 100.0
Up to 15 years 3925 5.4
16-19 years 22739 31.3
20 Years and older 41970 57.7
Still studying 3922 5.4
No full-time education 184 0.3
Total 72740 100.0
Rural area or vilalge 21784 29.9
Small or middle sized town 27615 37.8
Large town 23566 32.3 Total 72965 100.0 1 13941 19.1 2 38080 52.1 3 11340 15.5 4+ 9701 13.3 Total 73062 100.0 Yes 71070 97.1 No 2144 2.9 Total 73214 100.0 Yes 57642 78.7 No 15572 21.3 Total 73214 100.0 Mobile Only 15572 21.3 Landline Only 2144 2.9
Mobile and landline 55498 75.8
Total 73214 100.0 Mobile phone Landline (phone) Phone available Age education (11 categories) Age education (5 categories) Type of community Household size - aged 15 (binned) Social-demographic characteristics Age binned Gender
21 Table 3 - Distribution of the occupation related characteristics
Nº %
Farmer, forester, fisherman (self-employed) 475 0.7
Owner of Shop, crafsman (self-employed) 1495 2.0
Professional (sel-employed lawyer, medical practitioner, ...) 2767 3.8
Manager of a company (self-employed) 2091 2.9
Other (self-employed) 842 1.2
Professional (employed doctor, lawyer, accountant, architect, ...) 5733 7.8
General management, director or top management 2051 2.8
Middle management 6176 8.5
Civil servant 5556 7.6
Office clerk 4211 5.8
Other employee (salesman, nurse, ...) 6830 9.3
Other (employee) 452 0.6
Supervision\ foreman (team manager, ...) 667 0.9
Manual worker 2724 3.7
Unskilled manual worker 546 0.7
Other (manual worker) 85 0.1
Looking after the home 2946 4.0
Student (full time) 3695 5.1
Retired 21574 29.5
Sneeking a job 1632 2.2
Other (without a professional activity) 524 0.7
Total 73072 100.0 Self-employed 7670 10.5 Employees 31009 42.4 Manual Workers 4022 5.5 Not Working 30371 41.6 Total 73072 100.0 Occupation characteristics Occupation Occupation type
22 Table 4 - Holidays Taken Last Year
23 Table 5- Holidays plan this year
24
3.3. Modelling
In order to reach the desired objectives, decision tree models were created, which are the easier way to comprehend and analyze, especially using a large number of data (Chen 2003). CHAID (chi-squadred automatic interection detector) and the regression and classification tree (CART) were tested in a specific way,
CHAID is a widely used method of segmentation of tourism and this is based on a categorization of at least two variables where it allows analyzing and segmenting with the use of independent variables.
The advantage of using this model is that it accepts any type of variable accepting both nominal, interval or continuous as independet variable (predictors). Another advantage is related to the application objectives of this model, which is a very versatile model and suits different uses.
CART is an algorithm that construct binary trees. This is designed for the use of static databases i.e. with boundary. This translates into a learning model that becomes more specific until the best result is achieved. Being a decision tree-based model, this is composed by nodes and branches.
As already mentioned, the advantage of using these two models is its ease of comprehension, in this way, both models were tested and evaluated. In this way a validation was performed through the training and test sample and this forced to balance the weight of loyal and non-loyal tourists. This process was carried out through the random exclusion of loyal tourists. This phase was essential derived. Otherwise the model would predict practically all tourists as loyal (what happened in molel G of CHAID)
Table 6 - Predicting models to classify loyalty using CART algorithm
Model A Model B Model C Model D Model E Model F CART (R) CART (R1) CART(R2) CART (R3)
boosting CART (R4) bagging (voting) CART (R5) bagging (voting) Tree depth 5 9 11 9 11 11
Minimum records in parent branch 2 2 2 2 2 2 Minimum records in child node 1 1 1 1 1 1 Balanced sample Yes Yes Yes Yes Yes Yes Training sample 70% 70% 70% 70% 70% 70% Testing sample 30% 30% 30% 30% 30% 30%
25 Table 7- Predicting models to classify loyalty using CHAID algorithm
In order to evaluate the models, different techniques were used, namely accuracy, sensibility, specificity, AUC - ROC and Gini.
One of the measures most used in relation to the evaluation of models is the accuracy, which measures the rate of correctness, regardless of the class. Sensibility evaluate the percentage of true positives that a model produces. Specificity evaluates the percentage of true negatives that a model produces (Delen et al., 2013).
QUINLAN (1993) prosed the Gain Ratio, that is how much information which is what the information gain as an evaluation criterion. In the first step, the information gain for all attributes is calculated. It is then selected which data gives more information.
The Italian Corrado Gini in 1912 proposed a model which employs a statistical dispersion index. This index is widely used in economic and social analysis, for example, to quantify the distribution of income in each country. It is used in the CART algorithm (BREIMAN et al., 1984). Just as in calculating the information gain, simply calculate the difference between gini index before and after division. Thus, you select the attribute that generates a higher value for Gini.
A classification and avialization model for the so - called AUC - ROC models was also used. ROC is a probability curve and the AUC serve to measure the separability. In short, it conveys the information on how efficient a model is and whether it is able to distinguish the variables. A model with better AUC is usually a better in terms of distributing the variables in this case in tourist loyalty.
26
Chapter 4
– Ressults and Discussion
To achieve the first goal outlined, which refers to the identification of pairs of countries visited, a crosstable between travel taken last year and travel plan this year was made. In table 8 it is possible to identify the countries where there is a stronger loyalty, as well as the destination travel trends.
The first result that stands out, refers to the tendency of tourists to return to their country of destination. In this way, regardless of the destination site, the next year the highest percentage for the planned trip goes to that destination.
The biggest example of this is the Bulgary, where tourists who traveled to Bulgary last year, say that this year most people intend to return to Bulgary (51.0%) followed by Greece (9.9%) and Germany (6.4%).
Another example is Poland, where tourists who traveled to Poland last year have a tendency to return to that country (41.4%) followed by Italy (5.1%) and Germany (4.8%). These results, whether relating to Bulgaria or Poland can be explained derived from the fact that most people who traveled to these countries are people of that nationality.
On the other hand, concerning tourists who traveled to Luxembourg, there is a preference to travel to France (14%) and only then appears the intention to return to the country 11.4%. Finally, 10.0% of the tourists who traveled to Luxembourg showed interest in traveling to Germany.
This result is explained given the size of the country, so that there is no return trend to explore the country. France and Germany are neighboring countries and can explain the destination country alternatives.
Regarding to Portugal, the tourists showed an intention to return to the country, being this their first destination of preference (35.8%). Tourists then show the destination country as the neighboring country of Spain (14.7%) followed by Italy (8.3%) and France (8.2%).
The results regarding portugal can be explained derived from the existence of several points of interest throughout the country and the fact that the interest of the tourists by the Iberian Peninsula wants to explore it. Italy and France are considered the countries with a culture more similar to the countries of the peninsula being a trend of destination countries.
27
Austria Belgium Bulgary Croatia Cyprus Czech
Republic Denmark Estonia Finland France Germany Greece Hungary Irland Italy Latvia Lithuania Luxembourg Malta Netherlands Poland Portugal Romenia Slovakia Slovenia Spain Sweden
United Kingdom Austria 28.4% 4.2% 2.5% 5.5% 4.0% 5.8% 3.5% 2.1% 3.1% 4.8% 7.2% 4.1% 5.1% 5.3% 4.9% 3.5% 3.5% 5.1% 4.7% 4.5% 2.6% 2.7% 4.1% 6.7% 4.4% 3.3% 2.6% 3.6% Belgium 0.8% 17.1% 0.5% 0.6% 0.4% 0.4% 0.6% 0.5% 2.0% 2.4% 1.8% 0.9% 0.7% 0.8% 1.1% 0.7% 2.3% 5.4% 2.4% 3.6% 0.5% 1.6% 0.5% 0.5% 0.9% 1.1% 0.9% 1.0% Bulgary 0.8% 0.6% 51.0% 0.8% 1.5% 1.5% 0.3% 0.5% 0.2% 0.5% 1.0% 3.2% 1.2% 0.6% 0.8% 0.4% 1.2% 0.9% 0.5% 0.8% 0.9% 0.5% 3.4% 1.9% 0.5% 0.5% 0.3% 0.8% Croatia 5.6% 1.4% 1.5% 40.6% 1.1% 6.9% 1.2% 1.0% 0.7% 1.7% 3.1% 2.1% 6.9% 0.5% 4.1% 1.9% 2.3% 1.4% 0.6% 1.6% 3.4% 1.4% 2.2% 7.5% 5.9% 1.8% 1.5% 1.3% Cyprus 1.0% 0.5% 0.8% 0.4% 27.3% 0.7% 0.6% 0.3% 0.9% 0.6% 0.4% 3.0% 0.4% 1.3% 0.3% 0.7% 0.6% 0.9% 1.2% 1.3% 0.2% 0.5% 3.2% 0.7% 0.6% 0.5% 0.8% 1.5% Czech Republic 2.1% 1.1% 1.3% 2.8% 1.4% 28.4% 1.2% 1.4% 0.8% 1.4% 2.0% 1.5% 2.6% 0.9% 1.4% 1.2% 1.9% 1.1% 1.1% 0.9% 3.3% 0.3% 0.9% 9.4% 1.2% 1.1% 0.9% 0.8% Denmark 1.1% 1.0% 0.4% 0.7% 0.9% 1.0% 27.4% 3.0% 0.8% 1.2% 3.0% 1.0% 0.4% 0.5% 1.3% 2.5% 1.5% 0.9% 0.7% 1.3% 0.9% 1.1% 0.3% 0.5% 0.8% 1.8% 3.3% 1.0% Estonia 0.5% 0.6% 0.5% 0.4% 1.0% 0.6% 3.2% 29.3% 3.9% 0.6% 0.6% 0.6% 0.7% 0.4% 0.6% 6.5% 5.0% 0.9% 0.4% 0.4% 0.9% 0.4% 0.4% 0.6% 0.9% 1.3% 2.5% 0.2% Finland 2.1% 5.0% 0.8% 1.3% 3.3% 2.7% 2.3% 14.2% 37.6% 2.7% 1.9% 0.9% 2.8% 6.3% 0.8% 4.1% 3.8% 2.8% 7.7% 1.6% 3.0% 1.5% 2.0% 1.2% 6.8% 2.0% 7.4% 1.7% France 7.1% 15.9% 3.0% 3.6% 5.0% 5.4% 6.8% 3.6% 5.1% 34.6% 7.4% 4.6% 3.0% 6.7% 10.0% 4.6% 3.8% 14.0% 9.6% 10.5% 3.5% 8.2% 4.2% 3.2% 4.9% 9.7% 5.1% 8.9% Germany 7.9% 7.8% 6.4% 5.2% 4.3% 4.9% 8.7% 4.2% 3.2% 5.2% 27.6% 4.8% 3.9% 4.2% 6.1% 4.6% 3.5% 10.0% 3.8% 9.2% 4.8% 4.3% 5.0% 3.1% 4.4% 4.8% 4.5% 4.7% Greece 3.6% 2.6% 9.9% 3.4% 10.9% 3.6% 2.8% 2.8% 1.4% 2.5% 3.2% 40.3% 2.8% 1.3% 4.4% 2.7% 2.3% 2.6% 1.5% 2.7% 2.3% 2.9% 6.9% 4.1% 0.9% 3.3% 2.4% 4.1% Hungary 1.7% 0.8% 0.6% 2.2% 0.8% 2.2% 0.9% 0.8% 1.6% 0.7% 1.4% 1.2% 33.8% 1.1% 1.1% 0.9% 0.4% 2.3% 0.6% 0.9% 2.2% 0.5% 2.8% 4.0% 2.4% 0.6% 2.6% 0.7% Irland 4.5% 3.3% 1.8% 1.3% 5.4% 1.9% 2.0% 1.9% 7.8% 4.0% 2.0% 1.3% 2.6% 35.1% 1.7% 1.9% 1.3% 5.4% 7.3% 2.8% 2.3% 3.6% 2.6% 2.1% 7.0% 2.7% 3.8% 6.3% Italy 9.3% 7.2% 3.1% 8.4% 2.5% 7.3% 6.0% 3.7% 1.7% 8.3% 8.7% 7.7% 6.3% 2.3% 34.1% 4.2% 5.4% 5.1% 4.6% 6.1% 5.1% 8.3% 4.8% 5.4% 2.2% 8.7% 4.6% 6.3% Latvia 0.3% 0.3% 0.3% 0.2% 0.4% 0.7% 0.8% 2.7% 0.5% 0.3% 0.5% 0.3% 0.4% 0.3% 0.3% 27.4% 6.9% 0.3% 0.4% 0.3% 0.9% 0.2% 0.4% 0.6% 0.2% 0.2% 0.6% 0.2% Lithuania 0.5% 1.0% 0.3% 0.3% 0.4% 0.6% 0.5% 1.6% 0.7% 0.3% 0.5% 0.3% 0.4% 0.0% 0.3% 8.8% 29.4% 0.3% 0.3% 0.2% 1.0% 0.2% 0.2% 0.9% 0.2% 0.3% 0.4% 0.4% Luxembourg 0.5% 0.9% 0.2% 0.1% 0.1% 0.1% 0.1% 0.2% 0.3% 0.5% 0.5% 0.2% 0.2% 0.4% 0.3% 0.4% 11.4% 0.2% 0.8% 0.2% 0.5% 0.2% 0.3% 0.4% 0.1% 0.5% 0.2% Malta 0.6% 1.8% 0.6% 0.3% 0.8% 0.3% 0.8% 0.3% 2.0% 1.2% 0.5% 0.4% 0.7% 1.2% 0.6% 0.2% 1.5% 0.6% 21.7% 0.6% 0.7% 0.2% 0.3% 0.4% 1.4% 0.6% 0.6% 0.9% Netherlands 1.5% 4.9% 0.8% 1.2% 1.8% 0.7% 1.3% 1.0% 0.9% 2.3% 3.1% 1.5% 1.1% 1.3% 1.7% 1.4% 1.0% 5.1% 1.6% 28.5% 0.9% 1.2% 1.5% 0.5% 0.9% 1.6% 1.3% 1.9% Poland 1.3% 1.1% 0.8% 1.5% 1.4% 3.6% 1.4% 1.4% 2.6% 1.2% 2.7% 0.7% 2.7% 1.7% 1.8% 3.0% 4.4% 2.0% 3.8% 1.0% 41.4% 1.2% 1.6% 3.6% 3.3% 1.2% 2.2% 1.3% Portugal 1.5% 2.7% 1.1% 0.9% 0.5% 1.1% 1.5% 1.1% 0.7% 3.2% 1.9% 1.8% 1.0% 1.7% 2.5% 2.3% 1.9% 2.8% 1.2% 1.8% 1.2% 35.8% 0.9% 0.9% 0.4% 3.9% 1.0% 2.6% Romenia 1.2% 0.4% 1.6% 0.5% 5.1% 0.3% 0.3% 0.4% 0.5% 0.4% 0.6% 1.2% 2.5% 0.9% 0.8% 0.7% 1.0% 0.4% 1.1% 0.6% 0.5% 37.7% 1.2% 0.3% 0.4% 0.1% 0.8% Slovakia 1.6% 0.5% 1.3% 2.6% 0.5% 6.3% 0.1% 0.5% 0.3% 0.4% 0.9% 0.9% 3.4% 0.8% 1.0% 1.2% 2.5% 0.6% 0.5% 0.3% 2.2% 0.5% 1.2% 28.8% 0.7% 0.6% 0.3% 1.3% Slovenia 3.2% 2.9% 1.4% 7.3% 3.5% 3.4% 1.9% 3.3% 8.1% 3.1% 2.1% 1.0% 4.8% 7.6% 1.1% 1.4% 1.0% 5.1% 8.6% 2.6% 4.2% 0.6% 1.6% 1.6% 38.6% 1.2% 5.6% 1.1% Spain 4.6% 8.7% 4.4% 3.6% 3.6% 6.4% 9.5% 9.0% 3.6% 8.8% 8.4% 7.3% 4.0% 6.2% 9.7% 5.3% 5.8% 5.1% 4.6% 7.9% 4.7% 14.7% 4.7% 4.5% 2.5% 39.5% 6.5% 10.6% Sweden 1.9% 2.1% 0.8% 2.2% 1.8% 1.6% 10.3% 6.7% 7.1% 2.5% 3.2% 1.6% 3.9% 3.4% 2.2% 4.2% 3.5% 5.1% 4.5% 1.8% 2.8% 2.1% 1.0% 0.6% 5.8% 2.9% 33.6% 2.7% United Kingdom 4.7% 4.0% 2.4% 1.9% 10.0% 1.7% 4.2% 2.6% 2.0% 4.8% 3.6% 5.5% 1.7% 7.0% 4.9% 3.2% 2.5% 2.8% 5.2% 5.1% 3.3% 4.4% 5.5% 5.1% 1.5% 4.1% 4.3% 33.2% 100.0% 100.0% 100.0% 100.0% 100.0% 100.0% 100.0% 100.0% 100.0% 100.0% 100.0% 100.0% 100.0% 100.0% 100.0% 100.0% 100.0% 100.0% 100.0% 100.0% 100.0% 100.0% 100.0% 100.0% 100.0% 100.0% 100.0% 100.0% Notes: n=73250; χ = . ;p< . ; V de Cramer= . Total
Holidays taken last year
H o li d a y p la n th is y e a r
28 This dissertation aims to verify, evaluate and categorize the loyalty of European tourists to the destination country. In order to achieve this goal, and answer the objective number two,evaluating the loyalty of tourists, whether on an individual level (trips to the own country, foreign country and strangeness). To that end, he was considered a loyal tourist if he returned to his country last year.
In Table 9 it’s possible to verify the distribution of country type visited and to visit. In this way, it is possible to verify that the majority of the people (always superior to 70%) did not travel to its own country. Being that this questionnaire was done to people who have made at least one trip by plane to a European country, it is normal to have a majority for trips to the stranger. However, travel to the country itself accounts for about 25% of travel (26.4%) and planned travel (25.4%).
Table 9 - Distribution of country type visited and to visit
Referring to table 10, this shows the loyalty of the tourists that in general, either referring to a specific country as well as by type of loyalty (tourist loyal to the country itself, loyal to a stranger and not loyal country).
As it is possible to verify in table 10, 77.2% are loyal, that is, they intend to return to the country where they had vacations. On the other hand, it is also possible to verify that 62.7% are loyal to a foreign country, that is, they had vacations last year in a foreign country and intend again to leave their own country this year again. Concerning to people traveling to their own country, it is possible to say that 14.5% of people are loyal. Finally, it is important to note that 33.6% of people are loyal to a specific country regardless of whether or not this is their own country.
Nº % Abroad 53917 73.6 Own country 19335 26.4 Total 73252 100.0 Abroad 54680 74.6 Own country 18572 25.4 Total 73252 100.0 Country visited Country to visit
29 Table 10 - Distribution of loyalty related chacacteristics
Table 11 refers to a cross-table comparing the countries visited and country to visit by type, that is, whether it is your own country or a stranger country. As already mentioned, it is possible to verify that if a person has made a trip to the stranger, in the following 85.2% intends to return to a stranger country. On the other hand, if a person traveled this year to their own country, there is a tendency (54.8%) of this to choose their own country as holiday destination.
Table 11 - Distribution of country type to visit this year by country type visited last year
Regarding the third objective of identifying socio-demographic characteristics that could explain loyalty, the CART and CHAID models were applied. These were tested for different parameterizations and compared the models based on the ROC and the gain chart (Figures 2 to 5). Nº % No 16701 22.8 Yes 56551 77.2 Total 73252 100.0 No 48672 66.4 Yes 24580 33.6 Total 73252 100.0 Abroad 45948 62.7 Own country 10603 14.5 Non-loyal 16701 22.8 Total 73252 100.0
Loyalty related chacacteristics Loyalty
Loyalty to a specific country
Loyalty type
Abroad Own country
Nº 45948 8732 54680 % 85.2% 45.2% 74.6% Nº 7969 10603 18572 % 14.8% 54.8% 25.4% Nº 53917 19335 73252 % 100.0% 100.0% 100.0% Notes: χ = . ;p< . ; V de Cramer= . Abroad Own country Total Country visited Total Country to visit
30 Figure 2 - ROC for the different CART models
31 Figure 4 - ROC for the different CHAID models
Figure 5 - Gains chart for the different CHAID models
The results of the best models of each algorithm are presented in Table 12. It is observed that the best model is the one obtained with the CART algorithm, being slightly better than the CHAID model in all the metrics except for the sensitivity (ability to classify loyal tourists well).
32 Table 12- Results of the best predicting models to classify loyalty
It should be noted that the predictive capacity of the model is low, overall. However, it allows to identify the profiles of loyal tourists and also of non-loyal tourists, based on the most reliable terminal nodes (the rule set is presented in the annex). Thus, it was identify profiles of tourists that have a strong possibility of being loyal, considering a confinement equal to or greater than 0.8 and a minimum of 10 tourists as support:
• IF Nationality region in [ North European Countries Countries of the iberian Peninsula Balkan Countries ] AND Nationality in [ Denmark Slovakia ] AND Household size - aged 15+ > 1,500 AND Occupation in [ Manager of a company (self-employed) Other (self-employed) ] AND Age education (11 categories) in [ 15 years 16 years 17 years 19 years 20 years 22 years and older ] THEN Loyal = Yes (Support=40; Confidence=0.875);
• IF Nationality region in [ North European Countries Countries of the iberian Peninsula Balkan Countries] AND Nationality in [ Denmark Greece Latvia Slovakia Slovenia] AND Household size - aged 15+ > 4,500 AND Occupation in [ Professional (sel-employed lawyer, medical practitioner, ...) Manager of a company (self-employed) Other (self-employed) THEN Loyal = Yes (Support=16; Confidence=1.0);
• IF Nationality region in [ North European Countries Countries of the iberian Peninsula Balkan Countries] AND Nationality in [ Denmark Greece Latvia Slovakia Slovenia] AND Occupation in [ Farmer, forester, fisherman (self-employed) Owner of Shop, crafsman (self-(self-employed) General management, director or top management Middle management Civil servant Office clerk Other employee (salesman, nurse, ...) Other (employee) Supervision\ foreman (team manager, ...) Manual worker Unskilled manual worker Other (manual worker) Looking after the home Student (full time) Retired Sneeking a job Other (without
Train Test Train Test
Accuracy 61.62% 61.98% 60.24% 60.71% Sensibility 55.27% 56.24% 57.75% 58.13% Specificity 67.95% 67.77% 62.75% 63.27% AUC 0.652 0.662 0.653 0.661 Gini 0.303 0.323 0.307 0.321 Evaluation metrics