Artigo
*e-mail: [email protected]
BIOCONVERSION OF CELLULOSE INTO HYDROGEN, BIOGAS AND ORGANIC ACIDS USING MICROBIAL CONSORTIUM FROM A PULP AND PAPER MILL WASTEWATER TREATMENT PLANT
Camila Abreu B. Silva Rabelo, Laís Américo Soares, Isabel Kimiko Sakamoto and Maria Bernadete Amâncio Varesche* Departamento de Hidráulica e Saneamento, Escola de Engenharia de São Carlos, Universidade de São Paulo, 13563-120 São Carlos – SP, Brasil
Recebido em 02/08/2017; aceito em 10/10/2017; publicado na web 28/11/2017
This study evaluated the potential of a microbial consortium collected from a pulp and paper mill wastewater treatment plant (WWTP) for converting cellulose to hydrogen, biogas and organic acids. Fermentation tests were conducted in batch reactors fed with different concentrations of cellulose as substrate: (C1) 2.0 g L-1; (C2) 5.0 g L-1 and (C3) 10.0 g L-1. The parameters investigated were
hydrogen, biogas, organic acids, carbohydrates and pH. The maximum hydrogen production was 14.77, 39.25 and 22.53 mmol L-1,
and the maximum methane was 4.40, 3.72 and 9.56 mmol L-1, for C1, C2 and C3, respectively. Butyric acid was the main metabolite
generated, with maximum concentrations of 2.2, 1.8 and 2.2 g L-1 for C1, C2 and C3, respectively. The decrease in hydrogen
production was accompanied by the production of methane, acetic acid and hydrogen sulfide in the three tests, probably related to hydrogenotrophic methanogenesis, homoacetogenesis and sulfidogenesis, respectively. The phylogenetic characterization of the bacterial community was performed by cloning and sequencing analysis. The microorganisms identified in the consortium were similar (> 95%) to Clostridium sp., Klebsiella sp., Routella sp. and Desulfovibrio sp. These genera were associated with hydrogen production, degradation of cellulosic substrates, and/or hydrogen-consuming microorganisms.
Keywords: bioconversion; butyric acid; cellulose; Clostridium; Desulfovibrio.
INTRODUCTION
The rapid population growth and increased energy demand in response to intense industrialization process lead to the foreseeable depletion of limited fossil energy resources.1,2 In this context, the bioconversion of cellulosic biomass into value-added products, such as hydrogen, biogas and organic acids, could be considered an environmentally friendly alternative.
The bioproducts from cellulose can be achieved by using a pure culture or a microbial consortium as inoculum. However, the use of microbial consortium, from the point of view of operation and control, is simpler, more robust and it allows the conversion of many substrates due to their metabolic flexibility when compared to using pure cultures.3,4
Some bacteria of the genera Clostridium, Bacillus, Ruminococcus, Enterobacter have been widely described as cellulose-degrading bacteria.5–7 These bacteria, as well as the non-cellulolytic one, are found in different anaerobic environments such as rumen,8 landfill leachate,9 vegetable wastes10 and soil.11 The non-cellulolytic bacteria may contribute to cellulose biodegradation by controlling pH and consuming metabolites, factors which affect the cellulolytic activity by enzyme inhibition and/or metabolite repression.12
Pan et al.13 used the activated sludge from a paper mill wastewater as inoculum for hydrogen production using wheat bran as substrate. The inoculum was thermally pretreated and Clostridium sp. was identified as the predominant hydrogen-producer. These authors reported that the acid substrate pretreatment was essential for converting the biomass into hydrogen.
The initial hydrolysis of cellulose is the most important limiting factor to get and efficient synthesis of value-added products. Many studies have reported the use of commercial cellulase to promote the biomass hydrolysis. Botta et al.8 observed that the hydrogen production using paper as substrate and rumen fluid as inoculum
was only possible after the application of commercial cellulase. Similarly, Datar et al.14 also described the hydrogen production from hydrolyzed corn stover and anaerobic digester sludge as inoculum using commercial cellulase.
However, the involved mechanisms, energy consumption and economic costs related to the application of commercial cellulase are a complex gap knowledge for cellulosic biomass conversion.15,16
Moreover, there are several difficulties in the synthesis of value-added products, for instance, the relatively low production efficiency. The developing strategies that contribute toward solving these problems is one of the directions currently undertaken.16 Thus, the application of a cellulolytic consortium and also the cellulosic waste from the same mill is a suitable strategy for decentralized and efficient energy production, due to the substrate/inoculum-specificity.
The aim of this study was to evaluate the biotechnological potential of a microbial consortium from a pulp and paper mill WWTP to produce value-added products from cellulose. Furthermore, a phylogenetic characterization, by the sequencing of 16S rRNA gene fragments, was performed to better understand the process dynamics. MATERIAL AND METHODS
Inoculum source and enrichment phase
The sludge samples (0.2 L) were collected in the facultative pond of a Wastewater Treatment Plant (WWTP) from Suzano Pulp and Paper mill located in Limeira, SP, Brazil. The sludge had 22.7 g L-1 (± 1.2) and 11.8 g L-1 (± 1.0) of TS (total solids) and TVS (total volatile solids), respectively; and pH of 7.2.
enrichment phase, according to Ho et al.17 to favor heterotrophic bacteria to the detriment of autotrophic microorganisms.
Bath Reactors
Microcrystalline cellulose powder of particle size 20 µm (Sigma-Aldrich) was used as substrate. The batch fermentations were conducted in triplicate for the three different conditions, varying the cellulose concentrations as sole carbon source (g L-1): C1: 2.0, C2: 5.0 and C3: 10.0.
The bioassays were performed in anaerobic batch reactors using a total volume of 2 L, with 50% of the reaction volume and 50% of headspace (N2 100%). The modified-LGM 9418 culture medium was composed of (g L-1): NaHCO
3 (2.1), NH4Cl (0.68), KH2PO4 (0.18), (NH4)2SO4 (0.15), MgSO4.7H2O (0.12), yeast extract (1.0) and tryptone (1.0) and (mg/L): K2HPO4 (296.0), CaCl2.2H2O (61.0), FeSO4.7H2O (21.0), NaCl (10.0), nitrilotriacetic acid (15.0), MnSO4. H2O (5.0), CoCl2.6H2O (1.0), ZnSO4.7H2O (1.0), CuSO4.5H2O (0.1), KAl(SO4)2.12H2O (0.1), H3BO3 (0.1), Na2MoO4.2H2O (0.1) and vitamin solution (5.0 mL). The initial pH was adjusted to 6.8 with HCI (1.0 M). A control assay without cellulose was also performed. All reactors were incubated at 37 °C.
Analytical procedures
The biogas composition in the headspace was determined using a gas chromatograph (Shimadzu, GC-2010) equipped with a thermal conductivity detector and argon was used as the carrier gas. The temperatures of the injector, detector and column were 30 °C, 200 °C and 300 °C, respectively. Samples (0.5 mL) were collected from each pressurized reactor with a pressure-lock gastight syringe.
The determination of organic acids and alcohols was performed using high performance liquid chromatography (HPLC Shimadzu) in accordance with Penteado et al.19 pH and hydrogen sulfide analyses were conducted in accordance with Standard methods for the examination of water and wastewater.20
The colorimetric phenol-sulfuric acid method was used to determine soluble carbohydrates.21
The consumption of soluble carbohydrates (%) was calculated using the following equation:
(1)
where, Cmax is the maximum concentration of soluble carbohydrates measured and Cf is the final soluble carbohydrates concentrations. Phylogenetic characterization
The DNA extraction after the incubation period of the reactors was carried out in accordance with the protocol of Griffiths et al.,22 modified by using glass beads for cell lysis. The extracted DNA was amplified by polymerase chain reaction (PCR) using the primers 968FGC and 1401R23 for the Bacteria Domain. The dendrogram based on the DGGE band patterns was constructed using the BioNumerics software 2.5, calculated from the Pearson similarity coefficient.
The phylogenetic characterization of the bacterial consortium in condition C2 after the incubation was performed by cloning and sequencing of 16S rRNA. Therefore, the extracted DNA was subjected to PCR to amplify the 16S rRNA gene fragment with the primers 27F and 1492R.24 The PCR product was cloned according to Maintinguer et al.25 The clones were sequenced by Macrogen Inc. (http://www. macrogen.com/eng/business/seq_overview.html).
Based on the obtained sequences, the vectors were removed using the Dnastar Lasergene SeqMan Pro and BioEdit 7.2.5 software package. The tools of the Ribosomal Database Project (decipher find chimeras, alignment, complete linkage clustering, representative sequences, RDP classifier, dereplicate - http://rdp.cme.msu.edu/) in addition to a basic alignment search tool (Basic Local Alignment Search Tool-BLAST) were used to obtain similar sequences at the National Center for Biotechnology Information GenBank database (http://www.ncbi.nlm.nih.gov/BLAST/). This previous step allowed the combination of sequences in Operational Taxonomic Units (OTUs).
The phylogenetic tree construction was performed using the Neighbor-Joining method,26 with the MEGA 6.0 program.27 In this step, the Bootstrap method was applied with 1000 replicas in order to estimate the reliability of phylogenetic tree topology.28 The confidence limit was 99% for the taxonomic level of Species and 88% for the taxonomic level of Genus.
The representative sequences from each OTU were deposited in the NCBI database under the accession numbers KP715407 (OTU 1), KP715408 (OTU 2), KP715409 (OTU 3), KP715410 (OTU 4), KP715411 (OTU 5) and KP715412 (OTU 6).
Kinetic Parameters
The data were fitted to the mean values of the triplicate sets of reactors using the Statistica 8.0 software. The average of the hydrogen evolution data was adjusted to the modified Gompertz model.29
(2)
H is the cumulative hydrogen production, t is the time of operation (days), P is the maximum hydrogen production potential (mmol/L), Rmis the maximum hydrogen production rate (mmol/day.L), λ is
the lag-phase period (day) and e is 2.71. The hydrogen yield was calculated for each condition by dividing P by the added cellulose mass.
One-way analysis of variance (ANOVA) was performed to evaluate the effect of substrate concentration on hydrogen production, using the Minitab 17 software. The values were compared at 5% level of confidence.
RESULTS AND DISCUSSION
Hydrogen production in batch fermentation
The hydrogen production potential (P) increased with the increment of cellulose concentration from 14.77 to 39.25 mmol L-1 using 2.0 and 5.0 g cellulose L-1, respectively. Using ANOVA, substrate concentration had a significant effect on hydrogen production (p < 0.05), indicating that its production was favored when 5.0 g L-1 of cellulose was used as substrate. In contrast, the hydrogen production potential (P) decreased from 39.25 to 22.53 mmol L-1 when the cellulose concentration increased (5.0 and 10.0 g cellulose L-1), indicating that an inhibitory effect was more pronounced at high substrate concentrations (Figure 1).
addition of commercial cellulase enzyme, which was not applied in the present study.
Cellulases are enzymes specifically designed to hydrolyze cellulose chains.30 Moreover, cellulases are relatively costly enzymes, thus its application is an economic disadvantage to the bioenergy technology. In this study, the commercial cellulase application was not needed because the microbial consortia from the WWTP had their own cellulolytic enzyme system.
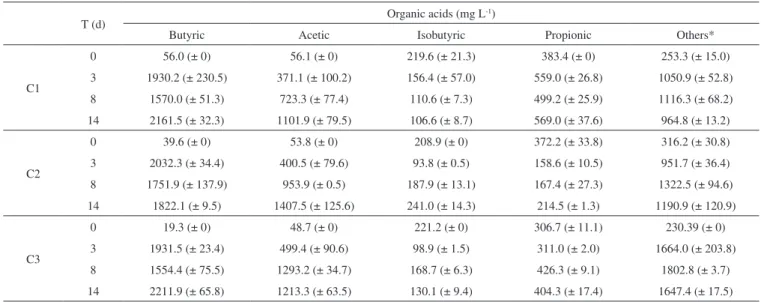
According to Pattra et al.31 the increment of the substrate concentration could increase the metabolites production up to a certain level, but the organic acids accumulation led to a decrease in the pH and to the inhibition of the hydrogen-producing bacteria. In agreement with these authors, higher organic acids concentration was produced (5607.1 mg L-1) in the C3, as seen in Table 1, and the lower final pH (5.4) was observed, corroborating the inhibitory effect of the high substrate concentration. Additionally, high substrate concentration could increase a partial pressure in the fermentation reactor, modifying the metabolic pathway to solventogenesis.30 It was, also, observed in this study; that the ethanol productions in C1, C2 and C3 were of 43.4, 31.8 and 49.9 mg L-1, indicating a deviation of the metabolic route to solventogenesis and consequently decreasing the hydrogen production in C3.
For all conditions, there was a predominance of butyric and acetic acid in relation to other organic acids, which totaled 60% of total acids composition. The presence of these acids in the fermentation of cellulosic material has been widely reported.8,9,32 In C2, which had the highest hydrogen production (39.25 mmol L-1), 1.8 g L-1 of butyric acid and 1.2 g L-1 of acetic acid were produced. The acetic and butyric acids in the three bioassays, 2.0 g L-1 of butyric acid and 1.0 g L-1 of acetic acid, were similar to those reported by Lay (2001)18 using 5.0 g L-1 of cellulose as substrate and a pre-treated mixed culture obtained from an anaerobic digester sludge as inoculum.
The organic acids as a function of the operational period of the batch reactors for the three tested cellulose concentrations are described in the Table 1.
The hydrogen production started at 0.9, 2.4 and 3.4 days (d) in C1, C2 and C3, respectively (Table 2). Li et al.33 observed the λ increasing (0.66 to 0.74 day) with increasing cellulosic substrate concentrations (20 to 40 g L-1), using seed sludge as inoculum for hydrogen production. Ratti et al.9 also reported the λ increasing according to the cellulosic concentration. These authors related increase of λ from 5.1 to 9.2 with 2.5 to 10.0 g L-1 cellulose, respectively, with ruminal fluid as inoculum and commercial cellulase application. This period (λ) corresponds to the time required for the enzymatic conversion of cellulose into soluble sugars and the catabolic conversion of these sugars into hydrogen, organic acids, and alcohols.3 Therefore, the difference in the λ probably occurred due to the period required for the adaptation of the microbial consortium to the increasing cellulose concentration.
It was also observed that the hydrogen yield increased with increasing cellulose concentration, 7.39 to 7.85 mmol L-1 g-1 cellulose (2.0 to 5.0 g L-1, respectively), but decreased when the cellulose concentration was 10.0 g L-1 (2.25 mmol L-1g-1 cellulose). The high concentration of substrate may negatively affect the hydrogen production, either by the high partial pressure,34 or by the excess of soluble sugars released that inhibit both cell growth and cellulase production, which may consequently endanger the end-product yields.6
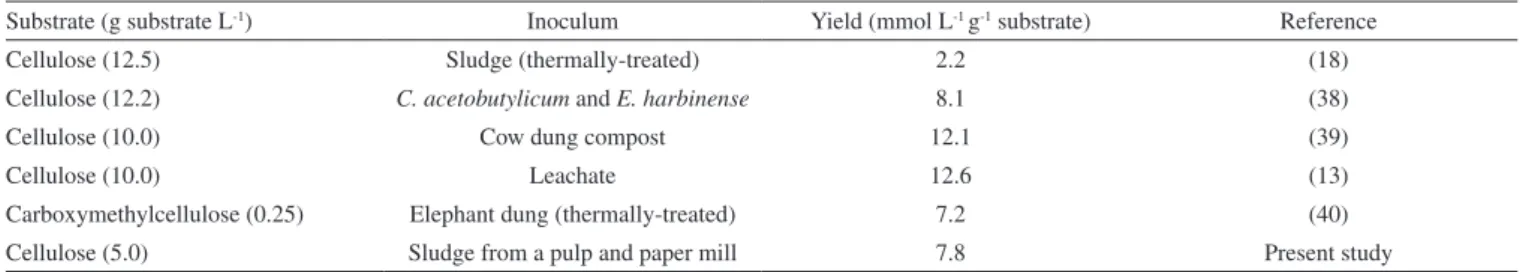
The highest hydrogen yield (7.85 mmol L-1g-1 cellulose) was obtained in C2, indicating that this condition was favorable to the fermentative metabolism. The fermentation of cellulose by microbial consortium has been widely studied.3,9,35,36 The hydrogen yield values in our study are in agreement with the previous studies using cellulose as substrate (Table 3).
Figure 1. Hydrogen production (mmol L-1) in conditions: C1 (2.0 g cellulose L-1),
C2 (5.0 g cellulose L-1) and C3 (10.0 g cellulose L-1)
Table 1. Organic acids concentrations in batch reactors for C1 (2.0 g cellulose/L), C2 (5.0 g cellulose/L) and C3 (10.0 g cellulose/L)
T (d) Organic acids (mg L
-1)
Butyric Acetic Isobutyric Propionic Others*
C1
0 56.0 (± 0) 56.1 (± 0) 219.6 (± 21.3) 383.4 (± 0) 253.3 (± 15.0) 3 1930.2 (± 230.5) 371.1 (± 100.2) 156.4 (± 57.0) 559.0 (± 26.8) 1050.9 (± 52.8) 8 1570.0 (± 51.3) 723.3 (± 77.4) 110.6 (± 7.3) 499.2 (± 25.9) 1116.3 (± 68.2) 14 2161.5 (± 32.3) 1101.9 (± 79.5) 106.6 (± 8.7) 569.0 (± 37.6) 964.8 (± 13.2)
C2
0 39.6 (± 0) 53.8 (± 0) 208.9 (± 0) 372.2 (± 33.8) 316.2 (± 30.8) 3 2032.3 (± 34.4) 400.5 (± 79.6) 93.8 (± 0.5) 158.6 (± 10.5) 951.7 (± 36.4) 8 1751.9 (± 137.9) 953.9 (± 0.5) 187.9 (± 13.1) 167.4 (± 27.3) 1322.5 (± 94.6) 14 1822.1 (± 9.5) 1407.5 (± 125.6) 241.0 (± 14.3) 214.5 (± 1.3) 1190.9 (± 120.9)
C3
Ratti et al.9 obtained higher hydrogen yield (12.6 mmol H2 g-1 cellulose) using 10.0 g L-1 of cellulose and leachate as inoculum. However these authors obtained the hydrolysis of cellulose only after the application of commercial cellulase.
In contrast, Lay (2001)3 reported lower hydrogen yield (2.2 mmol H2 g
-1 cellulose) using a higher substrate concentration (12.5 g cellulose L-1) than the current study (7.8 mmol H2 g-1 cellulose, using 5.0 g cellulose L-1). The low hydrogen yield showed by this author probably was due to the inhibition caused by the high substrate concentration, as well as that demonstrated in the present study with 10.0 g cellulose L-1. Additionally, the selection of a microbial consortium from the pulp and paper mill WWTP was an important advance in the research of hydrogen production with cellulosic biomass.
Soluble carbohydrates in batch fermentation
The conversion of cellulose into soluble carbohydrates confirms the activity of cellulolytic bacteria in the mixed culture (Figure 2). The cellulose degradation into simple sugars is an important step for their efficient conversion in bioenergy, such as hydrogen.37
For all conditions, the hydrogen production increased when a higher concentration of carbohydrates was released (five to ten days from C1 and C2 and four to seven days for C3).
The highest concentration of carbohydrates (112 mg L-1) was observed in C2. Similarly, the highest hydrogen production
(39.25 mmol L-1) was also obtained in this condition, corroborating the efficient cellulose conversion into sugars that can be easily fermented. The soluble carbohydrates consumed in C1, C2, and C3 were 58, 66, and 74%, respectively. There was higher consumption of soluble sugars in the condition with higher substrate concentration (C3, 10.0 g L-1). Botta et al.8 also observed this trend. These authors used paper as substrate for hydrogen production, cellulase for substrate conversion, and obtained 56 to 65% of soluble carbohydrate consumption for concentrations from 0.5 to 4.0 g L-1 of paper and pretreated rumen fluid as inoculum. The reason may be a rapid bacterial growth as a result of higher substrate concentration available. Hydrogen Consumption Routes
For all conditions, decreased hydrogen production was followed by increased methane, hydrogen sulfide and acetic acid (Figure 3), indicating that the formation of these products occurred from hydrogenotrophic methanogenesis, homoacetogenesis and sulfidogenesis metabolisms, respectively.
Therefore, in addition to the cellulolytic/fermentative bacteria, the presence of other microorganisms in this consortium can be inferred, such as methanogenic archaea, hydrogen-consuming bacteria and sulfate-reducing bacteria (SRB) (see section Phylogenetic characterization).
The use of natural non-treated mixed cultures may have led to the increase of methanogenic populations and the consequent consumption of hydrogen.
An important environmental factor associated with methane production is the pH. In this study, the initial pH (6.8) and the final pH (6.1, 6.0 and 5.4, for C1, C2 and C3, respectively) were not a limiting factor for the growth of methanogenic archaea, as it measured the production of 4.40, 3.72 and 9.56 mmol L-1 of methane for C1, C2 and C3, respectively. Although most of the known methanogenic microorganisms grow at near-neutral pH,38 the hydrogenotrophic genus Methanobacterium was identified in anaerobic fluidized bed reactors operated under low pH conditions (4.0-4.5) from a cassava processing wastewater and glucose mixture.39
During the anaerobic digestion, methane can be produced from the bioconversion of hydrogen and/or acetic acid by hydrogenotrophic,40 and acetoclastic archaea,41 respectively. In our study, the higher methane production (9.56 mmol L-1) was obtained in C3. In this condition, the methane production started concomitantly with marked hydrogen decay, while the acetic acid remained constant (Figure 3C), indicating that the methane production was via hydrogen-consuming instead of acetate-consuming metabolism.
Table 2. Gompertz equation kinetic parameters for hydrogen production and yield values (Y)
Condition P (mmol L-1) λ (day) Y (mmol L-1 g-1 cellulose) R2
C1 14.77 (± 0.48) 0.9 (± 0.21) 7.39 0.98
C2 39.25 (± 0.78) 2.4 (± 0.16) 7.85 0.99
C3 22.53 (± 1.51) 3.4 (± 0.37) 2.25 0.98
Table 3. Hydrogen yield using cellulose or carboxymetilcellulose as substrate
Substrate (g substrate L-1) Inoculum Yield (mmol L-1 g-1 substrate) Reference
Cellulose (12.5) Sludge (thermally-treated) 2.2 (18)
Cellulose (12.2) C. acetobutylicum and E. harbinense 8.1 (38)
Cellulose (10.0) Cow dung compost 12.1 (39)
Cellulose (10.0) Leachate 12.6 (13)
Carboxymethylcellulose (0.25) Elephant dung (thermally-treated) 7.2 (40) Cellulose (5.0) Sludge from a pulp and paper mill 7.8 Present study
Figure 2. Temporal profiles of soluble carbohydrates in conditions: C1
Besides methanogenesis, the homoacetogenesis probably occurred in the reactors. The homoacetogenesis is the formation of acetic acid via reduction of CO2 with H2. The genus Clostridium is associated to this metabolism.41
Lazaro et al.42 isolated bacteria from reactors used for hydrogen production and tested its capacity to produce hydrogen in batch experiments using glucose as substrate. These authors reported that C. carboxidivorans was related to the lowest hydrogen yield and relatively high acetic acid production, metabolism associated to homoacetogenesis.
In addition to methanogenesis and homoacetogenesis, the reduction of sulfate, performed by sulfate-reducing bacteria (SRB) is the most important source of H2S in anaerobic systems. The sulphate reduction can occur from four different organic substrates: butyric acid, propionic acid, acetic acid and hydrogen.41,43 The butyric, acetic and propionic acids increased over the incubation period, so these metabolites were probably not used in homoacetogenic. On the other hand, the decrease in hydrogen concentration during the incubation period could be a result of its use during sulfidogenesis. H2S concentrations of 23.1 mg L-1, 13.9 mg L-1 and 24.2 mg L-1 for C1, C2 and C3, respectively, were achieved at the end of the experimental period.
Lin and Chen44 compared the growth of the SRB at pH 6.7 and 5.5 using sucrose as substrate. The authors concluded that the pH
6.7 favored these populations. In this study, the pH (6.8) and the fermentation products (butyric acid, propionic acid, acetic acid and hydrogen) may have contributed to the maintenance of SRB in the reactors.
Effect of cellulose concentration in the structure of microbial communities
Although the same inoculum was applied in all conditions, the cellulose concentration seemed to have favored certain bacterial populations over others since there was a higher similarity between the bacterial populations for conditions with greater cellulose concentration.
There was only a 23% similarity between the conditions with cellulose (C1, C2 and C3) and enrichment reactor (with glucose). Indeed, the bacterial community structure is specific to a particular substrate.45 The low similarity obtained between the reactor fed with cellulose and glucose (enrichment reactor) confirms that the cellulosic substrate influenced the structure of the microbial community developed in the reactors.
The similarity between C1, C2 and C3 was 77%. Similarity of 95% was observed in the populations under conditions C2 and C3, which contained higher cellulose concentration (5.0 and 10.0 g L-1, respectively) (Figure 4).
Figure 3 Temporal profiles of H2, CH4, H2S and Acetic acid concentrations for conditions: C1, 2.0 g cellulose L-1 (A); C2, 5.0 g cellulose L-1 (B) and C3,
10.0 g cellulose L-1 (C)
Figure 4. Dendrogram based on the Pearson coefficient of similarity of the DGGE profiles (enrichment reactor with glucose; C1: 2.0, C2: 5.0 and C3: 10.0 g L-1
The bacterial diversity (Shannon index) was 2.11, 2.08, 2.18, and 2.01 for the enrichment reactor, C1, C2, and C3, respectively. In a similar fashion the bacterial richness (Chao-1 index) was 9, 9, 11, and 8 for the enrichment reactor, C1, C2, and C3, respectively.
There was little variation among the samples, with values close to 2. For the samples of the enrichment reactor (with glucose), it can be inferred that the low diversity observed was a consequence of selective enrichment with the culture medium used, which favored the growth of fermentative bacteria. As for the conditions with cellulose, a greater diversity was verified in C2 (2.18) and a lower diversity in C3 (2.01). It is possible that the fermentative populations were also concentrated in C2, producing hydrogen, because it was the condition under which there was greater hydrogen production (39.25 mmol L-1). The Chao-1 method allows estimating the total number of species in a given community, it estimates the total richness, considering the rare species. Again, for condition C2, with higher hydrogen production, greater richness (11) was observed.
Therefore, the highest hydrogen production (39.25 mmol L-1) was obtained in condition (C2) with high richness and diversity index (9.00 and 2.08, respectively). A possible explanation for this might be that several bacterial populations were related both to cellulose hydrolysis and to hydrogen production. In fact, in anaerobic systems the concomitant hydrolysis and fermentation of cellulolytic substrates is performed by a physiologically diverse populations of cellulolytic microorganisms and non-cellulolytic bacteria.12
Phylogenetic characterization
The cloning and sequencing of bacterial populations resulted in 92 clones, which were arranged into six OTUs. The sequences presented high similarity to the sequences from Clostridium (OTU 1 and 3), Desulfovibrio (OTU 4), Raoultella (OTU 6) and Klebsiella (OTU 6) deposited in the NCBI database (Table 4).
The imposed conditions (pH 6.8 and 37 ºC) favored the growth of Clostridium species identified in the sludge from a pulp and paper mill WWTP. Ho et al.17 also identified bacteria similar to the genus Clostridium in fermentation tests from cellulosic substrates using sewage sludge as inoculum. The high butyric and acetic acid productions obtained in the current study confirmed the active metabolism of Clostridium in the reactors, as reported by Zhang et al.46
Species from Clostridium, found in environmental samples,47 were probably responsible for the cellulolytic activity. Clostridium sp. was also related to the homoacetogenic metabolism,41 which reflects their metabolic plasticity. In this study, the homoacetogenic metabolism
was enhanced by the increasing concentrations of acetic acid, as well as by the decrease in hydrogen concentration.
Clostridium amygdalium, widely reported in cellulolytic environments such as anaerobic-digester sludge,48 was favored by the conditions applied in this study (pH 6.8 at 37 ºC)and products of the cellulose degradation.
Six clones, grouped into OTU 4, were identified as similar to Desulfovibrio sp. These bacteria exhibit fast growth in anaerobic conditions using carbon, sulfate and acetate as substrate.49 In our study, the presence of sulfate in the culture medium and the acetate formed during acidogenesis may have favored the growth and maintenance of these bacteria.
Two clones grouped into OTU 6 had a similarity of 99% with Klebsiella sp. and with Raoultella sp. The species of Klebsiella were isolated from water bodies that receive paper and pulp mill wastewaters,50 reinforcing the activity of these bacteria in our study which used sludge from a pulp and paper mill WWTP as inoculum. Both, Klebsiella and Raoultella, have the ability to degrade cellobiose50 and could have favored the carbohydrates released from cellulose degradation.
Syntrophic relationships among microorganisms are reported in anaerobic environments for cellulose degradation. Cavedon and Canale-Parola51 analyzed the interaction between Clostridium sp. and Klebsiella sp. using cellulose as carbon source. These authors reported that Clostridium sp. degraded cellulose releasing soluble sugars, which were used as substrate for Klebsiella sp. In the same way, Klebsiella sp. produced growth factors, such as biotin and p-amino benzoic acid, which required by Clostridium sp. In our study, Clostridium and Klebsiella were probably acting syntrophically for cellulose degradation.
CONCLUSIONS
This study describes the potential of sludge from a pulp and paper mill WWTP to bioconversion of cellulose without commercial cellulase application. Significant bacterial physiological diversity was verified, which accomplished the cellulose degradation and the bioconversion of soluble carbohydrates to hydrogen, methane and organic acids. Higher hydrogen production (39.25 mmol L-1) was obtained using 5.0 g L-1 of cellulose than in 2.0 g L-1 of cellulose (14.77 mmol hydrogen L-1). However, the increasing substrate concentration for 10.0 g/L may have caused a rapid growth of microorganisms, leading to organic-acid accumulation and pH decrease, which resulted in a hydrogen production of 22.53 mmol L-1. In contrast, the higher methane production (9.56 mmol L-1) was
Table 4. Result of bacterial sequencing
OTU Clones Access number (GenBank) Similarity (%) Bacteria References
1 67 AY353957 99 Clostridium amygdalium 50
FN813488 99 Clostridium sp. Suresh, 2010a
EU862317 97 Clostridium sp. 51
2 10 GU931389 94 Clostridium sp. 52
3 6 HM801879 98 Clostridium sp. 53
4 6 FJ823916 98 Desulfovibrio sp. 54
5 1 AB826036 93 Uncultured bacterium Wang and Zhang, 2013a
6 2 HQ242731 99 Raoultella ornithinolytica Yang, 2010a
FJ587229 99 Raoultella sp. Marone, 2008a
EU256398 99 Klebsiella sp. Li et al., 2007a
obtained in C3 probably from the hydrogen-consuming metabolism as in this condition this production was concomitant with the hydrogen decrease. The microbial consortium consisted of bacteria similar to Clostridium, Klebsiella and Rautella, cellulolytic and fermenting bacteria. These microorganisms probably acted in synergism for the cellulose conversion into the many metabolites obtained in this study. For all conditions, it can be inferred that the conversion of the cellulose, by these bacteria, occurred by acetic-butyric fermentation, since the production of butyric and acetic acid totaled 60% of the total composition of acids.
ACKNOWLEDGMENTS
The authors gratefully acknowledge the financial support of FAPESP (Process 2009/15984-0) and CNPq (Process 131193/2012-0). The authors would like to thank Suzano Pulp and Paper Mill for providing the inoculum.
REFERENCES
1. Lakshmidevi, R.; Muthukumar, K.; Int. J. Hydrogen Energy 2010, 35, 3389.
2. Abdeshahian, P.; Al-Shorgani, N. K. N.; Salih N. K. M.; Shukor H.; Kadier A.; Hamid A.; A.; Int. J. Hydrogen Energy 2014, 39, 12524. 3. Lay, J. J.; Biotechnol. Bioeng. 2001, 74, 280.
4. Temudo, M. F.; Kleerebezem, R.; Van Loosdrecht, M.; Biotechnol. Bioeng. 2007, 98, 69.
5. Schwarz, W. H.; Appl. Microbiol. Biotechnol. 2001, 56, 634. 6. Desvaux, M.; FEMS Microbiol. Rev. 2005, 29, 741.
7. Kim, B. K.; Lee, B. H.; Lee, Y. J.; Jin, I. H.; Chung, C. H.; Lee, J. W.; Enzyme Microb. Technol. 2009, 44, 411.
8. Botta, L. S.; Ratti, R. P.; Sakamoto, I. K.; Ramos, L. R.; Silva, E. L.; Varesche, M. B. A.; Bioprocess Biosyst. Eng. 2016, 39, 1887. 9. Ratti, R. P.; Botta, L. S.; Sakamoto, I. K.; Varesche, M. B. A.; Int. J.
Hydrogen Energy 2013, 38, 9707.
10. Marone, A.; Massini, G.; Patriarca, C.; Signorini, A.; Varrone, C.; Izzo, G.; Int. J. Hydrogen Energy 2012, 37, 5612.
11. Cheng, C. L.; Chang, J. S.; Bioresour. Technol. 2011, 102,8628. 12. Wongwilaiwalin, S.; Rattanachomsri, U.; Laothanachareon, T.;
Eurwilaichitr, L.; Igarashi, Y.; Champreda, V.; Enzyme Microb. Technol. 2010, 47, 283.
13. Pan, C. M.; Fan, Y. T.; Xing, Y.; Hou, H. W.; Zhang, M. L.; Bioresour. Technol. 2008, 99, 3146.
14. Datar, R.; Huang, J.; Maness, P. C.; Mohagheghi, A.; Czernik, S.; Chornet, E.; Int. J. HydrogenEnergy 2007, 32, 932.
15. Urbaniec, K.; Bakker, R. R.; Int. J. Hydrogen Energy 2015, 40, 3648. 16. Ren, N. Q.; Zhao, L.; Chen, C.; Guo, W.Q.; Cao, G. L.; Bioresour.
Technol. 2016, 215, 92.
17. Ho, K. L.; Lee, D. J.; Su, A.; Chang, J. S.; Int. J. Hydrogen Energy 2012, 15582.
18. Atlas, R. M. Media for Environmental Microbiology, 2th ed. Taylor &
Francis group: Florida, 2005.
19. Penteado, E. D.; Lazaro, C. Z.; Sakamoto, I. K.; Zaiat M.; Int. J. Hydrogen Energy 2013, 38, 6137.
20. American Public Health Association, APHA; Standard Methods for the Examination of Water and Wastewater, 21th ed., American Public Health
Association: Washington, DC, 2005.
21. DuBois, M.; Gilles K. A.; Hamilton J. K.; Rebers P. A.; Smith F.; Anal. Chem. 1956, 28, 350.
22. Griffiths, R. I.; Whiteley, A. S.; O’Donnell, A. G.; Bailey M. J.; Appl. Environ. Microbiol. 2000, 66, 5488.
23. Nubel, U.; Engelen, B.; Felske, A.; Snaidr, J.; Wieshuber, A.; Amann, R. I.; J. Bacteriol. 1996, 178, 5636.
24. Blackall, L. L.; Water Sci. Technol. 1994, 29, 35.
25. Maintinguer, S. I.; Fernandes, B. S.; Duarte, I. C. S.; Saavedra, N. K.; Adorno, M. A. T.; Varesche, M. B. A.; Int. J. Hydrogen Energy. 2008, 33, 4309.
26. Saitou, N.; Nei, N.; Mol. Biol. Evol. 1987, 4, 406.
27. Tamura, K.; Stecher, G.; Peterson, D.; Filipski, A.; Kumar, S.; Mol. Biol. Evol. 2013, 30, 2725.
28. Felsentein, J.; Evolution 1985, 30, 783.
29. Zwietering, M. H.; Jongenburger, L.; Rombouts, F. M.; Van´t, R. K.; Appl. Environ. Microbiol. 1990, 56, 1875.
30. Ratti, R. P.; Botta, L. S.; Sakamoto, I. K.; Silva, E. L.; Varesche, M. B. A.; Biotechnol. Lett. 2014, 36, 537.
31. Pattra, S.; Sangyoka, S.; Boonmee, M.; Reungsang, A.; Int. J. Hydrogen Energy. 2008, 33, 5256.
32. Chu, Y.; Wei, Y.; Yuan, X.; Shi, X.; Bioresour .Technol. 2011, 102, 3805. 33. Li, Y. C.; Wu, S. Y.; Chu, C. Y.; Huang, H. C.; Int. J. Hydrogen Energy.
2011, 36, 14245.
34. Valdez-Vazquez, I.; Sparling, R.; Risbey D.; Rinderknecht-Seijas, N.; Poggi-Varaldo, H. M.; Bioresour. Technol. 2005, 96, 1907
35. Wang, A.; Ren, W.; Shi, Y.; Lee, D. J.; Int. J. Hydrogen Energy 2008, 33, 912.
36. Ren, N. Q.; Xu, J. F.; Gao, L. F.; Xin, L.; Qiu, J.; Su, D. X.; Int. J. Hydrogen Energy 2010, 35, 2742.
37. Wang, A.; Gao, L.; Ren, N.; Xu, J.; Liu, C.; Lee, D. J.; Int. J. Hydrogen Energy 2010, 35, 13413.
38. Taconi, K. A.; Zappi, M. E.; Todd French, W.; Brown, L. R.; Bioresour. Technol. 2007, 98, 1579.
39. Rosa, P. R. F.; Santos, S. C.; Sakamoto, I. K.; Varesche, M. B. A.; Silva, E. L.; Bioresour. Technol. 2014, 161, 10.
40. Martin, P. B.; Greger, M.; Schlienz, M.; Int. J. Hydrogen Energy 2015, 42, 5768.
41. Saady, N. M. C.; Int. J. Hydrogen Energy 2013, 38, 13172.
42. Lazaro, C. Z.; Perna, V.; Etchebehere, C.; Varesche, M. B. A.; Int. J. Hydrogen Energy 2014, 39, 6407.
43. Hao, T. W.; Xiang, P. Y.; Mackey, H. R.; Chi, K.; Lu, H.; Chui, H. K.;Water Res. 2014, 65, 1.
44. Lin, C. Y.; Chen, H. P.; Int. J. Hydrogen Energy 2006, 31, 953. 45. Chatellard, L.; Trably, E.; Carrère, H.; Bioresour. Technol. 2016, 221,
541.
46. Zhang, C.; Yang, H.; Yang, F.; Ma, Y.; Current Microbiology 2009, 59, 656.
47. Rainey, F. A. In: Bergey´s Manual of Sistematic Bacteriology; Brenner, D.; Krieg, N.; Staley, J., eds.; New York: Springer, 2009, Class II. Clostridia.
48. Parshina, S. N.; Kleerebezem, R.; Sanz, J. L.; Lettinga, G.; Nozhevnikova, A. N.; Kostrikina, N. A.; Int. J. Syst. Evol. Microbiol. 2003, 53, 1791.
49. Kuever, J.; Rainey, F. A.; Widdel, F. In: Bergey´s Manual of Sistematic Bacteriology; Brenner, D.; Krieg, N.; Staley, J., eds.; New York: Springer, 2005, Family Desulfuvibrionaceae.
50. Grimont, P. A. D.; Grimont, F. In: Bergey´s Manual of Sistematic Bacteriology; Brenner, D.; Krieg, N.; Staley, J., eds.; New York: Springer, 2009, Genus Klebsiella.
51. Cavedon, K.; Canale-Parola, E.; FEMS Microbiol. Ecol. 1992, 86, 237.