68 PROCEDURES FOR THEORETICAL REDISTRIBUTION SOARES, T. S. et al. OF DIAMETERS IN EUCALYPTUS STANDS
Thelma Shirlen Soares1, Hélio Garcia Leite2, Carlos Pedro Boechat Soares2, Antônio Bartolomeu do Vale2 (received: April 27, 2009; accepted: December 21, 2009)
ABSTRACT: This study aimed to evaluate the application of a procedure referred to as step invariant for theoretical redistribution of diameters by class in a diameter distribution model, using the Weibull probability density function. Data from the first rotation of hybrid eucalyptus stands (Eucalyptus grandis x Eucalyptus urophylla) planted with spacings of 3 x 2 m, located in northeastern Bahia state were used. Measurements were taken annually with measurement age ranging between 25 and 89 months. The step invariant procedure provided satisfactory results in comparison to the traditional procedure, being therefore recommended for future applications due to its unbiased results and ease of fit.
Key words:Growth and yield, eucalyptus, diameter distribution.
PROCEDIMENTOS PARA RECUPERAÇÃO DE DISTRIBUIÇÕES DIAMÉTRICAS EM POVOAMENTOS DE EUCALIPTO
RESUMO: Neste estudo, objetivou-se comparar a aplicação de um procedimento denominado de passo invariante para a redistribuição teórica dos diâmetros por classe em um modelo de distribuição diamétrica, empregando a função de densidade de probabilidade de Weibull. Foram utilizados dados da primeira rotação de povoamentos de eucalipto híbrido estaca (Eucalyptus grandis x Eucalyptus urophylla), plantados no espaçamento 3,0 x 2,0 m, localizados na região noroeste do Estado da Bahia, provenientes de medições anuais com idade de medição variando entre 25 e 89 meses. O procedimento de passo invariante demonstrou resultados satisfatórios ao ser comparado com a alternativa tradicional de recuperação dos diâmetros, sendo, portanto, recomendado para futuras aplicações dada a ausência de tendenciosidade dos resultados e simplicidade de ajuste.
Palavras-chave: Crescimento e produção, eucalipto, distribuição diamétrica.
1Forest Engineer, Dr. Professor of Forest Science – Departamento de Engenharia Florestal/DEF – Universidade Federal dos Vales do Jequitinhonha e Mucuri/UFVJM – Rua da Glória, 187 – 39.100-000 – Diamantina, MG, Brazil – [email protected] 2Forest Engineer, Dr. Professor of Forest Science – Departamento de Engenharia Florestal/DEF – Universidade Federal de Viçosa/UFV – Campus universitário – 36570-000 – Viçosa, MG, Brazil – [email protected], [email protected], [email protected]
1 INTRODUCTION
Distribution of future productivity by diameter class is an essential requirement to ensure successful solution of a vast array of management problems to be faced by an integrated forest products company. Determining raw material value and harvesting costs, intermixing products and planning forest management are all activities that reinforce the importance of making productivity distribution projections (HYINK & MOSER JUNIOR 1983).
The mathematical basis of diameter distribution models is the use of a probability density function capable of describing changes in stand structure (number of trees per diameter class), in hypsometric relations and mortality rates, it being possible to analyze these characteristics all simultaneously over time (GUIMARÃES 1994).
Commonly used probability density functions (p.d.f.) to describe the diameter structure of stands include: Gama (NELSON 1964), Log-Normal (BLISS & REINKER
1964), Beta (BURKHART & STRUB 1974, CLUTTER & BENNETT 1965), Johnson Sb (HAFLEY & SCHREUDER 1977), Weibull (BAILEY & DELL 1973), Johnson Sbb (SCHREUDER & HAFLEY 1977), Exponential and Normal (BAILEY 1980). These distributions help derive the probability of trees occurring within diameter classes or intervals with set upper and lower bounds.
Typically, theoretical redistribution of diameters is done by correlating the points of one of the probability distribution functions (p.d.f.) with stand attributes (CAMPOS & LEITE 2006), a method referred to in this study as classical procedure. Guimarães (1994) and Soares et al. (2007) used an alternative procedure to achieve the same purpose—a procedure known as step invariant which is based on analysis of measures of position of diameter distributions—, which, according to the authors, provides consistent results for volume yield projections.
69 Procedures for theoretical redistribution of diameters...
x e x x f 1 ) ( [1] x e dx x f x
F( ) ( ) 1 [2]
1 7843 . 25 5700 . 3 ˆ
lnHd I
i Hd N
D 0 1 2 [4]
[3] i Hd D 3 2 1 0 i D 2 1 0 [6] [5] i ) I I ( 1 2 2 1 2 2 1 e N N [7]
2 MATERIAL AND METHODS 2.1 Data source
Data for the development of this study were collected from unthinned hybrid eucalyptus stands (Eucalyptus grandis x Eucalyptus urophylla) located in the municipalities of Entre Rios and Inhambupe, northeastern Bahia state, with spacings of 3 x 2 m.
173 permanent circular plots were used, each with 12.25 m of radius, with a minimum of two and a maximum of seven measurements taken, with stand age ranging between 25 and 89 months, and measurements taken between 1990 and 1996. The plots involved 48 different projects, in an attempt to obtain and represent variations in productivity in the local eucalyptus plantations. 2.2 Estimation of diameter frequencies
To obtain the proportion of trees in each diameter class, the 2-P Weibull probability density function was used:
where:
= scale parameter; = shape parameter;
x = random variable, DBHclass midpoint in this case, with x 0, > 0, > 0.
The cumulative form F(x) of the Weibull function is:
Function [2] was fitted for each plot and age using the maximum likelihood procedure, according to Gove & Fairweather (1989).
With the estimated parameters of the Weibull distribution function, frequencies by diameter class were derived.
To test the goodness-of-fit of distributions, the chi-square test was used adopting the 1% significance level. 2.3 Theoretical redistribution of diameters by class 2.3.1 Classical procedure
The theoretical redistribution of diameters by class was based on estimation by regression of and g
coefficients, using variables related to stand attributes such as age, mean diameter, number of trees and dominant height. This method was referred to as classical procedure. The dominant height was estimated using an equation fitted by Soares (1999) for the stand in question at the index age of 60 months, as shown below:
where:
d
Hˆ = heights of dominant trees (m);
I = age (months); ln = Napierian logarithm.
To allow monitoring of stand dynamics, the variable ‘mean diameter’ (D) was estimated using the following model:
where:
D = mean diameter (average value) at current age (cm);
N = number of trees; qi= model parameters; ei = random error, e~N (0, s2); Hd = as defined previously.
Shape ( ) and scale ( ) parameters were estimated from the following models:
Number of trees by age was estimated using the model proposed by Piennar & Schiver (1981):
where:
I1 = current age (months); I2 = future age (months);
N1 = number of trees per hectare, at current age I1; N2 = number of trees per hectare, at future age I2; qi, ei = as defined previously.
The models described previously were fitted by the Ordinary Least Square Method and the Nonlinear Least Square Method using software Statistica 7.1 (STATSOFT 2006).
ß
ß
ß
70 SOARES, T. S. et al.
ln ln [1/(1-percentile)] = + ln (X) + i [8]
P50= exp[(-0.3665 - ln )/ ]+ i [9]
P75 = exp[(0.3266 - ln )/]+ i
[12] [11] [10] i P I -ß a P I -ß
f ( -e )P /( -e ) e
P aß
ß a ß
a ß
f1 2 0 1 2
0 1 1 ) ˆ exp( ˆ
0
ˆ
ˆ
1X Y 1 0 ˆ ˆ n X X n Y X XY n i n i n i n i n i 2 1 1 2 1 1 1 1 ˆ
Ha= notH0.
[13]
R2 = 95.4% Syx = 0.0845 ln m The accuracy of derived equations was checked
based on adjusted coefficient of determination (R2 aj) for linear models and correlation coefficient (r) for nonlinear models, residual standard error (Syx) on the original scale of the dependent variable and as a percentage, and graphic analysis of residuals.
2.3.2 Step invariant procedure
With the estimated parameters of the Weibull function, the model was linearized, following a procedure adopted by Guimarães (1994) and Krug et al. (1984), at any percentile of the distribution according to McTague & Bailey (1987), as follows:
where:
X = estimated values of future percentiles, as represented by X1 and X2;
X1 = ln (Pf 50); X2 = ln (Pf 75); Y = values of Y1 and Y2;
Y1 = ln ln (1/1-0.50) = -0.3665; Y2 = ln ln (1/1-0.75) = 0.3266. Pf = percentile at future age; Pa = percentile at current age; Ia = current age measured; If = future age.
2.4 Evaluating the theoretical redistribution of diameters With estimated parameters, theoretical curves of distribution were derived for different stands, by replacing p.d.f. values. A projection was made of the diameter distribution from a current age to a future age, always based on an initial observation.
Each plot being measured at least twice, the first measurement was used as initial age, and then a projection was made for the age of remeasurement.
The compatibility test consisted of analyzing whether the projected diameter distribution from the start to the end of a time interval was compatible with the diameter distribution projected year by year. The chi-square test (x2) at the 1% probability level was used to test the following hypotheses:
The distribution of number of trees by diameter class at the end of the projected period from initial age I1 to I2, I2 to I3, ... , In-1 to In is equal to the distribution of number of trees by diameter class at the end of the projected period from I1 to In
;
;
H0 =
where:
I1 = current age (months);
Ii = future age (months), (i = 2, ..., n). 2.5 Projected timber inventory
Volume yield was estimated on the basis of observed diameter distribution, theoretical diameter redistribution and equations of total height and multiple volumes.
With observed diameter distribution, theoretical diameter redistribution and equations of total height and multiple volumes, estimates were derived of total yield and yield by diameter class for all plots and measurements. Equations fitted by Soares (2006) were used:
Hd DBH
t
Hˆ 0.81574 0.48837 2.53925ln
ln 1
[14]
R2 = 99.9% Syx = 0.0357 m3
.[ . . . 00008 . 0
ˆ DBH1.53553Ht1.44819[e2.25669(Tx/DBH)] V ] ) . ( 1
.[ 1 10.00077.d DBH
71 Procedures for theoretical redistribution of diameters...
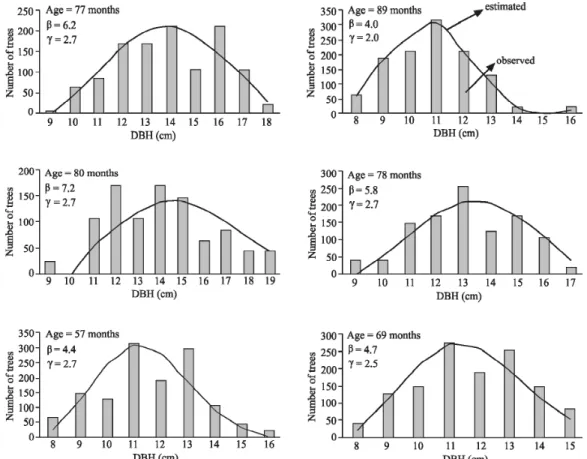
Figure 1 – Observed frequency and frequency estimated by the Weibull function for six randomly selected plots.
Figura 1 – Freqüência observada e estimada pela função Weibull para seis parcelas selecionadas ao acaso.
where:
Ht = total height (m);
DBH = diameter outside bark as measured 1.3 m above the ground (cm);
Hd = dominant height (m); d = commercial diameter (cm); Ht = total height (m);
V = volume (m3); ln = Napierian logarithm; e = Napierian logarithm base;
Tx = binary variable (0 for volume or diameter outside bark d and 1 for volume or diameter inside bark d).
The L&O test proposed by Leite & Oliveira (2002) was applied to compare plot volume to projected volume. This test results from a combination of the F statistic (FH0) proposed by Graybill, the t-test for mean error and the analysis of linear correlation between observed (Yj) and
estimated (Y1) values. It compares an observed value to an estimated value. For instance, where F(H0) and te were
found not significant (ns) and
r
YjY1 ³ 1-|e |, it is inferred that values estimated by regression do not differ from observed values.3 RESULTS AND DISCUSSION 3.1 Fitting the probability density function
72 SOARES, T. S. et al.
D = 6.620468 – 0.052552 N + 0.406683 Hd
R2aj = 0.86 Syx = 0.83 cm Syx% = 3.96%
= 1.810831 – 0.016685 I +0.296597 D - 0.085201Hd R2
aj = 0.42 Syx = 0.63 Syx% = 2.20%
= -2.11962 + 0.004404 I +0.46773 D R2aj = 0.88 Syx = 0.39 Syx% = 7.92%
3.2 Theoretical redistribution of diameters by class 3.2.1 Classical procedure
The equation system is given by:
) 93.72493(I
1 2
004282 . 0 1 004192 . 0 2 e
N N
R2aj = 0.92 Syx = 0.45 Syx% = 6.27%
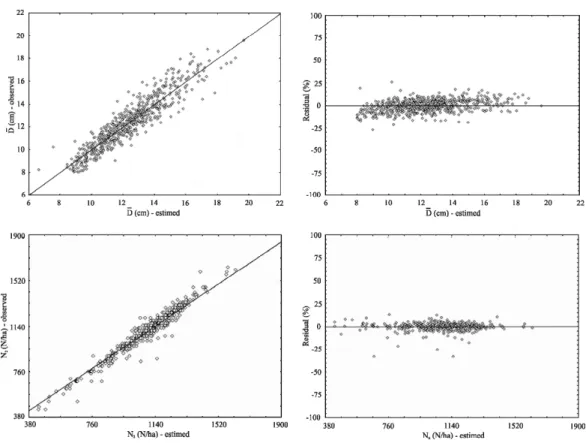
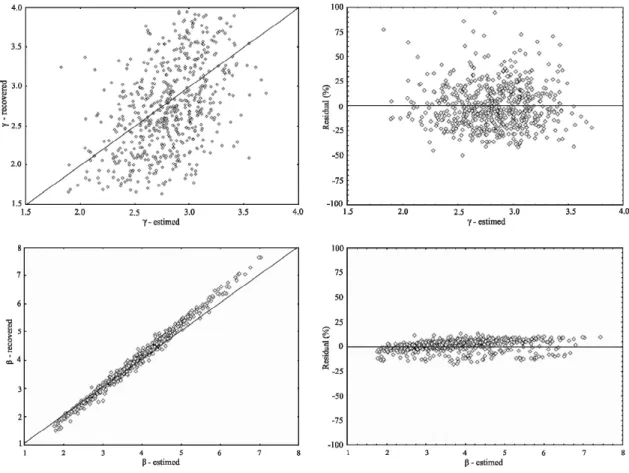
All equations presented acceptable values of coefficient of determination, indicating that the independent variables used in equations have great influence on the dependent variables. According to a graphic analysis of residuals (Figures 2 and 3), it can be inferred that the system provides accurate and consistent b and estimations.
Although the fitted equation to estimate the shape parameter of the Weibull p.d.f. presented a R2 value less than 50%, the value falls within acceptable limits found in related literature. Overall, commonly used diameter distribution models have presented satisfactory results only as far as the expansion parameter ( ) is concerned, with no stand factor conveniently explaining variations in the shape parameter of the function ( ) (GREY 1989, GUIMARÃES 1994).
ß
ß
Figure 2 – Relationship between dependent and independent variables of equations composing the prediction system by diameter class.
73 Procedures for theoretical redistribution of diameters...
Figure 3 – Estimated and recovered values of the and parameters of the Weibull function.
Figura 3 – Valores estimados e recuperados dos parâmetros e da função Weibull.
3.2.2 Step invariant procedure
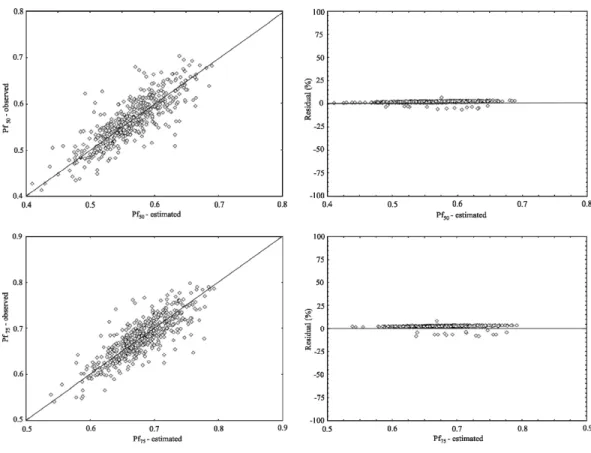
The fitted models to project percentile changes over time resulted in the following equations, the residuals of which are illustrated in Figure 4:
).P
e
-(1
P
- 30.36807If 0.72565Pa50 1.2644150 f
)
e
-/(1
).P
-30.36807Ia 0.72565Pa50 1.2644150 a
R2
aj =0.82 Syx = 0.03 Syx% = 5.14%
).P
e
-(1
P
-4.11011If 0.25093Pa500.2348975 f
)
e
-/(1
).P
4.11011Ia 0.25093Pa500.2348950 a
R2
aj = 0.81 Syx = 0.03 Syx% = 3.88%
3.2.3 Validation of the theoretical redistributions of diameter Redistributionsby the classical procedure and by the step invariant procedure were tested by applying the chi-square test, the result of which is illustrated in Table 1. The chi-square test result showed great prevalence of not significant redistributions (over 90% for both procedures), overall indicating that no difference exists between projections of observed and estimated number of trees by diameter class. This result also confirms the consistency of the step invariant procedure in that it did not differ from the classical procedure usually adopted by the forest sector for diameter predictions.
3.3 Evaluation of the volume yield projection
74 SOARES, T. S. et al.
Figure 4 – Relationship between estimated and observed percentiles.
Figura 4 – Relação entre os percentis estimados e observados.
Table 1 – Percentage of significant (**) and not significant (ns) cases according to the chi-square test ( 2) applied to analyze theoretical redistributions of diameters.
Tabela 1 – Percentual de casos significativos (**) e não significativos (ns) de acordo com o teste Qui-quadrado ( 2) aplicado
para analisar as redistribuições teóricas dos diâmetros.
2 Procedure
** ns
Classical 6.18% 93.82%
Step invariant 5.10% 94.90%
Where: ** = significant; ns = not significant (p < 0.01).
invariant values ranged from -8.2% to 7.6% in comparison to the classical procedure values.
A comparison between projections using the redistribuitions of each procedure was run by the L&O test. Validation results are presented in Table 2, noting that all projections provided accurate estimates in predicting the volume variable.
The comparison between observed and estimated total volumes (Table 3) also indicated a similarity between the volume distributions.
75 Procedures for theoretical redistribution of diameters...
Table 2 – Result of L&O test for validating total yield estimates, with diameter redistributions accomplished by different procedures, at the 5% significance level.
Tabela 2 – Resultado do teste de L&O para validação das estimativas da produção total com redistribuições diamétricas realizadas por diferentes procedimentos, para um nível de significância de 5%.
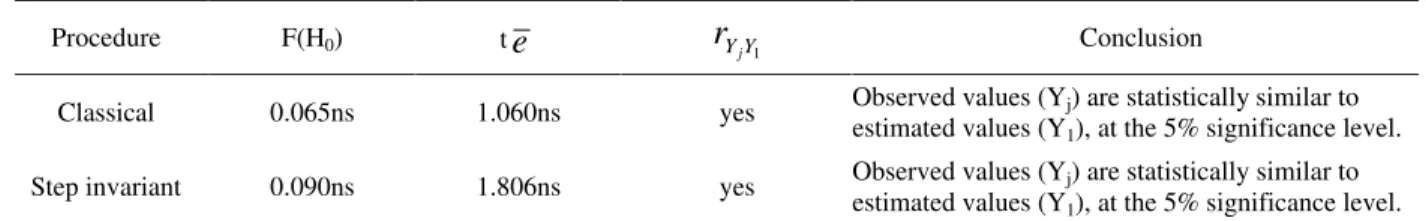
Table 3 – Result of L&O test for comparing total yield estimates by diameter class as observed and predicted by different procedures, at the 5% significance level.
Tabela 3 – Resultado do teste de L&O para comparação das estimativas da produção total por classe diamétrica observados e preditos por diferentes procedimentos, para um nível de significância de 5%.
Procedure F(H0) t
e
r
YjY1 ConclusionClassical 0.065ns 1.060ns yes Observed values (Yj) are statistically similar to estimated values (Y1), at the 5% significance level.
Step invariant 0.090ns 1.806ns yes Observed values (Yj) are statistically similar to estimated values (Y1), at the 5% significance level.
Procedure F(H0) t
e
r
YjY1 ConclusionClassical 0.622ns 1.870ns yes Observed values (Yj) are statistically similar to estimated values (Y1), at the 5% significance level.
Step invariant 0.868ns 1.522ns yes Observed values (Yj) are statistically similar to estimated values (Y1), at the 5% significance level.
Figure 5 – Comparison between observed and predicted volume distributions by diameter class, where: a) classical procedure; b) step invariant procedure.
Figura 5 – Comparação entre as distribuições dos volumes observados e preditos por classe diamétrica. Em que: a) procedimento
76 SOARES, T. S. et al.
4 CONCLUSIONS
The methods used for diameter redistribution provided consistent estimates considering total volumes and volumes by diameter class used.
Diameter redistribution results using the step invariant procedure were statistically similar to results obtained by the classical procedure.
Given its ease of fit in relation to the classical procedure and given the consistency of results, the step invariant procedure for theoretical redistribution of diameters is recommended for use in management of eucalyptus stands.
5 BIBLIOGRAPHICAL REFERENCES BAILEY, R. L. Individual tree growth derived from diameter distribution models. Forest Science, Amsterdam, v. 26, n. 4, p. 626-632, 1980.
BAILEY, R. L.; DELL, T. R. Quantifying diameter distributions with the Weibull function. Forest Science, Amsterdam, v. 19, n. 2, p. 97-104, 1973.
BLISS, D. M.; REINKER, K. A. A lognormal approach to diameter distribution in even age stands. Forest Science, Amsterdam,v. 10, n. 3, p. 350-360, 1964.
BURKHART, H. E.; STRUB, M. R. A model for simulation of planted loblolly pine stands. In: FRIES, J. (Ed.). Growth models for tree and stand simulation. Stockholm: Royal College of Forestry, 1974. p. 128-135.
CAMPOS, J. C. C.; LEITE, H. G. Mensuração florestal: perguntas e respostas. 2. ed. Viçosa, MG: UFV, 2006. 470 p.
CLUTTER, J. L.; BENNETT, F. A. Diameter distributions in old-field slash pine plantations. New York: George Forest Research Council, 1965. 9 p. (Report, 13).
GOVE, J. H.; FAIRWEATHER, S. E. Maximum-likelihood estimation of Weibull function parameters using a general interactive optimizer and grouped data. Forest Ecology and Management, Amsterdam, v. 28, p. 61-69, 1989.
GREY, D. C. Environmental factors and diameter distributions in Pinus radiata stands. South African Forest Journal, Pretoria, v. 149, p. 36-43, 1989.
GUIMARÃES, D. P. Desenvolvimento de um modelo de distribuição diamétrica de passo invariante para prognose e projeção da estrutura de povoamentos de eucalipto. 1994.
160 f. Tese (Doutorado em Ciência Florestal) – Universidade Federal de Viçosa, Viçosa, 1994.
HAFLEY, W. L.; SCHREUDER, H. T. Statistical distributions for fitting diameter and height data in even-aged stands. Canadian Journal of Forest Research, Ottawa, v. 7, p. 481-487, 1977.
HYINK, D. M.; MOSER JUNIOR, J. W. A generalized framework for projecting forest yield and stand structure using diameter distributions. Forest Science, Amsterdam, v. 29, n. 1, p. 85-95, 1983.
KRUG, A. G.; NORDHEIN, E. V.; GIESE, R. L. Determining initial values for parameters of a Weibull model: a case study. Forest Science, Amsterdam, v. 30, n. 3, p. 573-581, 1984.
LEITE, H. G.; OLIVEIRA, F. H. T. Statistical procedure to test the identity of analytical methods. Communications in Soil Science Plant Analysis, New York, v. 33, n. 7/8, p. 1105-1118, 2002.
McTAGUE, J. P.; BAILEY, R. L. Compatible basal area and diameter distribution models for thinned loblolly pine plantations in Santa Catarina, Brazil. Forest Science, Amsterdam, v. 33, n. l, p. 43-51, 1987.
NELSON, T. C. Diameter distribution and growth of loblolly pine. Forest Science,Amsterdam, v. 10, n. 1, p. 139-153, 1964.
PIENAAR, L. V.; SHIVER, B. D. Survival functions for site prepared slash pine plantations in the flat woods of Georgia and Northern Florida. Southern Journal of Forestry, Pretoria, v. 5, n. 2, p. 59-62, 1981.
SCHREUDER, H. T.; HAFLEY, W. L. A useful bivariate distribution for describing stand structure of tree heights and diameters. Biometrics, Washington, v. 33, n. 3, p. 471-488, 1977.
SOARES, C. P. B. Um modelo para o gerenciamento da produção de madeira em plantios comerciais de eucalipto. 1999. 71 f. Tese (Doutorado em Ciência Florestal) – Universidade Federal de Viçosa, Viçosa, 1999.
SOARES, S. T.; LEITE, H. G.; VALE, A. B.; SOARES, C. P. B.; SILVA, G. F. Avaliação de um modelo de passo invariante na predição da estrutura de um povoamento de Eucalyptus sp. RevistaÁrvore, Viçosa, v. 31, n. 2, p. 275-283, 2007.
SOARES, T. S. S. Avaliação de modelos de distribuição diamétrica em povoamentos de eucalipto não desbastados. 2006. 63 f. Tese (Doutorado em Ciência Florestal) – Universidade Federal de Viçosa, Viçosa, 2006.