Comparative genome-wide polymorphic microsatellite markers in Antarctic
penguins through next generation sequencing
Juliana A. Vianna
1,2, Daly Noll
1, Isidora Mura-Jornet
1, Paulina Valenzuela-Guerra
1,
Daniel González-Acuña
3, Cristell Navarro
4, David E. Loyola
4and Gisele P.M. Dantas
51
Departamento de Ecosistemas y Medio Ambiente, Pontificia Universidad Católica de Chile, Santiago,
Chile.
2
Centro de Cambio Global UC, Santiago, Chile.
3Departamento de Ciencias Pecuarias, Facultad de Ciencias Veterinarias, Universidad de Concepción,
Chillán, Chile.
4
Centro Nacional de Genómica y Bioinformática, Santiago, Chile.
5
Pontifícia Universidade Católica de Minas Gerais, Belo Horizonte, MG, Brazil.
Abstract
Microsatellites are valuable molecular markers for evolutionary and ecological studies. Next generation sequencing is responsible for the increasing number of microsatellites for non-model species. Penguins of thePygoscelis genus are comprised of three species: Adélie (P. adeliae), Chinstrap (P. antarcticus) and Gentoo penguin (P. papua), all distributed around Antarctica and the sub-Antarctic. The species have been affected differently by climate change, and the use of microsatellite markers will be crucial to monitor population dynamics. We characterized a large set of genome-wide microsatellites and evaluated polymorphisms in all three species. SOLiD reads were generated from the libraries of each species, identifying a large amount of microsatellite loci: 33,677, 35,265 and 42,057 forP. adeliae, P. antarcticus and P. papua, respectively. A large number of dinucleotide (66,139), trinucleotide (29,490) and tetranucleotide (11,849) microsatellites are described. Microsatellite abundance, diversity and orthology were characterized in penguin genomes. We evaluated polymorphisms in 170 tetranucleotide loci, obtaining 34 polymor-phic loci in at least one species and 15 polymorpolymor-phic loci in all three species, which allow to perform comparative stud-ies. Polymorphic markers presented here enable a number of ecological, population, individual identification, parentage and evolutionary studies ofPygoscelis, with potential use in other penguin species.
Keywords: microsatellite markers, penguin, genome, polymorphism, tetranucleotide.
Received: August 22, 2016; Accepted: March 17, 2017.
Introduction
The high level of polymorphism in microsatellites, or short tandem repeats (STRs), coupled with their codo-minant nature, is advantageous for population genetics or behavioral studies, such as paternity tests, investigation of mating patterns, phylogeography, etc. However, the identi-fication of microsatellites in non-model species by tradi-tional methods is a time-consuming process requiring ex-tensive laboratory procedures and Sanger sequencing to achieve isolation of only a few loci per surveyed genome. The restricted number of loci identified through traditional methods may limit the results of a study. Therefore, most investigations on non-model organisms rely on
cross-am-plification of microsatellite loci from closely related spe-cies, a procedure whose applicability decreases as the evo-lutionary divergence among taxa increases. This is the case of bird species, for which microsatellite loci are much less abundant than for other vertebrate classes (Primmeret al., 1997; Neff and Gross, 2001). Dawsonet al.(2010) evalu-ated microsatellites across several bird species belonging to 15 orders and selected cross-species markers, thus reducing the costs and time associated with developing new ones. However, the use of microsatellites developed for different species is subject to scoring errors, such as null alleles, which can lead to biases in ecological and evolutionary conclusions drawn from the data (Dewoodyet al., 2006). Null alleles occur when one allele does not amplify because of mutations in the sequence where a primer was designed to anneal, which can often occur with unspecific primers (Dakin and Avise, 2004). On the other hand, using different microsatellites developedde novo for each species limits
Genetics and Molecular Biology, 40, 3, 676-687 (2017)
Copyright © 2017, Sociedade Brasileira de Genética. Printed in Brazil DOI: http://dx.doi.org/10.1590/1678-4685-GMB-2016-0224
Send correspondence to Juliana A. Vianna. Departamento de Eco-sistemas y Medio Ambiente, Facultad de Agronomía e Ingeniería Forestal, Pontificia Universidad Católica de Chile. Av. Vicuña Mackenna 4860, Santiago, Chile. E-mail: [email protected].
prospects of comparative studies between taxa. For that reason, identification of microsatellite loci common for a few closely related species of interest, allows comparative ecological and evolutionary inquiries.
Recent Next Generation Sequencing (NGS) technol-ogies make it feasible to obtain a large number of markers (e.g.microsatellites, SNPs) and have thus revolutionized molecular studies in non-model organisms, permitting rapid characterization of gene structure and expression (Ellegren, 2008). Studies using neutral microsatellites can provide information to understand aspects of species’ ecol-ogy and population genetic structure (Freer et al., 2015; Viannaet al., 2017). Moreover, behavioral differences be-tween males and females are frequently interpreted com-paring population genetic patterns obtained from different markers such as mtDNA (maternal lineage) and micro-satellite loci (biparental lineage; Freeret al., 2015; Vianna
et al., 2017). An increasing number of genomes have
re-cently become available, including those of several bird species (Jarviset al., 2014; Zhanget al., 2014), with two species of penguins among them (Liet al., 2014). Those studies focus on genome description and structure, phylog-eny, adaptation, and comparative analyses. Although a large number of microsatellite loci are becoming available for new genomes, they are seldom evaluated with regard to their level of polymorphism in related species.
Antarctic organisms have been strongly affected by climate change during the past 50 years, mostly in the West Antarctic Peninsula (WAP), where effects are more drastic (e.g.Croxallet al., 2002; Meredith and King, 2005; Mon-tes-Hugoet al., 2009; Trathanet al., 2011). Genomic stud-ies using NGS technology can, thus, provide different mo-lecular markers to help understand adaptation, population dynamics and behavior of Antarctic taxa.
Penguins represent a monophyletic group from the Spheniscidae family, encompassing 18 species distributed exclusively in the Southern Hemisphere (Stonehouse, 1975; Williams, 1995).Pygoscelispenguins are comprised of three species, the Adélie penguin (P. adeliae), the Chin-strap penguin (P. antarcticus) and the Gentoo penguin (P. papua), all adapted to the cold temperatures around Antarc-tica and the sub-Antarctic islands. Among the three living species,P. papuahas the most northern distribution along the Antarctic Peninsula and sub-Antarctic islands. P. antarcticushas a more southern distribution almost exclu-sively around the Antarctic Peninsula, andP. adeliaeis the most dependent on ice, reaching higher latitudes and a cir-cumpolar distribution (Stonehouse, 1975).P. adeliae,P.
papua and P. antarcticus are classified by the IUCN as
Least Concern (IUCN - International Union for Conserva-tion of Nature, 2017).
Molecular DNA studies of Pygoscelis were mostly restricted to sequences (Ritchie and Lambert, 2000; Ritchie et al., 2004; Peñaet al., 2014; Clucaset al., 2014), except for a study of P. adeliae using six dinucleotide
micro-satellites (Roederet al., 2001). These were developed by traditional methods using genomic libraries (Roederet al., 2001; 2002) and then investigated for cross-amplification in 16 other species of penguins, most of which were mono-morphic (Roederet al., 2002). Recently, Kanget al.(2015) isolated sixteen polymorphic microsatellite loci for the chinstrap penguin (P. antarcticus), while Liet al.(2014) sequenced the genomes of P. adeliae and Aptenodytes forsterito study the phylogenetic and population history of penguins, but neither evaluated microsatellites for poly-morphisms.
The threePygoscelisspecies in this study have suf-fered the effects of climate change, with reductions in pop-ulation size, changes in distribution, and even local extinction. The WAP, a large area where these species are found, is the Antarctic region that has been most affected by climate change. Therefore, genetic studies of population structure, using variable molecular markers, are important in monitoring these Antarctic species in space and time.
We sequenced the genomes ofPygoscelis adeliae, P.
antarcticus and P. papua using the Applied Biosystems
Support Oligonucleotide Ligation Detection (SOLiD) plat-form, and identified and characterized microsatellite loci evaluating and comparing structure (motif class and type) among species. We also report a genome-wide set of sev-eral microsatellite loci for cross amplification in all three Pygoscelisspecies and the evaluation of the degree of poly-morphism of several tetranucleotide loci. Finally, we report a set of primers designed for several microsatellite loci. These have similar melting temperatures and allow multi-plex amplification using the same PCR protocol. These loci can be an important resource for future genetic studies of penguin populations to help management and conservation of these species in the face of climatic change.
Material and Methods
SOLiD sequencing
Genomic DNA was isolated fromPygoscelis papua,
P. antarcticusandP. adeliaeblood samples preserved in
ethanol using the salt method (Aljanabi and Martinez 1997). DNA from six individuals belonging to the three species was quantified and quality checked by fluorometry using the PicoGreen®assay kit (Invitrogen). Genomic se-quencing in ABISOLiD 5500 XL was performed at Omics Solution, a Next Generation Sequencing facility (Santiago, Chile). DNA was desalted and then concentrated using standard EtOH/sodium acetate precipitation at 20 °C for 2 h, followed by two 70% EtOH washes. The pooled DNA was re-dissolved in low TE as per standard protocol for ABI SOLiD sequencing of genomic DNA fragment librar-ies. DNA samples were sheared in a CovarisS220 System (Thermo Fisher Scientific), which sonicates the input DNA into small fragments with a mean size of around 160 bp.
The fragmented DNA was then purified with SOLiD Library Column Purification Kit (Thermo Fisher Scien-tific), and libraries were prepared according to standard SOLiD protocols. Fragment libraries for the twelve pen-guin samples were prepared separately as follows: P1 and P2 adapters (Thermo Fisher Scientific) were ligated, and each sample was tagged with a different barcode (a known adapters sequence of ten bp). Prepared libraries were quan-tified by real-time PCR in a Light Cycler®Nano (Roche) using the Quantification Kit for SOLiD (Invitrogen). Each double stranded library was added at a concentration of 0.2 pg/mL to the emulsion with 2,400 million beads, according
to the manufacturers’ instructions. Thirty percent of the beads were P2 positive (contained amplified library frag-ments) before enrichment, and 90% of the beads were P2 positive after enrichment, yielding 790 million beads de-posited in the Flow Chip. Library beads were sequenced in a SOLiD 5500 XL using standard chemistry for paired-end fragment libraries and 35-75 bp read lengths.
SOLiD sequence alignment
The color-space reads (di-base encoded) were aligned with LifeScope software (Applied Biosystems) using the genome assembly ofP. adeliae(Liet al., 2014) as refer-ence. The reference was translated into color-space with the aim of mapping the reads. The color-space reads helped to improve the quality of each base call, since each base was read twice during the sequencing step.
The consensus sequence was built from the binary alignment map (BAM) files obtained in the previous step. We used the SAMtools (Li et al.,2009) repositories to ob-tain all bases mapped to each position, BCF tools to get the most probable genotype per position, and VCF utilities to build the consensus sequence in FASTQ format. The FASTQ file was then converted to FASTA using SEQTK (Li, 2012).
Identification of microsatellite loci
The search for dinucleotide, trinucleotide, and tetra-nucleotide tandem repeats in the obtained scaffolds were
done using MISA software
(http://pgrc.ipk-gatersleben.de/misa/). We designed primers to amplify re-peat fragments of 200 bp or less. Oligonucleotide primer pairs flanking the microsatellite sequence were designed using Primer 3.0 software (Rozen and Skaletsky, 2000; http://primer3.sourceforge.net/) based on the following pa-rameters: product size of 150-250 and 250-300 bp; TM of 60 °C, ranging between 58 and 63 °C. Reverse-complement repeat motifs (e.g.TG and CA) and translated or shifted motifs (e.g.TGG and GTG) were grouped together such that there were a total of four, 10 and 33 unique dinucleo-tide, trinucleotide and tetranucleotide repeats, respectively.
Microsatellite isolation and evaluation
From our list of potential primers present inP. papua (Gentoo penguin, GP),P. antarticus (Chinstrap penguin, CP) andP. adeliae(Adélie penguin, AP) (Table S1), we chose a subset for evaluation in all three species. The first criterion for selection was a tetranucleotide, simple and perfect SSR repeat motif and TM of 60 °C. Primer pairs for each locus were evaluated using the AmplifX v. 1.5.4 soft-ware (http://crn2m.univ-mrs.fr/pub/amplifx-dist) consider-ing the stability of the PCR reaction, percentage of GC, stability at 3’, the absence of dimers or hairpins. Although tetranucleotide microsatellites may have lower mutation rates than dinucleotides (Kruglyaket al., 1998; Schug et al., 1998), we decided to carry on our analysis using poly-morphic tetranucleotides that amplify in all three penguin species. Amplification of artifact bands (or stutter bands) in dinucleotide repeats can lead to misidentification of an al-lele, something that is less likely to happen in tetranucleo-tide repeats. Tetranucleotetranucleo-tide microsatellites have shown higher discriminatory power among closely related popula-tions than most dinucleotides (e.g., Greig et al., 2003; Huanget al., 2015). Hence, tetranucleotides are becoming increasingly popular markers because allele differences are easier to distinguish than those of dinucleotide repeats.
Therefore, 170 loci of tetranucleotide SSR repeat mo-tifs were selected to evaluate polymorphisms in each
Pygoscelis species. PCR reactions incorporated the
for-ward primers with 5’-end-M13 tail, the fluorophore-labeled M13 primer (Schuelke, 2000) with 6-FAM, NED or HEX (Applied Biosystems) and a reverse primer. The anal-ysis was done on 26 samples, nine from P. papua, nine fromP. antarcticusand eight fromP. adeliae, with individ-uals from three, three and two different sampling locations, respectively.
We searched for orthology for all tetranucleotide loci between pairwise species and all three species considering 100% identity between the primers sequences using the op-tion Find Duplicates in Excel and the criteria of locaop-tion at the same scaffold and same locus motif.
Polymerase chain reactions (PCRs) were carried out in a 30mL volume containing 2mL of DNA at 25 ng/mL, 1X
reaction buffer, 1.5 mM of MgCl2, 200 uM of each dNTP, 0.4mM of each primer, and 0.8 units ofTaqDNA
polymer-ase (Brasil, Invitrogen). The PCR protocol was as follows: 10 min at 95 °C, a touchdown series of 95 °C for 15 s, 60–50 °C for 30 s, 72 °C for 45 s, with two cycles at each annealing temperature, and 35 amplification cycles of 95 °C for 15 s, 50 °C for 30 s, 72 °C for 45 s, followed by a fi-nal extension step of 30 min at 72 °C. All PCR products were loaded on 3% agarose gels with SB buffer (Brody and Kern, 2004), and also on non-denaturing 12% acrylamide gels (99:1 acrylamide: bis-acrylamide), and run for 0.5 h at 300 V, and 3 h at 300 V, respectively. Bands in agarose gels
were visualized with GelRed on an UV transilluminator, and acrylamide gels were stained with silver nitrate.
For our purposes, PCR amplification of a micro-satellite was considered successful if a band of the expected size was observed after gel electrophoresis, even if two or more bands were amplified. Monomorphic tetranucleotide loci observed were discarded, and all loci with more than one allele were genotyped at Macrogen Inc. (Korea). Elec-trophoretograms were analyzed using GeneMarkerv1.75 (Softgenetics LLCTM, State College). A microsatellite lo-cus was considered successful if the resulting electrophore-tograms showed at least two alleles per locus in all three species, but never more than two alleles in a single individ-ual. The reads containing polymorphic tetranucleotides were deposited in GenBank under accession numbers KU182396–KU182429.
The number of observed alleles (NA) and observed heterozygosities (Ho) were calculated using Arlequin 3.5 (Excoffier and Lischer, 2010). The probability of identity (PI) and PI between siblings (PIsibs) was calculated using GenAlEx 6.5 (Peakall and Smouse, 2012). PI values esti-mate the probability that two individuals, taken at random from a population, will have the same genotype at multiple loci (Waitset al., 2001). PI is calculated to determine the number of loci required to resolve individual identity within populations by gradually increasing the number of loci, adding the most variable loci first (Waitset al., 2001). PIsibs is a similar but more conservative estimate of the number of loci required to establish individual identity.
Fifteen polymorphic loci were then evaluated for one population ofP. papua(n = 30) and one ofP. antarcticus(n = 30). These loci were selected based on the criteria of be-ing polymorphic for all threePygoscelisspecies (11 of 15 loci selected) or polymorphic for one or both species (4 loci). The number of observed alleles (NA) and observed (Ho) and expected heterozygosities (He) were calculated us-ing Arlequin 3.5 (Excoffier and Lischer, 2010). Deviations from Hardy-Weinberg equilibrium were calculated with theFISindex in Genetix v. 4.05 (Belkhiret al., 2004).
Results
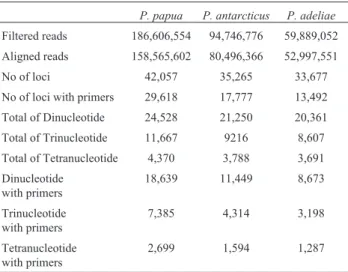
For thePygoscelisgenome, a total of 59,889,052 fil-tered reads and 52,997,551 aligned reads were obtained for
P. adeliae, 186,606,554 filtered reads and 158,565,602
aligned reads for P. papua and 94,746,776 filtered and 80,496,366 aligned reads forP. antarcticus(Table 1).
Identification of microsatellite markers
We identified a total of 35,265, 42,057, and 33,677 microsatellite loci in the genomes ofP. antarcticus,P. pa-pua, and P. adeliae, respectively. Among these markers were 17,777, 29,618, and 13,492, respectively, which showed flanking region sequences suitable for primer de-sign. We identified a total of 38,761 dinucleotide, 14,897 trinucleotide and 5,580 tetranucleotide repeats with the
primer design in all three genomes (Table 1). The micro-satellite loci turned out to be genome-wide distributed across different scaffold (Table S1). Loci motifs, primer se-quences, melting temperatures, product size and scaffold for 5,580 tetranucleotides that occur in all threePygoscelis genomes are included in Table S1 as well. From these 5,580 tetranucleotide loci, 70 were confirmed to be orthologous for all three species, showing 100% identity for both prim-ers sequences (forward and revprim-erse) for the same locus and showing the same scaffold and same locus motif (Table S1). However, this number may be underestimated since the comparison considered 100% identity for both primers designed independently between species. In Pairwise spe-cies comparisons we found orthology in 477, 245 and 142 loci between GP/CP, GP/AP, AP/CP respectively.
All species showed higher and similar numbers of dinucleotides, followed by trinucleotides and tetranu-cleotides (Figure 1). The frequencies of specific repeat mo-tifs were similar for the three species. For dinucleotides, CA repeats were the most frequent across all species, fol-lowed by TC, AT and a reduced number of GC loci (Figure 2A). For trinucleotides, AAT was the most abundant, fol-lowed by CCA and GGA (Figure 2B). For tetranucleotides, the most frequent repeat was AAAC, followed by AAAT and AAGG (Figure 2C).
Polymorphism of microsatellite loci forPygoscelis
species
From the 60,877 primers designed, 170 were selected to evaluate polymorphisms inPygoscelis: 90 loci based on
the P. adeliae genome, 40 on P. papua and 40 on P.
antarcticus. Of these, 34 were easily amplified in all three species using the same PCR conditions and were visibly polymorphic at electrophoretic mobility. These 34 loci were also genome wide distributed, being mostly identified in different scaffolds, with exception of six loci which were
Viannaet al. 679
Table 1- Number of reads (filtered and aligned), number of microsatellite loci and motifs for all threePygoscelisspecies, including the total of loci and only those that showed flanking region sequence for primer design.
P. papua P. antarcticus P. adeliae
Filtered reads 186,606,554 94,746,776 59,889,052
Aligned reads 158,565,602 80,496,366 52,997,551
No of loci 42,057 35,265 33,677
No of loci with primers 29,618 17,777 13,492
Total of Dinucleotide 24,528 21,250 20,361
Total of Trinucleotide 11,667 9216 8,607
Total of Tetranucleotide 4,370 3,788 3,691
Dinucleotide with primers
18,639 11,449 8,673
Trinucleotide with primers
7,385 4,314 3,198
Tetranucleotide with primers
found in three different scaffolds (Table 2). Among these 34 loci, 14 were isolated fromP. adeliaegenome, 11 from P. papua, and 9 fromP. antarcticus. We evaluated these loci in 26 individuals, where 15 loci were polymorphic in all three species, 13 were polymorphic in two species and 6 were polymorphic in one of the three species (Table 2). Therefore, a total of 30 polymorphic microsatellites were identified in P. adeliae, 25 in P. papua, and 22 in P. antarcticus. Out of all 15 polymorphic loci, the number of alleles per species and per locus varied between 2 and 8. The highest number of alleles per locus was found inP.
adeliae(mean 4.87; SD 1.36), followed byP. antarcticus
(mean 4.47; SD 1.68) andP. papua(mean 3.53; SD 1.25). Heterozygosity was always higher for P. adeliae (Ho = 0.59), followed byP. papua(Ho= 0.54) andP. antarcticus (Ho= 0.42) in all 15 loci. Moreover, when we compared the statistics between microsatellite markers isolated from each species’ own genome with those isolated from other spe-cies’ genomes, we found similar ranges of allele numbers and heterozygosity (Table 3). This suggests that these mar-kers are not subject to decreased heterozygosity among species of this genus due to cross-species amplification. These results receive support from the orthology of those markers for all three species. Fifty two percent of the microsatellite loci from those 34 selected according to their polymorphism were identified in two or all three
Pygoscelisspecies and 100% were identified at the same
scaffold, and frequently showed the same primer sequence between species. These orthologous percentages were sig-nificantly reduced to 3 of 34 loci when we considered 100% identity for both primers simultaneously.
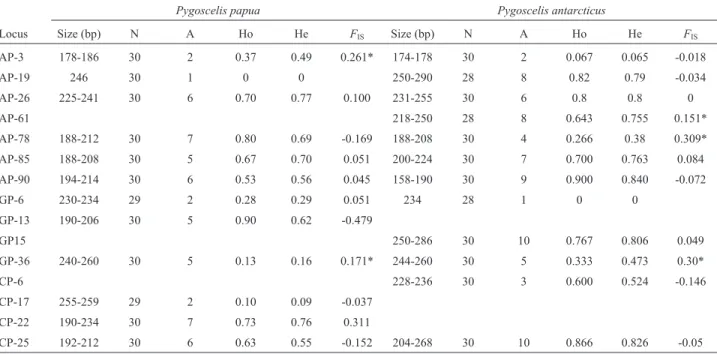
When evaluating 12 loci for one population ofP.
pa-puaandP. antarcticus(n = 28-30), we observed that the
number of alleles per species per locus varied between 1 to 7 and 1 to 10, respectively (Table 4). Only two loci showed
departure from Hardy-Weinberg Equilibrium forP. papua and three forP. antarcticus. The probability of identity (PI, the probability of two independent samples having an iden-tical genotype), based on all 15 microsatellites, resulted in values as low as 1.4E-13, 2.5E-9, and 1.2E-11, and PIsibs (probability of identity when random siblings are included in the samples) as low as 5.5E-06, 1.5E-04, and 2.8E-05 for P. adeliae, P. papuaandP. antarcticus, respectively (Fig-ure S1). PI was close to zero when combining only the three most polymorphic loci and the same effect was seen in PIsibs when combining the six most polymorphic loci. Markers with the lowest PI are GP-15 (4.8E-02), AP-26 (5.2E-02), and GP-04 (6.7E-02) in P. adeliae; AP-26
680 Microsatellite markers in penguins
Figure 2- Number of dinucleotide (A), trinucleotide (B) and tetra-nucleotide (C) loci with different motifs identified inP. Adeliae(black bar), P. papua(light gray bar) andP. antarcticus(dark gray bar).
Vianna
et
al.
681
Table 2- Tetranucleotide microsatellite loci polymorphic in all threePygoscelisspecies (P3), in two species (P2), and one (P1), with their respective scaffold, locus, primer sequence, motif, number of samples (N), number of observed alleles per marker (A) and observed heterozygosity (Ho).
Pygoscelis adeliae Pygoscelis papua Pygoscelis antarcticus
Scaffold Locus Primer sequence (5’-3’) Motif Size (bp) N A Ho Size (bp) N A Ho Size (bp) N A Ho
P3 51 AP-26 F: TGGGGAGCAGAGTATTTTTGTT (GATA)7 205-245 6 8 0.67 217-241 9 6 0.78 231-263 9 5 0.56
R: AGCCACGAAAAGTGAGCCTA
46 AP-61 F: GCTCTCAGTTGAGCAAACCC (TTTG)6 230-242 8 4 0.63 216-228 9 2 0.67 230-250 9 6 0.78
R: TTCGTGCTTCTTGCTTTCCT
181 AP-78 F: CCACTGCAGTATCCCATTTTT (TATC)6 188-200 8 4 0.50 188-208 9 5 0.56 188-208 9 3 0.22
R: GGTCAAAGCTTACCATCCCA
27 AP-85 F: CAAAACAGTCACTAGTGTGCCA (ATCT)9 212-232 8 6 1.00 188-204 9 4 0.44 204-210 9 4 0.44
R: TACGCCAATGAAAAGCACTG
44 AP-90 F: TGCATGTTGGAACATCAAAA (GATA)7 162-178 8 5 0.88 194-206 9 3 0.78 162-186 9 7 0.44
R: AACACACACACGTGCACTCTT
18 GP-4 F: TCATCACCAATGGTTCAGAAA (ATGA)5 212-232 8 6 1.00 256-264 9 3 0.44 268-284 9 5 0.78
R: CCATGTGGTATTCATTCtGGTG
100 GP-6 F: AACATCTCATGAAGGCACAGC (CATC)5 234-246 8 4 0.63 230-238 9 3 0.67 234-238 9 2 0.11
R: GTACCATGCCCTTTCTGATGA
57 GP-13 F: CACATCCTTTCCCTCTCTTCC (AGAT)11 182-202 7 4 0.29 194-202 9 3 0.67 190-202 6 3 0.33
R: AAGGAGYGTGCCTAGTTTTGG
86 GP15 F: CTGTATTGAGATGGCCGTTGT (CATC)7 250-274 8 7 0.38 254-266 9 5 0.44 250-274 9 4 0.22
R: GTACCCACCGACTTCTCTTCC
101 GP-18 F: GGTCACCATGAGCAGTCAGTT (ATAG)10 194-206 8 4 0.63 190-202 9 3 0.22 194-202 9 2 0.11
R: TGAAAAGCTCTCCCCACAGTA
356 GP-19 F: TTGGGGAAATGACAACCCTAT (TATC)5 223-239 7 4 0.71 227-235 9 3 0.67 221-227 9 3 0.22
R: CCCTCACTGCTCAAGTCTGTC
241 GP-36 F: CTGTAAGTCACAGCGTGCAAA (ATAC)5 248-256 8 3 0.25 248-268 8 5 0.50 252-264 6 4 0.17
R: TGTGAGAACCATTGGACTTGT
240 CP-6 F: AGGCTTTCTCACACTGTGCTC (CTAC)5 212-232 8 5 0.88 212-216 9 2 0.22 204-228 9 6 0.67
R: AATGAGCAATTCAGGATGGTG
174 CP-25 F: GTCAAAGCCTGCRTCAACTCT (CATC)13 196-224 7 4 0.43 200-216 9 5 0.78 208-242 8 7 0.75
R: ATGACACTGGCAAAGGAGATG
189 CP-29 F: GCATCAGATCCCAGAATACCA (AGAC)5 184-216 7 5 0.57 180-188 9 2 0.11 188-192 8 2 0.13
R: TCTGGCAGTATGGGAAAACAC
P2 108 AP-3 F: AAGCAGGGAAACCATACAAAGA (ATAA)7 174-186 8 3 0.38 182-190 9 2 0.78 178 9 M
-R: GGTCTGAGTAAGGCTCTTCAGG
197 AP-12 F: AGGACAACGAGGCGAGAGT (GAAG)5 212-216 8 2 0.25 212 9 M - 212-216 9 2 0.33
682
Microsatellite
markers
in
penguins
Pygoscelis adeliae Pygoscelis papua Pygoscelis antarcticus
Scaffold Locus Primer sequence (5’-3’) Motif Size (bp) N A Ho Size (bp) N A Ho Size (bp) N A Ho
218 AP-14 F: TGGTAAACAGTCACACGGGA (AAAC)5 224-228 8 2 0.75 228 9 M - 220-224 9 2 0.22
R: CCAAAACTGAGAAGCAACCC
37 AP-19 F: CCAGTGTTTGACCACCCTCT (ATAA)7 250-258 8 3 0.5 246 9 M - 250-262 7 4 0.71
R: TGCATTTTTCCATTCCATTTC
590 AP-29 F: CACATCCGTGTGTTGGAAAG (CATC)5 256-260 8 2 0.13 256-260 9 2 0.22 256 9 M
-R: GTTGGCGTTAACTGGGAAGA
18 AP-79 F: TTTTTCAAGGTAGAGGGCTCA (TAGA)8 174-190 8 4 0.75 170-174 9 2 0.67 178 9 M
-R: GGAAGATAATATTTTGCATTTTCA
30 AP-87 F: GCCTTCCCATCTGTAGAAGC (TATC)9 170-224 8 9 0.75 174 9 M - 162-166 9 2 0.33
R: TTTTCCAAAGTACGCAAGCA
9 GP-2 F: AGCACCACTCTCTCTTCCTCC (AGTA)5 234-242 7 3 0.57 234-242 9 2 0.11 234 9 M
-R: GCAATTTCTTTTGAAACCCCt
349 GP-30 F: TTCCTCTACCYGCCTCAATTT (CAGA)7 158-174 7 4 0.71 170-182 9 4 0.33 170 9 M
-R: TTACCTTTTCCTGTGCCCTTT
21 CP-5 F: CCAAATAGTCCCCCAAACCTA (CATC)8 226-238 7 2 0.29 218 9 M - 225-234 9 3 0.56
R: GGGATAAAAATGGATGGATGAA
38 CP-17 F: TGAGTCATTTTGCAACTGGTG (TAGA)5 255-267 8 4 0.75 255-263 9 3 0.67 259 9 M
-R: GAATGCACGCTGAAAAGAAAG
203 CP-22 F: AAAGAAGCTGGAGCCAAACT (GATG)5 206-210 7 2 0.29 206-214 9 3 0.66 206 9 M
-R: ACCCCAGTGCTTCCATGTATT
175 CP-27 F: CACACTCCATATTGCCACACA (TATG)5 170 8 M - 158-170 9 2 0.11 170-174 9 2 0.44
R: TTCAGAAAGTGGCTCCAAGA
P1 367 AP-52 F: GCCTCAAACAGGACAGAAGC (AAAC)5 224 8 M - 216-228 9 3 0.67 224 9 M
-R: GGAATGGCTTCTGGTTGAAA
44 AP-57 F: CTGCTAGCCTTAGGCATTGG (CAAA)6 230 8 M - 228 9 M - 222-234 9 4 0.44
R: CTTTTGCCTTCTGCCTTGTC
92 GP-1 F: ATACCTGTGCTCATCTGTGGG (AGCA)5 240-244 8 2 0.38 240 9 M - 240 9 M
-R: AATGAGGTAGCACCCTGGACT
54 GP-24 F: ACGCATGAAGTAGGCAAGAGA (GATA)10 233-237 8 2 0.25 233 9 M - 233 9 M
-R: TACGAAGTGGTGGTGAAGAC
27 CP-4 F: GGAAACCAAAATCATCCATCC (CATC)6 252 8 M - 248-252 9 2 0.11 248 9 M
-R: AGGACCTGCATCTTTTCCAGT
7 CP-21 F: AGATGACAGTCTGGGGAAAGG (ATAG)6 162-190 7 7 0.43 158 9 M - 158 9 M
-R: CTCCCAAGGAAAACCTACCAG
(1.3E-01), CP-25 (1.3E-01), and GP-36 (1.3E-01) inP. pa-pua; and CP-25 (6.9E-02), GP-6 (7.6E-02), and AP-90 (8.4E-02) inP. antarcticus.
All microsatellite loci were amplified under the same PCR condition, which means they can be used in multiplex PCR assays. A multiplex microsatellite genotyping run can genotype a total of six loci for each species using three dif-ferent stains, or eight loci using four stains (e.g.VIC, NED, 6-FAM, PET, HEX, depending on the equipment). We can select loci to be used in all three species according to size range: fragments smaller than 214 bp (AP-78, AP-90, GP-13, GP-18) can be combined with fragments greater than 221 bp (GP-6, GP-15, GP-19, GP-36). The remaining loci can be selected for each species individually. TakingP. pa-puaas an example, it is possible to combine loci greater than 212 bp in length (CP-06, AP-61, AP-26 and GP-4) with some under 204 bp (AP-85, CP-29).
Discussion
Comparative analysis of microsatellites in the three genomes
The SOLiD™ next-generation sequencing (NGS) platform allowed identification of 110,999 microsatellite loci (di-, tri-, tetranucleotide), with an average of 36,999 loci perPygoscelisspecies. Most studies rely on different NGS platforms for screening small parts of the genome for microsatellites. Illumina and 454 platforms have domi-nated the identification of microsatellite markers in non-model organisms (Moodley et al., 2015, Zalapa et al., 2012). Other platforms, such as Ion Torrent PGM and
Illumina MiSeq, or the single-molecule real-time DNA sequencing platform PacBio (Pacific Biosciences), have re-cently been gaining space as a means of rapid, small scale microsatellite development (Weiet al., 2014).
We used the SOLiD platform to sequence three pen-guin genomes and not only search for microsatellite loci, but also characterize them according to polymorphism, dis-tribution in the genome and orthology between species, with the aim of contributing to the increase in the number of comparative studies between Pygoscelis species using markers with high resolution.
We observed that the number of repeats and motifs varied between the three Pygoscelis species. We found large amounts of dinucleotides, followed by tri- and tetra-nucleotides inPygoscelis, as described in other vertebrate genomes (e.g., Huanget al., 2015). However, the relative abundance of different motif classes (e.g.dinucleotide) and motif types (e.g.AT, ACC, AAAT) is not conserved when compared with other vertebrate species. For example,
Cas-toe et al. (2010) identified in the copperhead snake
(Agkistrodon contortrix) a total of 14,612 simple sequence
Viannaet al. 683
Table 3- Mean number of alleles per marker (NA) and observed
hetero-zygosity (Ho) for microsatellite loci isolated from all three species. (AP:P. adeliae,GP:P. papuaand CP:P. antarcticus).
Microsatellite loci
P. adeliae P. papua P. antarcticus
NA HO NA HO NA HO
AP 3.85 0.52 2.43 0.33 3.07 0.9
GP 3.91 0.53 2.91 0.40 2.82 0.25
CP 3.56 0.23 2.33 0.22 2.67 0.17
Table 4- Tetranucleotide microsatellite loci polymorphism for 30 individuals and 12 loci forP. papuaandP. antarcticus, (N: Number of observed alleles per marker;Ho:Observed heterozygosity,He:Expected heterozygosity,FISvalue). * SignificantFISvalues, p < 0.05.
Pygoscelis papua Pygoscelis antarcticus
Locus Size (bp) N A Ho He FIS Size (bp) N A Ho He FIS
AP-3 178-186 30 2 0.37 0.49 0.261* 174-178 30 2 0.067 0.065 -0.018
AP-19 246 30 1 0 0 250-290 28 8 0.82 0.79 -0.034
AP-26 225-241 30 6 0.70 0.77 0.100 231-255 30 6 0.8 0.8 0
AP-61 218-250 28 8 0.643 0.755 0.151*
AP-78 188-212 30 7 0.80 0.69 -0.169 188-208 30 4 0.266 0.38 0.309*
AP-85 188-208 30 5 0.67 0.70 0.051 200-224 30 7 0.700 0.763 0.084
AP-90 194-214 30 6 0.53 0.56 0.045 158-190 30 9 0.900 0.840 -0.072
GP-6 230-234 29 2 0.28 0.29 0.051 234 28 1 0 0
GP-13 190-206 30 5 0.90 0.62 -0.479
GP15 250-286 30 10 0.767 0.806 0.049
GP-36 240-260 30 5 0.13 0.16 0.171* 244-260 30 5 0.333 0.473 0.30*
CP-6 228-236 30 3 0.600 0.524 -0.146
CP-17 255-259 29 2 0.10 0.09 -0.037
CP-22 190-234 30 7 0.73 0.76 0.311
repeats (SSRs), 4,564 of which had flanking sequences suitable for 454 shotgun genome sequencing. These repre-sent various amounts of different motif classes, with num-bers of tetranucleotides, followed by trinucleotides and dinucleotides. The most frequent motifs were also different from those we found in our study (TC, ATT, ATCT; Castoe
et al., 2010). McCulloch and Stevens (2011) used Roche
FLX (Titanium) Genome Sequencing to identify micro-satellites (29,721 di-, tri-, tetranucleotide) for phyllostomid bats, and the authors found a majority of tetranucleotides, followed by dinucleotides and trinucleotides. Recently, 48 bird species genomes, representing all orders of Aves, were completed for phylogenetic reconstruction, which also pro-vide a large amount of data and microsatellites to be evalu-ated for comparative analyses (Jarviset al., 2014).
Primers for tetranucleotides inPygosceliswere de-signed with the same annealing temperature to enable mul-tiplex PCR assays, which is a more affordable and time-efficient technique to genotype multiple loci and individu-als. In this way, it is possible to genotype up to eight loci for each individual in a single run. Moreover, the small size (< 200 bp) of several fragments identified in thePygoscelis genome allows easy amplification of low quality or low concentration DNA, such as that extracted from non-inva-sive (e.g.feather, feces) or ancient (e.g.museum or palaen-tological) samples. To this date, non-invasive DNA sam-ples have not been used to conduct population genetics or ecological studies in penguin species due to the difficulty of obtaining good quality material for nuclear marker amplifi-cation. These samples have mostly been used for studying penguin diets, sex identification (e.g., Jarmanet al., 2002; Deagleet al., 2007; Constantiniet al., 2008), or studying the evolution of species using mtDNA from sub-fossil bones (e.g.Lambertet al., 2002; Ritchieet al., 2004).
In this study, we provide 34 novel polymorphic microsatellite markers, 15 of which are polymorphic in all three species and can easily be genotyped using multiplex PCR. Recently, Moodleyet al.(2015) used NGS to develop markers for the thin-billed prion (Pachyptila belcheri), a sub-Antarctic seabird, and evaluated cross-amplification in six other seabird species, finding that heterozygosity de-creased while proportion of non-amplifying loci inde-creased with phylogenetic distance. In our case, similar hetero-zygosity was observed for allPygoscelisspecies using loci cross-amplification, which suggests that these markers are not subject to the heterozygosity decrease among closely related species. Moreover, this was confirmed by the orthology of most loci selected for all species with same or similar primer sequences.
These polymorphic markers allow individual dis-crimination and their suitability for use in non-invasive or museum samples promotes their application in different types of research, such as species monitoring in the face of climate change, parentage analyses, determination of sam-ple origin and of population genetics structure. Moreover,
the same markers can be employed in comparative phylo-geographical and population genetics studies ofPygoscelis species, given that the 15 loci developed in this study easily cross-amplify, are orthologous and widely distributed in the genome.
Polymorphisms and utility for investigation of penguin populations
We report a large number of microsatellite loci identi-fied in the genomes of threePygoscelisspecies using NGS and classified according to their level of polymorphism, which may also be applied to the study of other penguin species. Previously, only a limited number of microsatellite loci were available for penguins. Twelve loci had been de-veloped for the Humboldt penguin (Schlosseret al., 2003; 2009), five forSpheniscusspecies (Akstet al., 2002), and six for the Adélie penguin (Roeder et al., 2001; 2002). These had been identified using traditional methods and possessed varying degrees of polymorphism in different species. In general, the same markers from these three stud-ies have been used in population genetics investigations of several different penguin species.
Although penguins have been associated with philo-patric behavior, which is often correlated with significant population structure, all studies so far have shown little or no population structure. Absence of population genetic structure was observed in Galapagos penguins using five microsatellite loci (Nimset al., 2008), while Bouzatet al. (2009), using only four loci in samples from six colonies of Magellanic penguins, found limited genetic structure.
Roe-der et al. (2001) analyzed seven microsatellite loci in
Adélie penguin samples collected from 13 localities and did not identify genetic differentiation between colonies around the Antarctic continent, with pairwise Fst below 0.02 and an overallFst equal to 0.0007. Trakiiskaet al. (2005) evaluated three loci inP. papuafrom Livingston Is-land, however, only one of them was polymorphic. Overeemet al.(2008) studied the population genetics of Eudyptula minorusing five loci in samples from seven col-onies and found that most were genetically homogeneous. Likewise, Schlosser et al. (2009) found reduced genetic structure in the Humboldt penguin along its distribution based on 12 microsatellite loci. Sakaokaet al.(2014) used eight microsatellite loci to understand the breeding behav-ior ofP. adeliae, revealing an absence of extra-pair pater-nity (EPP) in a particular captive population. All the afore-mentioned studies used an average of 6 loci for penguin population genetics studies, most of which using the same or similar marker combination. If these markers do not pro-vide enough resolution to reflect species behavior and ecol-ogy, then doubt is cast on the studies’ findings. Recently, Viannaet al.(2017), used a total of 12 loci selected from this study (Table 4) to understand population genetics structure ofP. papua. Significant population structure was identified betweenP. papuacolonies from sub-Antarctic
(Falkland/Malvinas, Crozet and Kerguelen Islands) and those from WAP, but also among nine localities along WAP. These results put in evidence the resolution of our se-lected markers to detect population genetics structure in this species. Other loci developed for penguins were often not evaluated in a population study or showed population structure. Ahmedet al.(2009) developed 25 loci for the Macaroni penguin, eight to 12 loci were found to be poly-morphic, and Kanget al.(2015) isolated 16 polymorphic microsatellite loci for the Chinstrap penguin (P.
antarcticus). However, those markers were not employed
in population genetics investigations. Boessenkoolet al. (2008, 2009) developed 12 other microsatellite loci for the Yellow-eyed penguin (Megadyptes antipodes), and found two distinct genetic groups based on that dataset.
This elicits different questions: are penguins really philopatric, highly migrant, or both? Are species with such large geographical distributions, living under different en-vironmental conditions and subject to various barriers, re-ally that geneticre-ally homogeneous? Or should more highly variable markers be used to obtain the appropriate resolu-tion for the type of quesresolu-tions asked? For several kinds of population genetics data analyses, results are sensitive to the number of loci used and their polymorphic information content, as well as the number of populations sampled and of individuals typed in each population. Evanno et al. (2005), for instance, suggest that a minimum of 10 poly-morphic microsatellites are required to detect population genetic structure using the Bayesian algorithm imple-mented in Structure software.
There is an increasing amount of research using SNPs with genomic methods, such as GBS, RADseq or ddRAD for population studies, including recent studies in penguins (e.g.Clucaset al., 2016; Cristofariet al., 2016). However, microsatellites will remain useful for population studies when discrepant patterns are observed between markers (mtDNA, microsatellite, SNPs). This is the case of three clades identified for the emperor penguin using mtDNA (Youngeret al., 2015) and the lack of population structure using genome-wide SNPs (Cristofariet al., 2016). Apart of population studies, microsatellites are very useful for stud-ies such as individual-based identification or paternity assessment. Therefore, it is important to identify polymor-phic microsatellite loci in non-model species, especially those inhabiting areas highly impacted by climate change, such as the Antarctic. We identified about 11,849 tetra-nucleotide markers and selected 34 which were polymor-phic, cross-amplified in all three Pygoscelisspecies, and did not show signs of heterozygosity reduction due to cross-amplification or due to orthology identified in the majority of those loci selected. We believe that the micro-satellite markers developed in this study will help to gain a comprehensive understanding ofPygoscelispenguin popu-lation genetics and ecology.
Acknowledgement
We acknowledge the financial support of Fondecyt (No 11110060 and 1150517), the Chilean Antarctic Insti-tute (INACH T_12-13, G_06-11, RT_12-14) and CNPq (482501/2013-8).
References
Ahmed S, Hart T, Dawson DA, Horsburgh GJ, Trathan PN and Rogers AD (2009) Isolation and characterization of maca-roni penguin (Eudyptes chrysolophus) microsatellite loci and their utility in other penguin species (Spheniscidae, AVES). Mol Ecol Resour 9:1530-1535.
Akst EP, Boersma PD and Fleischer RC (2002) A comparison of genetic diversity between Galápagos Penguin and the Magellanic Penguin. Conserv Genet 3:375-383.
Aljanabi SM and Martinez I (1997) Universal and rapid salt-extraction of high quality genomic DNA for PCR-based techniques. Nucleic Acids Res 25:4692-4693.
Boessenkool S, King TM, Seddon PJ and Waters JM (2008) Isola-tion and characterizaIsola-tion of microsatellite loci from the yel-low-eyed penguin (Megadyptes antipodes). Mol Ecol Resour 8:1043-1045.
Boessenkool S, Star B, Waters JM and Seddon PJ (2009) Mul-tilocus assignment analyses reveal multiple units and rare migration events in the recently expanded yellow-eyed pen-guin (Megadyptes antipodes). Mol Ecol 18:2390-2400. Bouzat JL, Walker BG and Boersma PD (2009) Regional genetic
structure in the Magellanic penguin (Spheniscus magellanicus) suggests metapopulation dynamics. Auk 126:326-334.
Brody JR and Kern SE (2004) Sodium boric acid: A Tris-free, cooler conductive medium for DNA electrophoresis. Bio-Techniques 36:214-216.
Castoe TA, Poole AW, Gu W, Jason de Koning AP, Daza JM, Smith EN and Pollock DD (2010) Rapid identification of thousands of copperhead snake (Agkistrodon contortrix) microsatellite loci from modest amounts of 454 shotgun ge-nome sequence. Mol Ecol Resour 10:341-347.
Clucas GV, Dunn MJ, Dyke GJ, Emslie SD, Naveen R, Polito MJ, Pybus OG, Rogers AD and Hart T (2014) A reversal of for-tunes: Climate change `winners’ and `losers’ in Antarctic Peninsula penguins. Sci Rep 4:5024.
Clucas GV, Younger JL, Kao D, Rogers AD, Handley J, Miller GD, Jouventin P, Nolan P, Gharbi K, Miller KJ,et al.(2016) Dispersal in the sub-Antarctic: King penguins show remark-ably little population genetic differentiation across their range. BMC Evol Biol 16:211.
Constantini V, Guaricci AC, Laricchiuta P, Rausa F and Laca-landra GM (2008) DNA sexing in Humboldt penguins (Spheniscus humboldti) from feather samples. Anim Reprod Sci 106:162-167.
Cristofari R, Bertorelle G, Ancel A, Benazzo A, Le Maho Y, Ponganis PJ, Stenseth NC, Trathan, PN, Whittington JD, Zanetti E,et al.(2016) Full circumpolar migration ensures evolutionary unity in the Emperor penguin. Nat Commun 7:11842.
Croxall JP, Trathan PN and Murphy EJ (2002) Environmental change and Antarctic seabird populations. Science 297:1510-1514.
Dakin EE and Avise JC (2004) Microsatellite null allele in parent-age analysis. Heredity 93:504-509.
Dawson DA, Horsburgh GJ, Küpper C, Stewart IRK, Ball AD, Durrant KL, Hansson B, Bacon I, Bird S, Klein A, et al. (2010) New methods to identify conserved microsatellite loci and develop primer sets of high cross-species utility - As demonstrated for birds. Mol Ecol Resour 10:475-494. Deagle BE, Gales NJ, Evans K, Jarman SN, Robinson S, Treblico
R and Hindell MA (2007) Studying seabird diet through ge-netic analysis of faeces: A case study on Macaroni penguins (Eudyptes chrysolophus). PLoS One 2:e831.
Dewoody J, Nason JD and Hipkins VD (2006) Mitigating scoring errors in microsatellite data from wild populations. Mol Ecol Notes 6:951-957.
Ellegren H (2008) Sequencing goes 454 and takes large-scale genomics into the wild. Mol Ecol 17:1629-1631.
Evanno G, Regnaut S and Goudet J (2005) Detecting the number of clusters of individuals using the software structure: A simulation study. Mol Ecol 14:2611-2620.
Excoffier L and Lischer HE (2010) Arlequin suite version 3.5: A new series of programs to perform population genetics anal-yses under Linux and Windows. Mol Ecol Resour 10:564-567.
Freer JJ, Mable BK, Clucas G, Rogers AD, Polito MJ, Dunn M, Naveen R, Levy H and Hart T (2015) Limited genetic differ-entiation among Chinstrap penguin (Pygoscelis antarctica) colonies in the Scotia Arc and Western Antarctic Peninsula. Polar Biol 38:1493-1502.
Greig C, Jacobson DP and Banks MA (2003) New tetranucleotide microsatellites for fine-scale discrimination among endan-gered Chinook salmon (Onchorhynchus tshawytscha). Mol Ecol Notes 3:376-379.
Huang J, Li Y-Z and Du L-M (2015) Genome-wide survey and analysis of microsatellites in Giant Panda (Ailuropoda melanoleuca), with a focus on the applications of a novel microsatellite marker system. BMC Genomics 16:61. Jarman SN, Gales NJ, Tierney M, Gill PC and Elliott NG (2002) A
DNA-based method for identification of krill species and its application to analyzing the diet of marine vertebrate preda-tors. Mol Ecol 11:2679-2690.
Jarvis ED, Siavash M, Aberer AJ, Li B, Houde P, Li C, Ho SYW, Faircloth BC, Nabholz B, Howard JT,et al.(2014) Whole genome analyses resolve the early branches in the tree of life of modern birds. Science 346:1320-1331.
Kang S, Jung J-W, Ahn DH, Lee JE, Kim J-H and Park H (2015) Isolation and characterization of polymorphic microsatellite loci from the chinstrap penguin, Pygoscelis antarctica. Conserv Genet Resour 7:561-563.
Kruglyak S, Durrett RT, Schug MD and Aquadro CF (1998) Equi-librium distributions of microsatellite repeat length resulting from a balance between slippage events and point mutations. Proc Natl Acad Sci U S A 95:10774-10778.
Lambert DM, Ritchie PA, Millar CD, Holland B, Drummond AJ and Baroni C (2002) Rates of evolution in ancient DNA from Adelie penguins. Science 295:2270-2273.
Li C, Zhang Y, Li J, Kong L, Kong L, Hu H, Pan H, Xu L, Deng Y, Li Q,et al.(2014) Two Antarctic penguin genomes reveal insights into their evolutionary history and molecular chan-ges related to the Antarctic environment. GigaScience 3:27. Li H, Handsaker B, Wysoker A, Fennell T, Ruan J, Homer N,
Marth G, Abecasis G and Durbin R (2009) The Sequence
Alignment/Map format and SAM tools. Bioinformatics 25:2078-2079.
McCulloch ES and Stevens RD (2011) Rapid development and screening of microsatellite loci for Artibeus lituratusand their utility for six related species within Phyllostomidae. Mol Ecol Resour 11:903-913.
Meredith MP and King JC (2005) Rapid climate change in the ocean west of the Antarctic Peninsula during the second half of the 20th century. Geophys Res Lett 32:1-5.
Montes-Hugo M, Doney SC, Ducklow HW, Fraser W, Martinson D, Stammerjohn SE and Schofield O (2009) Recent changes in phytoplankton communities associated with rapid re-gional climate change along the Western Antarctic Penin-sula. Science 323:1470-1473.
Moodley Y, Masello JF, Cole TL, Calderon L, Munimanda GK, Thali MR, Alderman R, Cuthbert RJ, Marin M, Massaro M, et al.(2015) Evolutionary factors affecting the cross-species utility of newly developed microsatellite markers in sea-birds. Mol Ecol Resour 15:1046-1058.
Neff BD and Gross MR (2001) Microsatellite evolution in verte-brates: Inference from AC dinucleotide repeats. Evolution 55:1717-1733.
Nims BD, Vargas FH, Merkel J and Parker PG (2008) Low ge-netic diversity and lack of population structure in the endan-gered Galápagos penguin (Spheniscus mendiculus). Conserv Genet 9:1413-1420.
Overeem RL, Peucker AJ, Austin CM, Dann P and Burridge CP (2008) Contrasting genetic structuring between colonies of the World’s smallest penguin, Eudyptula minor (Aves: Spheniscidae). Conserv Genet 9:893-905.
Peakall R and Smouse PE (2012) GenAlEx 6.5: Genetic analysis in Excel. Population genetic software for teaching and re-search - An update. Bioinformatics 28:2537-2539. Peña FM, Poulin E, Dantas GPM, González-Acuña D, Petry MV
and Vianna JA (2014) Have historical climate changes af-fected Gentoo penguin (Pygoscelis papua) populations in Antarctica? PLoS One 9:e95375.
Primmer CR, Raudsepp T, Chowdhary BP, Møller AP and Elle-gren H (1997) A low frequency of microsatellite in the avian genome. Genome Res 7:471-482.
Ritchie PA and Lambert DM (2000) A repeat complex in the mito-chondrial control region of Adélie penguins from Antarc-tica. Genome 43:613-618.
Ritchie PA, Millar, CD, Gibb GC, Baroni C and Lambert DM (2004) Ancient DNA enables timing of the Pleistocene ori-gin and Holocene expansion of two Adélie penguin lineages in Antarctica. Mol Biol Evol 21:240-248.
Roeder AD, Marshall RK, Mitchelson AJ, Visagathilagar T, Ritchie PA, Love DR, Pakai TJ, McPartlan HC, Murray ND, Robinson NA,et al.(2001) Gene flow on the ice: Genetic differentiation among Adélie penguin colonies around Antarctica. Mol Ecol 10:1645-1646.
Roeder AD, Ritchie PA and Lambert DM (2002) New DNA markers for penguins. Conserv Genet 3:341-344
Rozen S and Skaletsky H (2000) Primer3 on the WWW for gen-eral users and for biologist programmers. Methods Mol Biol 132:365-386.
Sakaoka K, Suzuki I, Kasugai N and Fukumoto Y (2014) Pater-nity testing using microsatellite DNA markers in captive Adélie penguins (Pygoscelis adeliae). Zoo Biol 33:463-470.
Schlosser JA, Garner TWJ, Dubach JM and Mcelligott AG (2003) Characterization of microsatellite loci in Humboldt penguin (Spheniscus humboldti) and cross-amplification in other penguin species. Mol Ecol Notes 3:62-64.
Schlosser JA, Dubach JM, Garner TWJ, Araya B, Bernal M, Simeone A, Smith KA and Wallace RS (2009) Evidence for gene flow differs from observed dispersal patterns in the Humboldt penguin, Spheniscus humboldti. Conserv Genet 10:839-849.
Schuelke M (2000) An economic method for the fluorescent la-beling of PCR fragments. Nature Biotechnol 18:233-234. Stonehouse B (1975) Introduction: The Spheniscidae. In:
Stone-house B (ed) The Biology of Penguins. Macmillan Press, London, pp 1-15.
Schug MD, Hutter CM, Wetterstrand KA, Gaudette MS, Mackay TFC and Aquadro CF (1998) The mutation rates of di-, tri-and tetranucleotide repeats in Drosophila melanogaster. Mol Biol Evol 15:1751-1760.
Trakiiska E, Bichev S, Telegeev G, Dybkov M, Bezrukov V, Jankov J and Savov A (2005) Study of three DNA micro-satellite markers inPygoscelis papuapenguins (Aves: Sphe-nisciformes) from the Livingston Island. Acta Zool Blug 57:333-340.
Trathan PN, Fretwell PT and Stonehouse B (2011) First recorded loss of an Emperor penguin colony in the recent period of Antarctic regional warming: Implications for other colonies. PloS One 6:e14738.
Vianna JA, Noll D, Dantas GPM, Petry MV, Barbosa A, Gon-zález-Acuña D, Le Bohec C, Bonnadona F and Poulin E (2017) Marked phylogeographic structure of Gentoo pen-guin reveals an ongoing diversification process along the Southern Ocean. Mol Phylogenet Evol 107:486-498. Waits LP, Luikart G and Taberlet P (2001) Estimating the
proba-bility of identity among genotypes in natural populations: Cautions and guidelines. Mol Ecol 10:249-256.
Younger JL, Clucas GV, Kooyman G, Wienecke B, Rogers AD, Trathan PN, Hart T and Miller KJ (2015) Too much of a good thing: Sea ice extent may have forced emperor pen-guins into refugia during the last glacial maximum. Global Change Biol 21:2215-2226.
Zalapa JE, Cuevas H, Zhu H, Steffan S, Senalik D, Zeldin E, McCown B, Harbut R and Simon P (2012) Using
next-gene-ration sequencing approaches to isolate simple sequence re-peat (SSR) loci in the plant sciences. Am J Bot 99:193-208. Zhang G, Li C, Li Q, Li B, Larkin DM, Lee C, Storz JF, Antunes
A, Greenwold MJ, Meredith RW,et al.(2014) Comparative genomics across modern bird species reveal insights into panavian genome evolution and trait biodiversity. Science 346:1311-1320.
Wei N, Bemmels JB and Dick CW (2014) The effects of read length, quality and quantity on microsatellite discovery and primer development:From Illumina to PacBio. Mol Ecol Resour 14:953-965.
Williams TD (1995) The Penguins: Spheniscidae. Oxford Univer-sity Press, Oxford, 295 p.
Internet Resources
AmplifX 1.5.4 by Nicolas Jullien; CNRS, Aix-Marseille Université. http://crn2m.univ-mrs.fr/pub/amplifx-dist. Belkhir K, Borsa P, Chikhi L, Raufaste N and Bonhomme F
(2004) Genetix 4.05, logiciel sous Windows pour la genetique despopulations. Laboratoire Genome, Popula-tions, InteracPopula-tions, CNRSUMR 5000. Université de Montpellier II, Montpellier, France. http://www.genetix.univ-montp2.fr/genetix/genetix.htm. IUCN - International Union for Conservation of Nature (2017)
IUCN Red List of Threatened Species, version 2017. http://www.iucnredlist.org (accessed June 16, 2016). Li, H. (2012). Seqtk Toolkit for processing sequences in
FASTA/Q formats (https://github.com/lh3/seqtk).
Supplementary Material
The following online material is available for this article: Figure S1 – Probability of identity (PI), and the PI between siblings (PIsib) for the 15 microsatellite loci.
Table S1 – All tetranucleotide loci forP. adeliae, P. papua P. antarcticus.
Associate Editor: Houtan Noushmehr
License information: This is an open-access article distributed under the terms of the Creative Commons Attribution License (type CC-BY), which permits unrestricted use, distribution and reproduction in any medium, provided the original article is properly cited.