Hoehnea 44(4): 580-587, 4 tab., 1 fig., 2017 http://dx.doi.org/10.1590/2236-8906-22/2017
Development of microsatellite loci for
Cryptocarya mandioccana
Meisner (Lauraceae) and their genotyping success in different tissues
Thabata Carvalho1, Giuliana Garcia1, Carolina Silva Carvalho2, Clarisse Palma-Silva2 and Laurence Culot1,3 Received: 28.04.2017; accepted: 10.08.2017
ABSTRACT - (Development of microsatellite loci for Cryptocarya mandioccana Meisner (Lauraceae) and their genotyping success in different tissues). Nine polymorphic microsatellite loci were isolated and characterized for Cryptocarya mandioccana Meisner, a tree from the Atlantic Rainforest with seeds dispersed by large animals. The loci were characterized using 48 individuals from two populations and their genotyping success tested in four tissues: leaves from adults and seedlings, and two diaspore maternal tissues. Maternity analyses were also performed on diaspores and leaves from nine adult trees. The number of alleles per locus ranged from nine to 15 and the observed and expected heterozygosities ranged from 0.214 to 0.864 and 0.745 to 0.892, respectively. The loci genotyping success did not significantly differ between tissues and varied from 56 to 96%. The microsatellites showed enough polymorphism to assign the nine adult trees to their diaspores. The successful genotyping in all tissues and identification of mother trees show that the microsatellites are suitable for studies such as spatial genetic structure and maternity analyses.
Keywords: Atlantic forest, Lauraceae, maternity analysis, microsatellite, seed maternal tissue
RESUMO - (Desenvolvimento de locos de microssatélites para Cryptocarya mandioccana Meisner (Lauraceae) e o sucesso de genotipagem em diferentes tecidos). Nove locos de microssatélites polimórficos foram isolados e caracterizados para Cryptocarya mandioccana Meisner, uma árvore da Mata Atlântica cujas sementes são dispersas por grandes animais. Os locos foram caracterizados usando 48 indivíduos de duas populações e o sucesso de genotipagem testado em quatro tecidos: folhas de adultos e plântulas, e dois tecidos maternos de diásporos. Análises de maternidade foram também realizadas em diásporos e folhas de nove árvores adultas. O número de alelos por loco variou de nove a 15 e as heterozigosidades observada e esperada de 0,214 a 0,864 e 0,745 a 0,892, respectivamente. O sucesso de genotipagem dos locos não diferiu entre os tecidos e variou de 56 a 96%. Os microssatélites mostraram polimorfismo suficiente para atribuir as nove árvores aos seus diásporos. O sucesso de genotipagem em todos os tecidos e a identificação das árvores mães mostraram que os microssatélites são adequados para estudos como estrutura genética espacial e análise de maternidade.
Palavras-chave: análise de maternidade, Lauraceae, Mata Atlântica, microssatélite, tecido materno das sementes
1. Universidade Estadual Paulista “Júlio de Mesquita Filho”, Instituto de Biociências, Departamento de Zoologia, Avenida 24 a, 1.515, 13506-900 Rio Claro, São Paulo, Brasil
2. Universidade Estadual Paulista “Júlio de Mesquita Filho”, Instituto de Biociências, Departamento de Ecologia, Avenida 24 a, 1.515, 13506-900 Rio Claro, São Paulo, Brasil
3. Corresponding author: [email protected]
Introduction
Studies on the effects of defaunation on seed dispersal and consequently on gene flow are still scarce in tropical forests, specifically in Atlantic Forest (Carvalho et al. 2016). Yet this knowledge is of paramount importance to understand the spatial distribution of genetic variation and how this affects the evolutionary potential of the species (Garcia & Grivet 2011). Direct and indirect methods exist to
study seed and gene dispersal such as the determination of seed dispersal distances through parentage analysis (parent tree - seed) or the spatial genetic structure and maternal correlation analysis, respectively (Garcia & Grivet 2011). In this context, microsatellites markers are widely used for studies using both approaches (Hardesty et al. 2005; Zucchi et al. 2003).
It is mainly found in mountain and submountain ombrophilous dense forests, between 10 and 1180 m asl. C. mandioccana is likely to be affected by anthropogenic activities such as forest fragmentation and defaunation, mainly due to its dependence to large mammals and birds to disperse its seeds (1.34-3.00 cm length and 1.16-1.92 cm width) (De Moraes 2007). Indeed, C. mandioccana is mainly dispersed by two large-sized primate species, the Southern muriqui (Primates, Atelidae: Brachyteles arachnoides) and the brown howler monkey (Primates, Atelidae: Alouatta guariba clamitans), by the Lowland tapir (Perissodactyla, Tapiridae: Tapirus terrestris) (Bueno et al. 2013; De Moraes 2007), and the Black-fronted piping guan (Galliformes, cracidae: Aburria jacutinga), a large-sized bird (L. Culot, obs. pers). The Southern muriqui (Mendes et al. 2008) and the Black-fronted piping guan (BirdLife International 2016) are classified as endangered by the IUCN Red List while the Lowland tapir is classified as “endangered in the Atlantic Forest” (Medici et al. 2012).
In the present study, we aimed to: 1) isolate and characterize microsatellite loci designed to C. mandioccana, 2) test these markers on four distinct tissues (leaves from adult trees, leaves from seedlings, pericarp and testa from the diaspores), and 3) use the markers to check the maternal origin of both diaspore tissues. The morphology of C. mandioccana seeds differ from the morphology of classic fruits since the pulp comes from the augmented floral axis while the diaspore is formed by the seed and the pericarp (De Moraes & Paoli 1996). To check the maternal origin of the tissues, we used the pericarp and the testa, a brownish tissue localized just under the pericarp. The analysis of the success of DNA extraction and amplification protocols in different tissues enabled us to determine the potential of C. mandioccana microsatellite markers for future applications such as the determination of the spatial genetic structure of seedlings or the mother-tree of dispersed seeds.
Material and methods
Sampling and DNA extraction - For the isolation and characterization of microsatellite loci, we collected leaves from 48 C. mandioccana adult trees from two populations of the Sao Paulo State (SP), Brazil. One population is located in São Miguel Arcanjo, in Carlos Botelho State Park (CBSP), and the other one in Cananéia, in Cardoso Island State Park (CISP). For the optimization of the protocol in other tissues, we
used the pericarp of 27 C. mandioccana fruits directly collected in nine trees (3 fruits/tree) and the leaves of 27 seedlings randomly selected among the seedlings within a 12-ha plot in CBSP. To confirm the maternal origin of diaspore tissues, we collected leaves from the nine adult trees from which fruits were collected. We stored all samples in silica gel while in the field and then in freezer (-15 °C).
We extracted the genomic DNA using the CTAB/ chloroform:IAA protocol for DNA extraction in plant tissues described by Doyle & Doyle (1987), following distinct optimizations according to the tested tissue. We cut around 150 mg of all tissues in 0.5-cm²-fragments and macerated them with 2-mm-beads of zirconium in a Mini-BeadBeater macerator (Biospec Products - USA). The time of maceration varied according to the tissues: 1min 30s for diaspore tissues and 45s for leaves. Higher concentrations of DNA were obtained by adding the extraction buffer after the maceration process. Therefore, we performed dry maceration of the plant tissues.
Construction of a microsatellite-enriched library and primer design
The DNA extracted from leaves of ten C. mandioccana adult trees from CISP was used by Genetic Marker Services company (Brighton, United Kingdom) to build a microsatellite-enriched library and design primers. Genomic DNA was digested with the Rsa I restriction enzyme. The library was enriched using size-restricted DNA with filter-bonded synthetic repeat motifs, (AG)17, (AC)17, (AAC)10, (CCG)10, (CTG)10, and (AAT)10. A total of 37 positive clones were sequenced from which 17 primer pairs could be designed through the Primer 3 version 3.0 (Rozen & Skaletsky 1999). All primer pairs were synthetized with a M13 tail (5’ -TGTAAAACGACGGCCAGT- 3’) at the end to allow labeling with a tailed fluorescent dye M13 primer and multiplex genotyping procedures (Schuelke 2000).
Amplification conditions and validation of primers - All amplifications were performed by polymerase chain reactions (PCR) in a 96 Well Thermal Cycler (Applied Biosystems) thermocycler. The final volume of the reaction was 11 µl and contained: 1-10 ng of DNA, 1 μl of Nuclease-Free H2O, 5 µl of GoTaq® Colorless Master Mix 2X (Promega), 8 pmol of primer without M13-tail, 2 pmol of primer with M13-tail, 8 pmol of universal M13 primer tagged with
fluorochromes (FAM or NED), and 0.42 ng ml-1 of
582 Hoehnea 44(4): 580-587, 2017
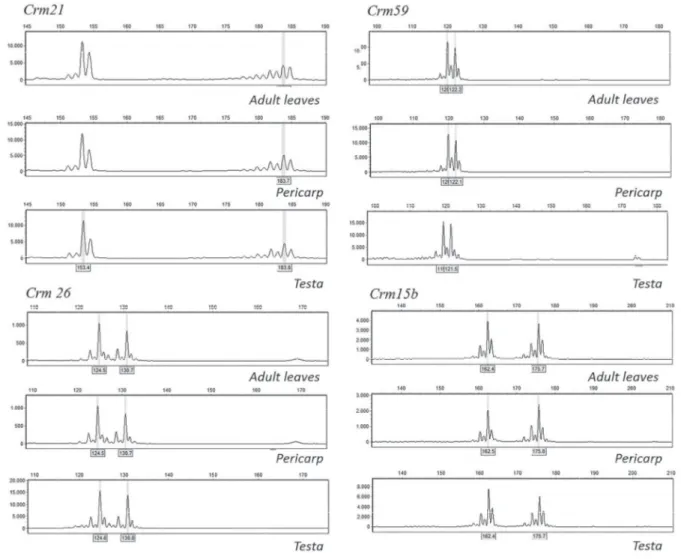
Figure 1. Genotyping results for four loci of the DNA extracted from the adult leaves and the diaspore tissues (pericarp and testa) collected directly on one individual adult tree of C. mandioccana (SM 36).
95°C for 3min, followed by 10 cycles of 94 °C for 30s, 58 - 48 °C decreasing 1 °C per cycle during 30s, 72 °C for 30s followed by 30 cycles of 94 °C for 30s, 48 °C for 30s, 72 °C during 30s, followed by a fi nal extension of 10 min at 72 °C according to the method described by Palma-Silva et al. (2007). The amplicons were visualized by electrophoresis in agarose gel 1.5% with GelRed (Biotium, Hayward, California, USA). We performed the genotyping of the samples in a DNA automated sequencer (Applied Biosystems 3500 Series Genetic Analyzer) using the GeneScan 500 Liz as dye-labeled size standard. We identifi ed the alleles with the GeneMarker v.4.1 software (Applied Biosystems).
Data Analyses - All genotypes were submitted to the Micro-Checker software (Van Oosterhout et al. 2004) where genotyping errors due to stuttering, dropout and null alleles were identifi ed. The levels of genetic diversity within each population were described
through allelic richness (AR) (El Mousadik & Petit 1996), number of alleles (A) per locus and population, allelic size variances, and observed (Ho) and expected (He) heterozygosities. These values were estimated with MSA software (Dieringer & Schlötterer 2003), GenAlEx 6.5 (Peakall & Smouse 2006, 2012), and Fstat 1.2 (Goudet 1995). The GENEPOP 3.5 software (Raymond & Rousset 1995) was used to test the principle of Hardy-Weinberg Equilibrium (HWE), the coeffi cient of inbreeding Fis (Weir & Cockerham 1984) within the populations, and the linkage disequilibrium between pairs of loci. To confi rm the maternal origin of diaspore tissues, we compared the genotypes of the pericarps, testa, and leaves from adult trees.
Results and Discussion
Carvalho
et al
.: Microsatellite loci for
Cryptocarya mandioccana
583
Locus Sequence (5’ – 3’) Repeat motif Size range (bp) A Ho He GenBank
Crm2 F: CCTTCTGCTGACCACTTAAAACA (CA)14 108-129 10 0.795 0.827 MF979811 R: TCATACAGCCACCAAATCCA
Cm3 F: GGTAACTAACTCG (TC)25 153-190 15 0.356 0.870*** MF979812 R: CACAAGCAAATTCAATCTG
Crm13 F: TGTGTGTGTGAGATAGTGGTTTTC (AG)18 154-175 10 0.214 0.858*** MF979813 R: TGACAATCAAAATGGGAAATTG
Crm15b F: AGGGGTGTGCGTGAATAGAA (GT)13
(GA)12 151-178 14 0.681 0.840 MF979814 R: TGCACTATATGGAAAAGCATGTG
Crm21 F: CAGAACCCGTCCCAATTTTT (GA)20 154-188 13 0.864 0.892 MF979815 R: CTCCCCGGCTCTAATACCAT
Crm23 F: TCTCTCTCATGTATCAATTTAAGC (TC)15 111-146 9 0.310 0.824*** MF979816 R: TACCATGCCTTAGCTGTGAA
Crm26 F: CGTAGGCCGAAACGACAAGT (TG)18 118-134 10 0.756 0.848* MF979817 R: TTCCACATGGACATGGCTTG
Crm27b F: CCATTTTTTCAATCCAACGG (AC)12 171-200 10 0.405 0.746*** MF979818 R: ATGCATCTTAGGGGAGTGCT
Crm59 F: CATGAACAATAAAATAGTGATAAA (AC)11 114-134 9 0.667 0.697** MF979819 R: TCGTAGGCAACTCATCTCAG
584 Hoehnea 44(4): 580-587, 2017
Table 2. Genetic characterization of C. mandioccana populations. Number of sample individuals (N), number of alleles (A), allelic richness (Ar), observed heterozygosity (Ho), expected heterozygosity (He), and inbreeding coefficient (Fis). Significant departure from HWE (P < 0.0001).
Pop Latitude S Longitude W N A Ar Ho He Fis
CISP 25°08'01.4" 47°57'42.2" 24 8.444 6.886 0.524 0.785 0.357*
CBSP 24º03'37" 47º59'44" 24 8.778 7.281 0.580 0.807 0.221*
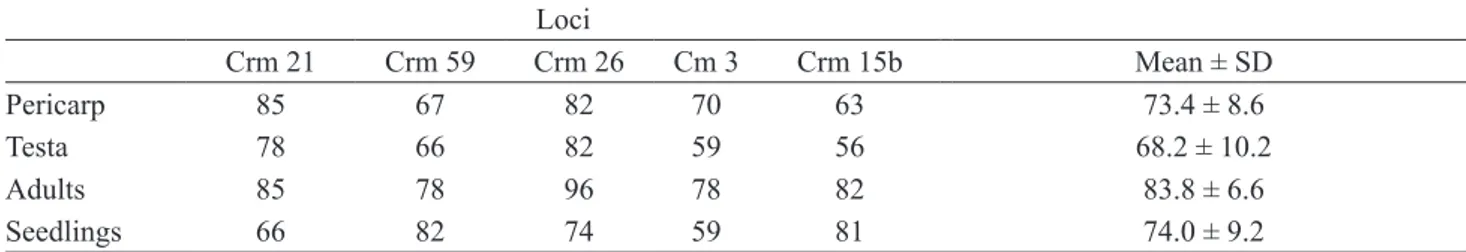
Table 3. Genotyping success (%) for distinct tissues and loci of C. mandioccana.
Loci
Crm 21 Crm 59 Crm 26 Cm 3 Crm 15b Mean ± SD
Pericarp 85 67 82 70 63 73.4 ± 8.6
Testa 78 66 82 59 56 68.2 ± 10.2
Adults 85 78 96 78 82 83.8 ± 6.6
Seedlings 66 82 74 59 81 74.0 ± 9.2
Ind Tissue Crm 21 Crm 59 Crm26 Cm3 Crm15b
SM53
Adult leaves 170 172 120 124 122 132 165 165 NA NA
Pericarp 1 170 172 120 124 NA NA 165 165 162 162
Testa 1 170 172 120 124 NA NA 165 176 162 162
Pericarp 2 170 172 120 124 122 132 165 165 162 172
Testa 2 170 172 120 124 122 132 165 165 162 172
Pericarp 3 NA NA NA NA 122 132 NA NA 162 172
Testa 3 NA NA NA NA NA NA NA NA 162 172
SM33
Adult leaves 172 172 118 120 126 126 186 188 162 176
Pericarp 4 NA NA 118 120 126 126 186 188 162 176
Testa 4 172 172 118 120 126 126 186 188 162 176
Pericarp 5 172 180 NA NA 126 122 186 188 162 176
Testa 5 172 172 NA NA 126 126 NA NA 162 176
Pericarp 6 172 172 NA NA 126 122 186 188 162 176
Testa 6 172 172 NA NA 126 126 NA NA 162 176
SM6
Adult leaves NA NA NA NA 124 130 164 166 162 176
Pericarp 7 174 176 120 122 124 130 164 166 NA NA
Testa 7 174 176 120 122 124 130 164 166 NA NA
Pericarp 8 174 176 120 122 NA NA 164 166 162 176
Testa 8 174 176 120 122 NA NA 164 166 162 176
Pericarp 9 174 176 120 122 NA NA 164 166 NA NA
Testa 9 174 176 120 122 NA NA 164 166 NA NA
SM10
Adult leaves 174 180 120 122 128 130 NA NA NA NA
Pericarp 10 174 180 120 122 128 130 NA NA NA NA
Testa 10 NA NA 120 122 128 130 NA NA NA NA
Pericarp 11 174 180 NA NA 124 128 164 166 NA NA
Testa 11 NA NA NA NA 124 128 164 166 NA NA
Ind Tissue Crm 21 Crm 59 Crm26 Cm3 Crm15b
SM10 Pericarp 12 174 180 NA NA 124 128 NA NA NA NA
Testa 12 174 180 NA NA 124 128 NA NA NA NA
SM12
Adult leaves NA NA NA NA 124 130 174 174 NA NA
Pericarp 13 172 176 120 122 124 130 174 174 178 178
Testa 13 NA NA NA NA 124 130 NA NA NA NA
Pericarp 14 172 176 NA NA 124 130 NA NA 178 178
Testa 14 172 176 NA NA 124 130 NA NA NA NA
Pericarp 15 176 176 120 120 NA NA NA NA NA NA
Testa 15 172 176 120 120 124 130 NA NA NA NA
SM82
Adult leaves NA NA NA NA NA NA 176 188 NA NA
Pericarp 16 NA NA 122 122 122 128 176 188 NA NA
Testa 16 NA NA NA NA 122 128 176 188 NA NA
Pericarp 17 168 172 122 122 122 128 176 188 NA NA
Testa 17 168 172 122 122 122 128 176 188 NA NA
Pericarp 18 NA NA NA NA 122 128 NA NA NA NA
Testa 18 NA NA 122 122 122 128 176 188 NA NA
SM79
Adult leaves NA NA NA NA 124 128 NA NA NA NA
Pericarp 19 170 176 118 120 124 128 NA NA NA NA
Testa 19 170 176 118 120 124 128 NA NA NA NA
Pericarp 20 170 176 118 120 124 128 NA NA 154 162
Testa 20 170 176 118 120 124 128 NA NA 154 162
Pericarp 21 170 176 118 120 124 128 170 188 154 162
Testa 21 170 176 118 120 124 128 188 188 154 162
SM36
Adult leaves 154 184 120 122 122 128 170 188 158 182
Pericarp 22 154 184 120 122 122 128 170 188 158 182
Testa 22 154 184 120 122 122 128 170 188 158 182
Pericarp 23 154 184 120 122 122 128 170 188 158 182
Testa 23 154 184 120 122 122 128 NA 188 158 182
Pericarp 24 154 184 120 122 122 128 170 188 158 182
Testa 24 154 184 120 122 122 128 170 188 158 182
SM42
Adult leaves 170 184 120 120 124 130 186 188 154 176
Pericarp 25 170 184 120 120 NA NA 186 188 154 176
Testa 25 170 184 120 120 NA NA 186 188 154 176
Pericarp 26 170 184 NA NA 124 130 186 188 154 176
Testa 26 170 184 120 122 124 130 186 188 154 176
Pericarp 27 170 184 NA NA 124 130 186 188 154 176
Testa 27 170 184 NA NA 124 130 186 188 154 176
Table 4 (continuation)
designed for C. mandioccana, nine loci amplified successfully and were polymorphic for both studied populations (table 1). We detected 78 alleles in this set of polymorphic markers, varying from nine to 15 per locus. Observed and expected heterozygosities varied from 0.214 to 0.864 and from 0.697 to 0.892,
586 Hoehnea 44(4): 580-587, 2017
The indices of genetic diversity suggest high diversity in both populations (table 2). We detected 73 alleles in the CISP population, varying from five to 12 alleles per locus, and observed and expected heterozygosities of 0.524 and 0.785, respectively, with a significant inbreeding coefficient (Fis = 0.357). In the CBSP population, we detected 77 alleles, varying from five to 11 per locus and observed and expected heterozygosities of 0.580 and 0.807, respectively, with a significant inbreeding coefficient (Fis = 0.221). Genotyping success in distinct tissues - Although the diaspore tissues and seedlings presented lower genotyping success than leaves from adult trees, the difference was not significant (N = 20, Kruskal-Wallis χ² = 5.15, df = 3, P = 0.16) (table 3).
Validation of the maternal origin of diaspore tissues - We used five of the nine validated microsatellites (Crm21, Crm59, Crm26, Cm3, and Crm15b) to compare the genotypes of potential mother trees with those of pericarp and testa tissues. The five microsatellite loci were sufficiently polymorphic to enable the genetic assignment of diaspores to the nine mother trees (table 4, figure 1). Moreover, both tested diaspore tissues presented the same genotypes as the mother trees, indicating that both tissues are of maternal origin (table 4, figure 1). These results show that both tissues can be used in maternity analysis (without the need to separate them for DNA extraction) and therefore in studies aiming to determine seed dispersal distances.
The nine microsatellite loci we isolated and characterized are highly polymorphic and will be useful for future studies about spatial genetic diversity or seed and gene dispersal. In addition, these markers will enable the determination of the genetic diversity of C. mandioccana populations as well as the effects of human disturbances on the genetics of this plant species.
Acknowledgements
We would like to thank our field assistants (Danilo Eugenio Ferreira, Sergio Carlos Neves, and Eduardo Pereira) for their valuable help in the field, to Genetic Marker Services for primer designs, and to Sérgio Kakazu for his collaboration during the genotyping process. We are deeply grateful to Dra. Alexandra Sanches who initiated the tests of microsatellite markers and to Prof. Dr. Mauro Galetti for his involvement in the first phases of the project. T.C, G.G., C.C. and L.C.
received a fellowship from the Fundação de Amparo à Pesquisa do Estado de São Paulo - FAPESP (2014/20621-2, 2014/20622-9, 2014/01029-5, and 2010/16075-1, respectively) and C.P. received a funding from FAPESP (2009/52725-3). The project was financed by a bilateral funding between Brazil and Belgium - CAPES/WBI program (n°009/10) and by CNPq (Conselho Nacional de Desenvolvimento Científico e Tecnológico - Universal n° 456549/2014-5). A FAPESP funding to L.C (Jovem Pesquisador program, n° 2014/14739-0) provided final support for this publication.
Literature cited
Bueno, R.S., Guevara, R., Ribeiro, M.C., Culot, L., Bufalo, F.S. & Galetti, M. 2013. Functional redundancy and complementarities of seed dispersal by the last Neotropical megafrugivores. PLoS ONE 8: e56252.
BirdLife International. 2016. Pipile jacutinga.
The IUCN Red List of Threatened Species 2016: e.T22678429A92773310. Available in http:// d x . d o i . o rg / 1 0 . 2 3 0 5 / I U C N . U K . 2 0 1 6 - 3 . R LT S . T22678429A92773310.en. (access in 09-II-2017).
Carvalho, C.S., Galetti, M., Colevatti, R.G. & Jordano, P. 2016. Defaunation leads to microevolutionary changes in a tropical palm. Scientific Reports 6: 31957.
Moraes, P.L.R. 2007. Taxonomy of Cryptocarya species
of Brazil. Abc Taxa 3: 191.
Moraes, P.L.R. & Paoli, A.A.S. 1996. Morfologia de
frutos e sementes de Cryptocarya moschata Nees & Martius ex Nees, Endlicheria paniculata (Sprengel) MacBride e Ocotea catharinensis Mez (Lauraceae). Revista Brasileira de Sementes 18: 17-27.
Dieringer, D. & Schlötterer, C. 2003. Microsatellite analyser (MSA): a platform independent analysis tool for large microsatellite data sets. Molecular Ecology Notes 3: 167-169.
Doyle, J. & Doyle, J.A. 1987. A rapid DNA isolation
procedure for small amounts of fresh leaf tissue. Phytochemical Bulletin 19: 11-15.
El Mousadik, A. & Petit, R. 1996. High level of genetic differentiation for allelic richness among populations of the argan tree [Argania spinosa (L.) Skeels] endemic to Morocco. Theoretical Applied Genetics 92: 832-839.
Garcia, C. & Grivet, D. 2011. Molecular insights into seed dispersal mutualisms driving plant population recruitment. Acta Oecologica 37: 632-640.
Goudet, J. 1995. FSTAT (version 1.2): a computer program to calculate F-statistics. Journal of Heredity 86: 485-486.
Hardesty, B.D., Dick, C.W., Kremer, A., Hubbel, S. &
Bermingham, E. 2005. Spatial genetic structure of
Medici, E.P., Flesher, K., Beisiegel, B.L., Keuroghlian, A., Desbiez, A.L.J., Gatti, A., Pontes, A.R.M., Campos, C.B., Tófoli, C.F., Moraes Júnior, E.A., Azevedo, F.C., Pinho, G.M., Cordeiro, J.L.P., Santos Júnior, T.S., Morais, A.A., Mangini, P.R., Rodrigues, L.F. & Almeida, L.B. 2012. Avaliação do risco de extinção da anta brasileira Tapirus terrestris Linnaeus, 1758, no Brasil. Biodiversidade Brasileira 1: 103-116.
Mendes, S.L., de Oliveira, M.M., Mittermeier, R.A. & Rylands A.B. 2008. Brachyteles arachnoides. The IUCN Red List of Threatened Species 2008: e.T2993A9529160. Available in http://dx.doiAvailable at .org/10.2305/IUCN.UK.2008.RLTS.T2993A9529160. en (access in 09-II-2017).
Palma-Silva, C.A., Cavallari, M.M., Barabará, T., Lexer, C., Gimenes, M.A., Bered, F., Bodanese-Zanettini, M.H. 2007. A set of polymorphic microsatellite loci for Vriesea gigantea and Alcantarea imperialis (Bromeliaceae) and cross-amplification in other bromeliad species. Molecular Ecology Notes 7: 654-657.
Peakall, R., Smouse, P.E. 2012. GenAlEx 6.5: análise genética em Excel. Software de genética populacional para ensino e pesquisa - uma atualização. Bioinformatics 28: 2537-2539.
Raymond, M., Rousset, F. 1995. GENEPOP (version
1.2): population genetics software for exact tests and ecumenicism. Journal of Heredity 86: 248-249.
Rozen, S. & Skaletsky, H. 1999. Primer3 on the WWW
for general users and for biologist programmers. Bioinformatics Methods and Protocols 132: 365-386.
Schuelke, M. 2000. An economic method for the fluorescent
labeling of PCR fragments. Nature Biotechnology 18: 233-234.
Van Oosterhout, C., Hutchinson, W.F., Wills, D.P.M.,
Shipley, P. 2004. MICRO-CHECKER: software
for identifying and correcting genotyping errors in microsatellite data. Molecular Ecology Notes 4: 535-538.
Weir, B.S. & Cockermam, C.C. 1984. Estimating
F-statistics for the analysis of population structure. Evolution 38: 1358-1370.