investi gated. In this regard, a number of 712 fi rms with data belonging to 2008-2013 have been subjected to our analyses. In this research rati o of long-term debts to sum of long-term debts and market value of equity has been considered as the index of capital structure. In additi on the t-test and the Mann-Whitney test have been incorporated for expression of the diff erence between averages of rati os of long-term debts of domesti c and multi nati onal companies. In order to determine the determinant factors of capital structure a set of variables including Profi tability, growth opportuniti es, value of collateral assets, fi rm size, rati o of interest payments, non-tax debts, tax rates, foreign sales, business risk and cost of bankruptcy have been used as control variables of the study. Through applicati on of the multi variate linear regression model, we have tried to provide a suitable model for both groups. Results have shown that the rati o of long-term debts in multi nati onal fi rms is signifi cantly lower than domesti c fi rms. In additi on, results of the OLS regression have shown that there exists a fundamental diff erence between capital structure determinants among domesti c and multi nati onal companies. For both groups profi tability, growth opportuniti es, value of collateral assets and fi rm size were considered as meaningful determinant factors of capital structure. For domesti c companies, the dividend payout was also found to be a signifi cant determinant of capital structure. Furthermore, for a multi nati onal company, non-tax debts, tax rates and exports (foreign sales) were found to be meaningful determinants of capital structure. Nevertheless, business risk and bankruptcy costs were not found to be meaningful determinants of capital structure for neither of MCs or DCs.
Keywords: capital structure, Leverage, dividend payout,
multi nati onal companies, domesti c companies
Abstracto: Este estudio investi ga los efectos de la
multi nacionalidad de las empresas en la estructura de capital. Además, se han investi gado los factores determinantes de la estructura de capital de las empresas multi nacionales y las empresas nacionales que coti zan en la bolsa de valores de Teherán. En este senti do, un número de 712 empresas con datos pertenecientes a 2008-2013 han sido someti das a nuestros análisis. En esta investi gación, la relación de las deudas a largo plazo con la suma de las deudas a largo plazo y el valor de mercado del capital se ha considerado como el índice de la estructura de capital. Además, la prueba t y la prueba de Mann-Whitney se han incorporado para expresar la diferencia entre los promedios de las relaciones de las deudas a largo plazo de las empresas nacionales y multi nacionales. Para determinar los factores determinantes de la estructura de capital, un conjunto de variables que incluyen rentabilidad, oportunidades de crecimiento, valor de los acti vos colaterales, tamaño de la empresa, proporción de pagos de intereses, deudas no tributarias, tasas impositi vas, ventas en el extranjero, riesgo comercial y costo de quiebra se han uti lizado como variables de control del estudio. Mediante la aplicación del modelo de regresión lineal multi variable, hemos tratado de proporcionar un modelo adecuado para ambos grupos. Los resultados han demostrado que la proporción de deudas a largo plazo en empresas multi nacionales es signifi cati vamente menor que la de las empresas nacionales. Además, los resultados de la regresión MCO han demostrado que existe una diferencia fundamental entre los determinantes de la estructura de capital entre las empresas nacionales y multi nacionales. Para ambos grupos, la rentabilidad, las oportunidades de crecimiento, el valor de los acti vos colaterales y el tamaño de la empresa se consideraron factores determinantes signifi cati vos de la estructura del capital. Para las empresas nacionales, también se descubrió que el pago de dividendos era un determinante signifi cati vo de la estructura de capital. Además, para una empresa multi nacional, las deudas no tributarias, las tasas impositi vas y las exportaciones (ventas en el extranjero) resultaron determinantes signifi cati vos de la estructura del capital. Sin embargo, no se descubrió que los riesgos comerciales y los costos de bancarrota fueran determinantes signifi cati vos de la estructura de capital para ninguno de los MC o DC.
Palabras clave: estructura de capital, apalancamiento, pago de
dividendos, empresas multi nacionales, empresas nacionales
PHD candidate in fi nance, Department of fi nance, Faculty of Management & Social Science, North Tehran Branch, Islamic Azad University, Tehran, Iran. E-mail: [email protected]
Associate Professor in Accounti ng, Faculty of Management and Accounti ng, Qazvin Islamic Azad University, Qazvin, Iran. E-mail: farzin.
[email protected] Farhad Fatemian Farzin Rezaei
DETERMINANTES DE LA
ESTRUCTURA DE CAPITAL DENTRO
DE LAS COMPAÑÍAS NACIONALES Y
MULTINACIONALES, EVIDENCIA DE
IRÁN
CAPITAL STRUCTURE
DETERMINANTS INSIDE
MULTINATIONAL AND DOMESTIC
COMPANIES, EVIDENCE FROM IRAN
1
2
1
Introducti on
Following publicati on of well-known results of Miller and Modigliani [1], modern theories of capital structure was began. The results revealed that in effi cient markets free from tax and bankruptcy costs, the rati o between a company’s value and capital structure remains constant, then they extended and modifi ed their theory and expressed that an opti mized capital structure exists in real world and these structures maximize the value of fi rms. Obtaining and comprehending the determining factors of an opti mal capital structure has crucial importance, because, identi fi cati on of them is a way of maximizing the value of fi rms [2].
One of the interesti ng subjects for fi nancial researchers is investi gati on of presence of fi rms in internati onal scenes and multi -nati onality of these companies and its eff ects on their executi ve processes and of course on their capital structure. However, only a few researches of this kind have been carried out in Iran and also fewer researches have been dedicated to comparison of determining factors of capital structure among domesti c and multi nati onal companies. In additi on, increasing importance of global markets along global competi ti ons has jointly increased the importance of determining factors of capital structure of such companies.
In additi on, reviewing the theoreti cal foundati ons of capital structures leaves us with an unsolved mystery. On the other hand, fi nancial theories forecast that MCs should have higher fi nancial leverage compared to DCs. This higher leverage has several advantages such as lower risks, larger size, less cash fl ow fl uctuati ons and increased access to internati onal capital markets. On the other hand, in contrast to these forecasts, most performed studies and researches have shown that American MCs are equipped with a lower fi nancial leverage compared to American DCs [3]. Diff erent researchers have proposed several diff erent reasons and explanati ons for solvati on of this mystery, however sti ll there are no general and unifi ed views regarding the eff ects of becoming multi nati onal on capital structure of companies.
Capital structure in MCs and related literature
Most models related to determining factors of capital structure of MCs, reveal that MCs should keep a higher debts as a result of more variability, easier access to internati onal capital markets and obtaining a larger size[4]. In support, results of research carried out by Dukas & Pantzalis [5], Usha R. Mitt oo and Zhu Zhang [6]; shows that MCs keep a higher level of debts compared to DCs. In contrast to this, other researchers have concluded that representati on costs of MCs are higher than DCs [7]. According to Jensen and Mackling [8] extraordinary monitoring costs exist for MCs as a result of having acti viti es in diff erent politi cal systems, complicated cultural issues and newer organizati onal environments [9], therefore, their debt levels are expected to decline. In additi on, geographic diversity of MCs increases their audit costs and this issue is expected to decline debts level as well. Therefore, most previous experimental researches, especially those performed in American countries have shown that MC’s keep a relati vely lower level of debts in their capital structure compared to DCs [10, 11].
Usha R. Mitt oo & Zhou Zhang[6] compared the eff ect of multi -nati onality on capital structure of American and Canadian fi rms. In this research they made use of independent variables including agency costs, access to internati onal debt markets and commercial risks in order to evaluate the eff ect of multi -nati onality on the dependent variable of leverage. Their fi ndings indicated that in contrast to American fi rms, multi nati onal Canadian companies had a higher leverage compared to domesti c companies. This higher leverage is due to less agency costs for acti vity in American markets.
A very remarkable research in this area was performed by Chuck C.Y Kwok and David. M. Reeb[12]. The authors have claimed that the dominant factor for descripti on of main eff ects of multi -nati onality on companies’ leverage is diff erent risks of diff erent countries. Results of this research have verifi ed that in American companies becoming multi nati onal is accompanied by reducti on of leverage. On the other hand, for companies that are acti ve in emerging markets becoming multi nati onal was directly related to a positi ve increase in leverage.
Mihir A Desai et al [13] investi gate the eff ect of multi nati onality on capital structure of American companies with emphasis on the independent variable of politi cal risk. The authors have shown that in countries with higher politi cal risks, volati lity of investment returns is extremely higher
than other countries. They argue that multi nati onal companies keep their leverage in a lower level in order to hedge this politi cal risk and make less frequent uses of long-term debts.
Another specifi cally signifi cant research was performed by Raj Aggarwal and Aung Kyaw[11]. This research investi gates the eff ects of multi -nati onality on dependent variables of leverage and dividend policy simultaneously. In order to show the correlati on between capital structure and dividend policies, this research has made use of a simultaneous equati ons framework. This research has elaborated on diff erences between capital structures of domesti c companies and multi nati onal companies and for the fi rst ti me ever, they argue dividend policy as factor for describing multi -nati onality eff ect on capital structure is. In contrast to most previous theories, results of this study indicated that multi nati onal companies have a signifi cantly lower leverage than domesti c companies and that with becoming multi nati onal; the degrees of leverage and debt are reduced signifi cantly. In additi on, considering the fi ndings of this study it seems that compared with domesti c companies, multi nati onal companies pay more dividends. This research has strongly supported the simultaneity of dividend policy and capital structure.
As it was menti oned earlier, reviewing the literature of theoreti cal foundati ons of this subject, leave us with an unsolved mystery on hand.
Research Design and data
Factors aff ecti ng capital structure
In order to select suitable control variables for investi gati ng the impact of multi -nati onality on capital structure, it is important to diagnose the eff ecti ve elements on capital structure. The aforementi oned control variables must be consistent with existi ng theories and empirical evidence obtained from previous studies. In general, theories in this area emerged by publicati ons of results of eff orts made by Miller and Modigliani [1] and made a new thought basis regarding capital structure. Their eff orts were initi als to development of corporati on fi nancial concepts. They argue that in an effi cient market with no tax and bankruptcy costs, it will not matt er what methods the organizati on undertakes for fi nancing its operati ons. In other words, fi rm value is not related to the manner of combinati on of capital structure. According to their theories, a fi rm’s market value is defi ned by profi tability strength, development plans and growth opportuniti es. In fact this theory has modifi ed during ti me in a way that currently not only capital structure is under the infl uence of tax and bankruptcy costs, there also other eff ecti ve elements in market such as asymmetric informati on, moral hazards and other factors undermining the effi cient market which aff ect capital structure.
Trade-off theory
Companies have goals in terms of their debts rati o and they constantly plan for obtaining these goals. According to the trade-off theory a company must exchange debts with stocks to the extent that the fi nal added-value is equal to the added-value yielded from bankruptcy related costs. In this regard a fi rm’s values are maximized. In other words, according to this theory a fi rm will only achieve an opti mized combinati on of debts and equiti es when the current value of tax saving is equal with current value of fi nal costs of fi nancial distress. Final costs of fi nancial distress include those costs which are created as a result of lack of realizati on of commitments. These costs may include: 1) the cost of inappropriate decisions, 2) inability for making new contracts and 3) customers’ losses .As the amount of debts increase, the possibility of fi nancial distress and its related costs increase as well. Expected costs of fi nancial distress will reduce fi rm’s value and eliminate the tax savings of debts.
The theory considers capital structure related decisions as tax advantage resulted from receiving a loan. If the bankruptcy costs resulted from lack of ability in repayment of debts were more than tax advantages ,the increasing debts is not suitable anymore and then a less loan will be received [14]. Therefore, trade-off theory suggests a negati ve relati on between leverage and bankruptcy costs.
Pecking order theory
Myers[16] and expresses that internal fi nancing is prioriti zed over external fi nancing. Companies prefer to raise their capital fi rst through internal aff airs of the fi rm and through retained earnings and then, they tend to raise their capital through absorpti on of debt and fi nally, when credit risk and the cost of fi nancing from debts is increased as a result of over-borrowing, the last soluti on left for fi rms would be issuing the stocks [7]. According to this theory, more profi table companies have less short-term debts in their capital structure and use more long-term debts for exploitati on of investment opportuniti es. In contrast to the theories of agency cost and free cash fl ows, Myers et al. [7] have anti cipated that under high levels of free cash fl ows, leverage declines.
Myers and Shyam-Sunder [17] suggested a fi nancial funding defi cit model for testi ng the hypotheses of this theory regarding fi rms’ capital structure. They inferred that except for those companies which are close to their suitable level of debt capacity, according to the pecking order of capital structure, funding defi cit is completely supplied through issuing new debts. Thus, we expect a positi ve relati on between funding defi cit and leverage. This relati on is however conditi oned at that fi rms should have performed fi nancial support acti viti es at a level less than their debt capacity. By relying on this model, the funding defi cit model is as follows:
( ) t t t t t
Funding Deficit FunDef =DIV +X + ∆W +R −C
In this relati on we have:
t
DIV : Dividend per share
t
W
∆ : Net increase in working capital t
R : Current porti on of long-term debts
t
C : Current operati on cash fl ow aft er tax deducti on
t
X : Capital expenditure
Capital structure determinants
In the previous secti on, we review theoreti cal foundati ons of capital structure and related theories. This secti on elaborates on determinants of capital structure and also certain hypotheses are expressed for testi ng.
Risk
If companies are able to have a suitable sales conditi on in market and obtain suitable profi ts, then their needs for adopti ng new fi nancial resources especially through absorpti on of debts decreases. Therefore, possibility of reducti on of size, share or combinati on of sales of products of the company can become an issue for managers. In order to express the probability of fl uctuati ons in specifi c level of sales, the phrase of business risk is used. In additi on, the source of the risk can be lack of supplicati on of materials, lack of in ti me producti on of products and lack of in-ti me customer delivery. In this regard, operati ons of a commercial unit leave the managers and investors with the confl ict of obtaining profi ts from sales of products. On this basis, a criterion for esti mati on of business risk is operati onal leverage. Companies and fi rms with higher operati onal leverage are more prone to bankruptcy and should possess a lower fi nancial leverage[18].
Many researchers have cited that as a result of being able to perform bett er diversifi cati on in economic markets of diff erent countries, MCs are faced with less business risks and therefore have a higher fi nancial leverage in their capital structure.
Collateral value of assets
Capital structure theories have all cited that the type of assets possessed by companies aff ect the desirability of that fi rm’s capital structure through diff erent manners. In fact type of asset can be a determining factor for capital structure [19]. In companies, tangible assets or physical assets are considered as an instrument for obtaining debts. Companies which possess tremendous amount of collateral assets, compared to other companies are usually in a bett er situati on for obtaining loans and also these companies will have to tolerate smaller expenses for fi nancial supplicati on
through debts. This is mostly because these types of assets are more secure for creditors [14]. For this reason, a company’s higher COL should be accompanied by higher debts, because higher levels of these assets can act as a guarantee for taking loans. Therefore, we expect to witness a positi ve and signifi cant relati on between leverage and collateral assets of companies.
Regarding comparison of MCs and DCs, it is sti ll unclear that if MCs’ collateral assets are diff erent from collateral assets in DCs. In additi on, if this is the case, it is also unclear whether this diff erence has an impact on fi nancial leverage or not [20].
Non-debt tax shield
Do tax advantages of obtaining debts aff ect the decisions related to fi nancial support and capital structure of companies? To what extent it aff ects the value of a company?
Aft er works done by Miller and Modigliani, these questi ons surfaced for researchers. Although that researchers do not have a general agreement on importance of variables and their manner of aff ecti ng a fi rm’s value, but results of recent studies have shown that tax advantages is a factor which aff ects fi nancial support related decisions of a company.
The eff ect of tax on capital structure is obviously related to every country’s specifi c tax system. Akhtar S. [2] has expressed that with respect to Australia’s newly adopted tax imputati on system, the ability of tax shield of debts can no longer be used as an incenti ve for tendency towards using debts in capital structure.
DE Angelo and R.Masulis [21] developed an opti mal capital structure model in which the eff ect of a company’s tax performance, special taxes and tax shield free debts have been accounted for together. They concluded that fi rms and companies with higher tax-shield free debts are in contact with expected cash fl ows and therefore, keep a lower level of debt in their capital structure.
Profi tability
In his pecking order, Myers cited that companies prefer to raise their capital through accumulated profi ts and then, thorough obtaining debts and issuance of new shares ulti mately. He also states that this type of behavior might be sourced from high costs of share issuance and agencies. In his theory, he has shown that if a company has higher profi tability, the fi rm or the company most probably makes use of internal resources for fi nancial supplicati on rather than external resources. Therefore, one may expect these companies to keep lower fi nancial leverages in their capital structure, because it is much easier to supply capital through accumulated profi ts.
While comparing MCs and DCs; as a result of having access to more than one source of income and having a bett er commercial status, MCs are more prone to obtain higher profi ts. As a result, MCs are probably more profi table than DCs and also MCs make less uses of debt in their capital structure [2].
Firm Size
Many scholars have approved and validated the existence of a relati on between fi rm size and debt rati o. Larger companies are more diversifi ed and are less prone to bankruptcy. According to this, larger fi rms should make use of more debt rati os in their capital structure [22].
Usually, larger companies are more exposed to public and this forces these larger companies to expose more informati on to people, customers, suppliers, analyzers and governmental organizati ons as well. On the other hand, supplicati on of informati on for these companies is relati vely easier, because these companies have already provided required infrastructures and resources in order to provide the stock holders with adequate related informati on. In additi on, compared to smaller fi rms, these large fi rms undergo less expense for collecti on of subsidiary informati on. On this basis, from the perspecti ve of lack of informati on consistency, compared to small fi rms, larger fi rms are able to obtain debts with more moderate prices. This is mostly because creditors have hard ti me obtaining informati on regarding smaller fi rms. In additi on, smaller fi rms undergo higher operati on costs. On this basis existence of a positi ve relati on between fi rm size and rati o of debts is expected [2]. In most cases it has been concluded that MCs are larger than DCs [20, 22]. On this basis, if other factors are remained constant, MCs probably have more long-term debts
compared to DCs [20].
Growth
Equity controlled companies have a high tendency for investment with the aim of sett lement of their debts. Costs of agency are also higher for companies with higher opportuniti es for future growth. This is because these companies are more fl exible in terms of choosing their future investment. Therefore, we expect to witness a negati ve relati on between future growth and long-term debts. In additi on, Myers has cited that in order to reduce a company’s agency costs it is bett er to make use of long-term debts instead of short-term debts. According to this perspecti ve, there is the possibility for existence of a positi ve relati on between short-term debts and future growth [22].
As a result of having commercial acti viti es in more than just one country and having the ability of benefi tti ng from more growth opportuniti es, MCs are expected to be provided with more opportuniti es of future growth compared to DCs. Therefore, MNC,s make use of lower debts in their capital structure.
Dividends
One of the issues which have been mostly disregarded in previous studies regarding eff ects of multi -nati onality of companies on capital structure is the variable of dividend profi ts which has a reverse eff ect on debt rati o. In this regard, paying more profi ts to the stock holders is followed by reduced accumulated profi ts. As a result, the fi rm’s need for being fi nancially supplied by external resources increases and accordingly, debt rati o will be increased. While comparing MCs and DCs, as a result of increased agency costs resulted from acti viti es in diff erent social, cultural and economic environments, more profi ts are distribute among the stockholders to miti gate the agency costs. As a result, paying more profi ts requires external supplicati on and obtaining debt for MCs. In additi on, dividends and debt are both used as substi tute mechanisms to miti gate managerial agency costs of under- and over-investments (Jensen, 1986)
Agency costs of debt
Since managers can make personal use of free cash fl ows, agency related issues are increased and also the fi rm’s value is decreased [8] In additi on, costs of debt att racti on agency including accounti ng, surveillance and other costs lead to formati on of a contradicti on of interests between creditors, stockholders and managers [8]
High agency costs are expected to result less uses of debt in capital structure [5]. The higher agency costs of debt can lead to a higher cost of debt and, consequently, a lower leverage because bondholders must devote more resources in monitoring the fi rm. Costs of agency result in occurrence of interest confl ict between managers and stockholders and between stock holders and creditors[6].
Compared with DCs, MCs have higher agency costs and therefore less leverage for two reasons: First, the geographical spread of multi nati onal corporati ons operati ng environment (due to diff erent languages and legal systems) makes it more diffi cult for lenders to monitor and collect informati on[9]. Secondly, because of their bett er access to internati onal markets, they have higher growth opportuniti es and companies with higher growth opportuniti es have higher agency costs and lower leverage[23].
Compared to DCs, the MCs are expected to undergo higher agency costs [24]. Therefore, we expect the debt levels of MCs to be lower than DCs.
Research Model
The main model of this research has been determined as follows in form of a multi variate regression model:
Model No. 1:
0 1 2 3 4 5
6 7 8 9 10 11
LEVERAGE a a BusRisk a ROA a MTB a COL a NDTS
a Lsize a DOL a FundDef a Tax a DivPO a Fsale
=
+
+
+
+
+
+
+
+
+
+
+
Considering the above menti oned model, the research variables include two groups of dependent variables and independent variables.
A) Dependent variables
The dependent variable of this study is the rati o of long-term debts as an index of capital structure. It is calculated through the following formula:
LEVERAGE=LTD/ (LTD+MVE) MVE: Market value of equity
B) Independent variables
In this study profi tability, growth opportuniti es, collateral assets, fi rm size, rati o of dividend payouts, non-debt tax shield, tax rates, exports (foreign sales), business risk and bankruptcy costs have been selected as independent variables. Each of the variables has been explained further in table 1.
Table 1: variables defi niti on
variable symbol Defi niti on Unit
Leverage LEV Rati o of long-term debts to sum of long-term debts and market value of equity Rati o
Foreign sales Rati o Fsales Total foreign sales divided by total sales Percentage
Multi nati onal
Dummy M
Dummy variable for multi -nati onality (value 1 for exports of more than 2% and
value 0 other wise) 0 or 1
Business Risk BusRisk Standard deviati on of fi rst diff erence in EBIT divided by total assets in 3 years Std Dev.
Dividend Pay out DivPO Rati o of DPS to EPS Percentage
Degree of Operati ng
Leverage DOL Annual changes divided by percentage of changes in sales rati o
Profi tability ROA Earning before interet and tax divided by total asset Percentage
Growth Opportunity MTB Market value divided by book value of the fi rm at the end of fi scal year rati o
Collaterals COL Rati o of constant assets to total assets rati o
Non-Debt Tax Shield NDTS Rati o between depreciati on to total assets rati o
Funding Defi cit FundDEF Funding Deficit FunDef( )=DIVt +Xt+ ∆Wt +Rt−Ct
Tax Rate Tax
Firms size Lsaze Natural log of total assets number
Research Methodology
Research hypotheses
Main hypothesis: a signifi cant diff erence exists between capital structure of multi nati onal
Subsidiary hypotheses:
Hypothesis 1: The impact of dividend payout on the rati o of long-term debts is signifi cant
and negati ve.
Hypothesis 2: The impact of profi tability on the rati o of long-term debts is signifi cant and
negati ve.
Hypothesis 3: The impact of fi rm size on the rati o of long-term debts is signifi cant and
positi ve.
Hypothesis 4: The impact of collateral assets on the rati o of long-term debts is signifi cant
and positi ve.
Hypothesis 5: The impact of growth opportuniti es on the rati o of long-term debts is
signifi cant.
Hypothesis 6: The impact of funding defi cit on the rati o of long-term debts is signifi cant and
negati ve.
Hypothesis 7: The impact of tax rates on the rati o of long-term debts is signifi cant and
negati ve.
Hypothesis 8: The impact of business risk on the rati o of long-term debts is signifi cant and
negati ve.
Hypothesis 9: The impact of non-debt tax shield on long-term debts is signifi cant.
Hypothesis 10: The impact of level of operati onal leverage on the rati o of long-term debts is
signifi cant and negati ve.
Research Method
The present study is aimed at answering the questi on that if the aforementi oned determinants have diff erent and signifi cant eff ects on capital structure of MCs and DCs listed in Tehran’s stock exchange or not. In terms of methods, this study is a descripti ve-correlati ve research and also in terms of manner of data collecti on, it is a post-event study. In order to compare the profi ts dividing policies of MCs and DCs, the t-test and the Mann-Whitney test have been used as well as a multi variate linear regression model under a least squares approach.
Populati on and Sample
The populati on includes all listed companies in Tehran Stock Exchange in the period 2008-2013 during which their informati on was available and consists of the following conditi ons. 1 – Informati on is available during the research period. 2 – Fiscal period of companies lead to end of Isfand Iranian calendar each year. 3 – No change occurs in the fi nancial period from 2008 to 2013. 4 – Companies have no trading interval exceeding 6 months from 2008 to 2013. 5 – They are not part of holding companies, investment, banks, insurance, fi nancial insti tuti ons and fi nancial intermediati on. Applying the above constraints, 712 companies were selected by using screening method.
Empirical Results
Descripti ve stati sti cs
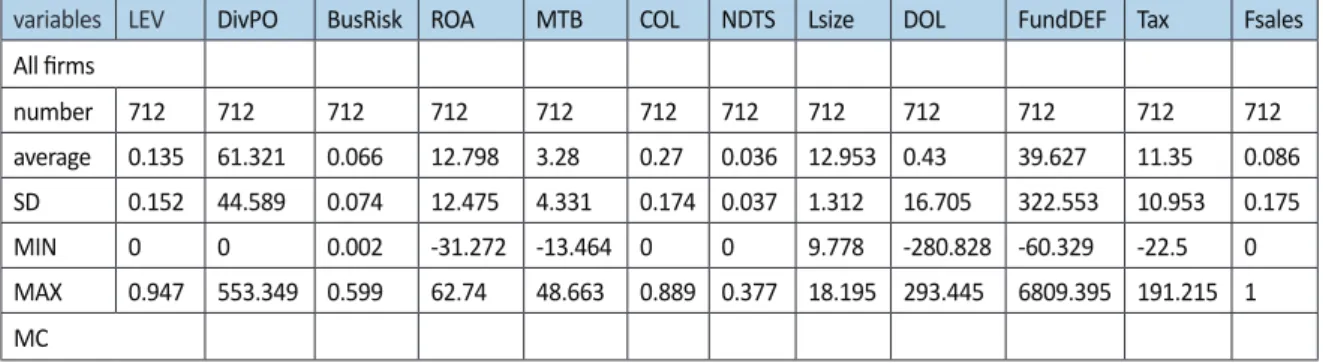
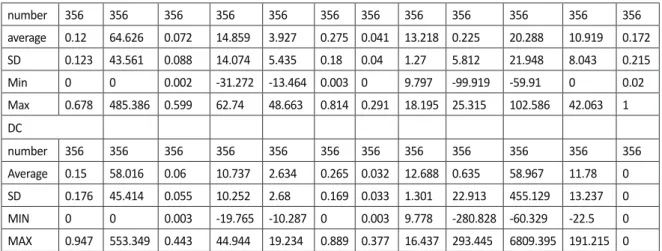
Table 2: descripti ve stati sti cs for all data
variables LEV DivPO BusRisk ROA MTB COL NDTS Lsize DOL FundDEF Tax Fsales All fi rms number 712 712 712 712 712 712 712 712 712 712 712 712 average 0.135 61.321 0.066 12.798 3.28 0.27 0.036 12.953 0.43 39.627 11.35 0.086 SD 0.152 44.589 0.074 12.475 4.331 0.174 0.037 1.312 16.705 322.553 10.953 0.175 MIN 0 0 0.002 -31.272 -13.464 0 0 9.778 -280.828 -60.329 -22.5 0 MAX 0.947 553.349 0.599 62.74 48.663 0.889 0.377 18.195 293.445 6809.395 191.215 1 MC
number 356 356 356 356 356 356 356 356 356 356 356 356 average 0.12 64.626 0.072 14.859 3.927 0.275 0.041 13.218 0.225 20.288 10.919 0.172 SD 0.123 43.561 0.088 14.074 5.435 0.18 0.04 1.27 5.812 21.948 8.043 0.215 Min 0 0 0.002 -31.272 -13.464 0.003 0 9.797 -99.919 -59.91 0 0.02 Max 0.678 485.386 0.599 62.74 48.663 0.814 0.291 18.195 25.315 102.586 42.063 1 DC number 356 356 356 356 356 356 356 356 356 356 356 356 Average 0.15 58.016 0.06 10.737 2.634 0.265 0.032 12.688 0.635 58.967 11.78 0 SD 0.176 45.414 0.055 10.252 2.68 0.169 0.033 1.301 22.913 455.129 13.237 0 MIN 0 0 0.003 -19.765 -10.287 0 0.003 9.778 -280.828 -60.329 -22.5 0 MAX 0.947 553.349 0.443 44.944 19.234 0.889 0.377 16.437 293.445 6809.395 191.215 0
Main hypothesis
There is a signifi cant diff erence between capital structures of DCs
and MCs.
In this hypothesis, the average diff erence of rati o of long-term debts of both MCs and DCs are subjected to stati sti cal tests through t-test and Mann-Whitney test as an index of capital structure. Findings obtained during esti mati on of main hypothesis are shown in fi gure 3. With respect to obtained signifi cance value, for the t-test the main hypothesis is accepted at a confi dence level of 99%. It means that multi -nati onality of companies has a signifi cant eff ect on their capital structure. There also exists a signifi cant diff erence between capital structure of MCs and DCs. In this regard, multi nati onal companies keep a lower leverage in their capital structure. Findings of this research are in contrast with traditi onal theories which cited that as a result of being larger in size and having more diversifi cati on advantages; MCs should have higher debts compared to DCs. These fi ndings are consistent with the fi ndings obtained by Lee & Kwok [3] and Doukas & Pantzalis [5].
Table 3 results of tests of t and Mann-Whitney for the main hypothesis
Dependent
variable Sig. t-test Sig. Mann-Whitney Hypothesis result LEV 0.008 2.657 0.123 59140500 accepted
For further explanati on and for having a bett er comparison of MCs and DCs, the results of the t-test plus the Mann-Whitney test for independent variables of the model are presented in the following table.
Table 4 results of t and the Mann-Whitney test
DivPO BusRisk ROA MTB COL NDTS Size COL FundDEF Tax
MCs(mean) 64.626 0.072 14.859 3.927 0.275 0.041 13.218 0.225 20.288 10.919 DCs (mean) 58.016 0.06 10.737 2.634 0.265 0.032 12.688 0.635 58.967 11.78 t-test -1.982 -2.18 -4.467 -4.026 -0.75 -3.17 -5.503 0.328 1.602 1.048 Signifi cance 0.048 0.03 0 0 0.454 0.002 0 0.743 0.11 0.295 M a n n -Whitney -2.648 -0.245 -4.294 -4.523 -0.413 -1.904 -6.02 -4.038 -2.116 -0.851 Signifi cance 0.008 0.806 0 0 0.68 0.057 0 0 0.034 0.395
Subsidiary hypotheses
In the following, by making use of the linear multi variate regression model, we try to test the subsidiary hypotheses for both MCs and DCs. Before starti ng this test, there are some conditi ons that need to hold. First, in order to investi gate the normality of the variable of total debts, we use the Kolmogorov-Smirnoff test. As you can see in table 5, aft er normalizati on we have obtained a
signifi cance value of larger than 0.05. Therefore, it can be said that this variable is normal.
Table 5 results of Kolmogorov-Smirnoff test
Dependent variable Type of fi rms number K-S Sig. LEV
MCs 356 1.703 0.324
DCS 356 1.119 0.112
Total 712 1.560 0.125
Aft er this test, the variance analysis test was performed in order to validate the credibility of the multi variate linear regression test for each group of MCs and DCs. Results are shown in table 7. According to signifi cance values obtained which is less than 0.05 for both groups, then this model has adequate credibility.
Table 6 Total signifi cance of regression
LEV model Sum of squares d.f mean squares F Sig. MCs Regression 131.596 11 11.963 18.633 0.0 Residual 220.870 344 0.642 Sum 352.465 355 DCs Regression 111.327 10 11.133 15.751 0.0 Residual 243.852 345 0.707 Sum 355.179 355
Figure 7 shows that for MCs, the value of Durbin-Watson stati sti c is equal to 1.749. This value is larger than 1.5 and therefore there is no correlati on related errors. In additi on, the reformed determinati on coeffi cient is equal to 0.318 and this shows that this model is able to anti cipate approximately 32% of long term debts. On the other hand, for DCs the value of Durbin-Watson stati sti c is 1.919 which is also larger than 1.5 and therefore there are no correlati on related errors. In additi on, the reformed determinati on coeffi cient is equal to 0.294 and this shows that this model is able to anti cipate approximately 30% of long term debts.
With respect to above menti oned validati ons, results of the multi variate regression are shown in table 7.
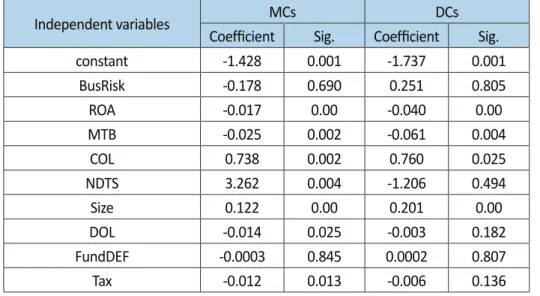
Table 7 coeffi cients of the regression model
Independent variables MCs DCs Coeffi cient Sig. Coeffi cient Sig. constant -1.428 0.001 -1.737 0.001 BusRisk -0.178 0.690 0.251 0.805 ROA -0.017 0.00 -0.040 0.00 MTB -0.025 0.002 -0.061 0.004 COL 0.738 0.002 0.760 0.025 NDTS 3.262 0.004 -1.206 0.494 Size 0.122 0.00 0.201 0.00 DOL -0.014 0.025 -0.003 0.182 FundDEF -0.0003 0.845 0.0002 0.807 Tax -0.012 0.013 -0.006 0.136
DivPO -0.001 0.120 -0.004 0.002 MCs Adjusted R2=0.318 Durbin-Watson=1.749 DCs Adjusted R2=0.294 Durbin-Watson=1.919 1.428 0.017( ) 0.025( ) 0.738( ) 3.262( ) 0.122(MC ) 0.014( ) 0.012( ) LTD ROA MTB COL NDTS
LSize DOL TaxRate
= − − − + +
+ − −
1.737 0.040( ) 0.061( ) 0.760( ) 0.201( )
0.002(DC )
LTD ROA MTB COL LSize
DPR
= − − − + +
−
Results shown in fi gure 7 try to show the eff ecti ve which express the diff erences between capital structures among MCs and DCs
First subsidiary hypothesis:
With respect to fi gures, signifi cance values obtained from tests show a signifi cant diff erence in terms of average of business risk among MCs and DCs. In this regard, MCs are more exposed to risks. With respect to fi gures, the eff ect of business risk is negati ve for capital structure of both MCs and DCs. However, for none of these companies this eff ect was signifi cant.
Second subsidiary hypothesis:
The eff ect of profi tability is signifi cant and negati ve for both groups. This eff ect is respecti vely -0.009 and -0.012 for MCs and DCs. This means that if a company’s net profi ts are increased, they will tend to make less use of debts. On the other hand, with respect to table 4, MCs have higher profi tability compared to DCs. According to aforementi oned analyses, it becomes clear that not only profi tability has a signifi cant and negati ve eff ect on capital structure, but also in MCs this eff ect is higher than DCs as a result of having higher profi tability.
Third subsidiary hypothesis:
According to analyses shown in table 4, at a confi dence of 99% it can be stated that there exists a signifi cant diff erence among growth opportuniti es of MCs and DCs. In this regard, MCs with an average of growth of 3.927 have a higher growth rati o compared to DCs with an average of growth of 2.634. Regression results have also approved the signifi cant negati ve eff ects of growth opportuniti es on leverage in both MCs and DCs. On this basis, on the one hand with respect to negati ve eff ects of growth opportuniti es on level of fi nancial debts and on the other hand, since MCs are provided with more growth chances, it is expected that growth opportuniti es have a more negati ve eff ect on capital structure in MCs. In fact these companies make use of lower fi nancial debts in their capital structures.
Fourth subsidiary hypothesis:
With respect to results of the t-test, no signifi cant diff erence was found between collateral assets of MCs and DCs. In additi on, with respect to the results of regression, the eff ect of this variable was found to be signifi cant on capital structure for both MCs and DCs. For MCs signifi cance was calculated as 99% and for DCs it was calculated as 95%. Therefore, it can be claimed that companies and fi rms which possess more collateral assets, have more capabiliti es in terms of obtaining loans. In this regard, the direct relati on between collateral assets and rati o of long-term debts is approved.
Fift h subsidiary hypothesis:
Results of fi gure 4 showed that there exists a signifi cant diff erence between tax shield debts of MCs and DCs. In this regard, with a confi dence of 99% it can be said that MCs are provided with more tax shield debts. Results of regression indicated that this variable has a signifi cant and positi ve eff ect on capital structure of MCs. However, for DCs this relati on was not signifi cant.
Sixth subsidiary hypothesis:
Natural logarithm of size of MCs and DCs is respecti vely 13.218 and 12.688. This shows a signifi cant diff erence at confi dence level of 99%. In this regard, MCs are larger than DCs. With respect to results of regression, this variable has a positi ve and signifi cant eff ect on capital structure for both MCs and DCs. In other words, larger fi rms are more capable in terms of obtaining debts. If other variables are held constant, as a result of being larger the MCs wll have higher long-term debts.
Seventh subsidiary hypothesis:
With respect to table 4, signifi cance level of the diff erence between operati onal leverage in MCs and DCs is 0.328. This value is larger than 0.05 and therefore, no signifi cant diff erence was observed between operati onal leverage of MCs and DCs.
In terms of capital structure, the eff ect of operati onal leverage was signifi cant and negati ve. However this eff ect was not signifi cant for DCs.
Eighths subsidiary hypothesis:
Results of the fi gure 4 show that signifi cance levels obtained from the t-test and the Mann-Whitney test show a lack of diff erence in average commercial defi ciencies of MCs and DCs. Results of table 7 also have shown that there exists no signifi cant relati on between the variable of commercial defi ciency and capital structure among both MCs and DCs.
Ninth subsidiary hypothesis:
With respect to fi gure 4, signifi cance levels obtained from the t and the Mann-Whitney test for the variable of tax rates is 0.295.this error value is larger than the acceptable range of 5%. Therefore there are no signifi cant diff erences in average rate of taxes between MCs and DCs. with respect to fi gure 7, eff ects of tax rates on capital structure of both MCs and DCs is positi ve but not signifi cant for any of them.
Tenth subsidiary hypothesis:
With respect to fi gure 4, a diff erence is evident between average dividend profi ts of MCs and DCs. In this regard, compared to DCs, MCs divide more profi ts between their stock holders. With respect to fi gure 7, this diff erence was not signifi cant. For DCs this variable had a signifi cant diff erent eff ect on capital structure. The eff ect of dividend payout on long-term debts in DCs is equal to -0.0006.
Conclusions
This study investi gates the determinants of capital structure of MCs and DCs listed in Tehran stock exchange. Results showed that, compared to DCs, MCs have a signifi cantly lower leverage. In additi on, MCs are signifi cantly larger than DCs and are provided with more growth opportuniti es, more profi tability, and have more non-debt tax shield and higher business risk. However, they pay more dividends to their stockholders.
Main theories regarding capital structure express that as a result of diversifi cati on advantages and having a larger size, MCs have higher debts. In contrast, empirical results of this research have shown that these companies have a lower debt capacity as a result of extraordinary risks imposed by acti vity in foreign environments.
A negati ve and signifi cant relati on was found between profi tability and long-term debts for both MCs and DCs. This shows that external fi nancing will decrease when companies make more profi ts. This fi nding is consistent with the fi nding obtained by Naveed Ahmad et al. [25]. However, this fi nding is consistence with hypotheses of pecking order theory and is in contrast with trade-off theories.
and DCs. These fi ndings are inconsistent with the fi ndings obtained by Burgman [9], Aggarwal and Aung Kyaw [11].
The negati ve and signifi cant relati on was found between the variables of growth opportuniti es and rati o of long-term debts for both MCs and DCs. This fi nding is inconsistent with the fi ndings obtained by Titman S., Wessel [22, 26]. In additi on these fi ndings are consistent with fi ndings obtained by Nishioka and Baba [27]. In additi on, these fi ndings validate the hypotheses of agency cost theory that expresses that companies with higher growth opportuniti es should take lower loans, in order to be able to control their profi tability. As it was expected, companies with larger size and companies with higher collateral assets have higher debt capacity and the relati on between both fi xed asset and fi rm size with leverage was signifi cant and positi ve for MCs and DCs. This result is consistent with the result obtained by Graham [14] and Shami Akhtar [2]. These authors have declared that larger companies are more diversifi ed and are less prone to bankruptcy. According to this content, larger fi rms should make use of a higher debt rati o in their capital structure. Furthermore fi nding a positi ve impact of fi xed assets on long-term debts approved the works carried out by Graham [14] and Jensen [28]. These authors proved that companies with high levels of collateral assets are usually in a bett er status for obtaining loans. Dividend payout has a negati ve and signifi cant relati on with long-term debts in DCs. This means that companies which have higher long-term debts in their capital structure will have to distribute less profi ts among their stockholders. This fi nding is consistent with fi ndings obtained by Jensen [8], Aggrawal and Jayaraman [29], Shami Akhtar and Oliver [20] and Aggarwal and Aung Kyaw [11]. However, for MCs this relati on was not stati sti cally signifi cant.
No signifi cant relati on was found between non-debt tax shield and long-term debts in DCs. For MCs this relati on was signifi cant and strongly positi ve which means that because of tax benefi ts of export in this country, companies try to benefi t more and use higher rate of leverage. This result strongly support the concepts of trade-of theory and is inconsistent with the fi ndings obtained by Di Angelo and Musalis [21]; Titman S. [22], Twite [30] and Raj Aggrawal [31]. Although there is no signifi cant relati onship between degrees of operati ng leverage and long-term debts for DCs, a signifi cant negati ve relati on for MCs was observed between operati ng leverage as a proxy of fi rm’s risk and usage of loan. This fi nding is inconsistent with the fi nding obtained by Aggarwal and Aung Kyaw [11]. For MCs, tax rates had a negati ve and signifi cant relati on with long-term debts, meanwhile in spite of existence of a negati ve relati on between tax rates and long term debts of DCs, this relati on was not signifi cant.
The table below displays summary of results.
Main hypothesis results
There is a signifi cant diff erence between capital structures of DCs and MCs. approved
Subsidiary hypotheses results
DC MC
Hypothesis 1: The impact of dividend payout rati o on the rati o of long-term debts is signifi cant and
negati ve. ×
Hypothesis 2: The impact of profi tability on the rati o of long-term debts is signifi cant and negati ve.
Hypothesis 3: The impact of fi rm size on the rati o of long-term debts is signifi cant and positi ve.
Hypothesis 4: The impact of collateral assets on the rati o of long-term debts is signifi cant and
positi ve.
Hypothesis 5: The impact of growth opportuniti es on the rati o of long-term debts is signifi cant.
Hypothesis 6: The impact of budget defi ciency on the rati o of long-term debts is signifi cant and
negati ve. × ×
Hypothesis 8: The impact of business risk on the rati o of long-term debts is signifi cant and negati ve. × ×
Hypothesis 9: The impact of tax shield debts on the rati o of long-term debts is signifi cant. ×
Hypothesis10: The impact of level of operati onal leverage on long-term debts is signifi cant and
negati ve. × ×
References
Modigliani, F. and M.H. Miller, The cost of capital, corporati on fi nance and the theory of investment. The American economic review, 1958. 48(3): p. 261-297.
Akhtar, S., The determinants of capital structure for Australian multi nati onal and domesti c corporati ons. Australian journal of management, 2005. 30(2): p. 321-341.
Lee, K.C. and C.C. Kwok, Multi nati onal corporati ons vs. domesti c corporati ons: Internati onal environmental factors and determinants of capital structure. Journal of Internati onal Business Studies, 1988. 19(2): p. 195-217.
Ramirez, A. and C.C. Kwok, Sett ling the debate on multi nati onal capital structure using the CEPR measure. Journal of Multi nati onal Financial Management, 2010. 20(4): p. 251-271.
Doukas, J.A. and C. Pantzalis, Geographic diversifi cati on and agency costs of debt of multi nati onal fi rms. Journal of Corporate Finance, 2003. 9(1): p. 59-92.
Mitt oo, U.R. and Z. Zhang, The capital structure of multi nati onal corporati ons: Canadian versus US evidence. Journal of Corporate Finance, 2008. 14(5): p. 706-720.
Myers, S.C. and N.S. Majluf, Corporate fi nancing and investment decisions when fi rms have informati on that investors do not have. Journal of fi nancial economics, 1984. 13(2): p. 187-221. Jensen, M.C. and W.H. Meckling, Theory of the fi rm: Managerial behavior, agency costs and ownership structure. Journal of fi nancial economics, 1976. 3(4): p. 305-360.
Burgman, T.A., An empirical examinati on of multi nati onal corporate capital structure. Journal of internati onal business studies, 1996. 27(3): p. 553-570.
Fatemi, A.M., The eff ect of internati onal diversifi cati on on corporate fi nancing policy. Journal of Business Research, 1988. 16(1): p. 17-30.
Aggarwal, R. and N.A. Kyaw, Capital structure, dividend policy, and multi nati onality: Theory versus empirical evidence. Internati onal Review of Financial Analysis, 2010. 19(2): p. 140-150.
Kwok, C.C. and D.M. Reeb, Internati onalizati on and fi rm risk: An upstream-downstream hypothesis. Journal of Internati onal Business Studies, 2000. 31(4): p. 611-629.
Desai, M.A., C.F. Foley, and J.R. Hines, Capital structure with risky foreign investment. Journal of Financial Economics, 2008. 88(3): p. 534-553.
Graham, J.R., How big are the tax benefi ts of debt? The Journal of Finance, 2000. 55(5): p. 1901-1941.
Donaldson, G., Corporate Debt Capacity: A Study of Corporate Debt Policy and Determinati on of Corporate Debt Capacity. Harvard Graduate School of Business administrati on, 1961.
Myers, S.C., The capital structure puzzle. The journal of fi nance, 1984. 39(3): p. 574-592.
Shyam-Sunder, L. and S.C. Myers, Testi ng stati c tradeoff against pecking order models of capital structure. Journal of fi nancial economics, 1999. 51(2): p. 219-244.
Shahveisi, F., et al., The Study of the Relati onship between the Capital Structure and the Variables of the Value-based Performance Assessment. Research Journal of Finance and Accounti ng, 2012. 3(7): p. 131-139.
Rajan, R.G. and L. Zingales, What do we know about capital structure? Some evidence from internati onal data. The journal of Finance, 1995. 50(5): p. 1421-1460.
Akhtar, S. and B. Oliver, Determinants of capital structure for Japanese multi nati onal and domesti c corporati ons. Internati onal review of fi nance, 2009. 9(1-2): p. 1-26.
DeAngelo, H. and R.W. Masulis, Opti mal capital structure under corporate and personal taxati on. Journal of fi nancial economics, 1980. 8(1): p. 3-29.
Titman, S. and R. Wessels, The determinants of capital structure choice. The Journal of fi nance, 1988. 43(1): p. 1-19.
Myers, S.C., Determinants of corporate borrowing. Journal of fi nancial economics, 1977. 5(2): p. 147-175.
Akhtar, S., Capital structure and business cycles. Accounti ng & Finance, 2012. 52(s1): p. 25-48. Ahmed, N., Z. Ahmed, and I. Ahmed, Determinants of capital structure: A case of life insurance sector of Pakistan. European Journal of Economics, Finance and Administrati ve Sciences, 2010. 24: p. 7-12.
Titman, S., The eff ect of capital structure on a fi rm’s liquidati on decision. Journal of fi nancial economics, 1984. 13(1): p. 137-151.
Nishioka, S. and N. Baba, Dynamic capital Structure of Japanese fi rms. How Far Has the Reducti on of Excess Leverage. JAPAN, 2004.
Jensen, M.C., Agency cost of free cash fl ow, corporate fi nance, and takeovers. Corporate Finance, and Takeovers. American Economic Review, 1986. 76(2).
Agrawal, A. and N. Jayaraman, The dividend policies of all-equity fi rms: A direct test of the free cash fl ow theory. Managerial and Decision Economics, 1994. 15(2): p. 139-148.
Twite, G., Capital structure choices and taxes: Evidence from the Australian dividend imputati on tax system. Internati onal Review of Finance, 2001. 2(4): p. 217-234.
Aggarwal, R. and S. Zhao, The Diversifi cati on Discount Puzzle: Evidence for a Transacti on-Cost Resoluti on. Financial review, 2009. 44(1): p. 113-135.
Recebido em 1 de fevereiro de 2018. Aceito em 16 de fevereiro de 2018.