Fundação Getúlio Vargas Escola de Economia de São Paulo
Leonel Rodrigues Bogéa Sobrinho
Country Factors and the Dynamic Modeling of Capital Structure: an Empirical Study of Latin American Firms
Leonel Rodrigues Bogéa Sobrinho
Country Factors and the Dynamic Modeling of Capital Structure: an Empirical Study of Latin American Firms
Dissertação apresentada à Escola de Economia de São Paulo da Fundação Getúlio Vargas, como requisito para obtenção do título de Mestre em Finanças e Economia Empresarial, com especialização em Finanças
Orientador: Prof. Dr. Hsia Hua Sheng
Co-orientadora: Prof. Dra. Mayra Ivanoff Lora
Bogéa Sobrinho, Leonel Rodrigues.
Country Factors and the Dynamic Modeling of Capital Structure: an Empirical Study of Latin American Firms / Leonel Rodrigues Bogéa Sobrinho - 2010. 38 f.
Orientador: Hsia Hua Sheng
Dissertação (mestrado profissional) - Escola de Economia de São Paulo.
1. Estrutura de capital. 2. Capital (Economia) -- Custos. 3. Empresas – Financiamento – América Latina. I. Sheng, Hsia Hua. II. Dissertação (mestrado profissional) - Escola de Economia de São Paulo. III. Título.
Leonel Rodrigues Bogéa Sobrinho
Country Factors and the Dynamic Modeling of Capital Structure: an Empirical Study of Latin American Firms
Dissertação apresentada à Escola de Economia de São Paulo da Fundação Getúlio Vargas, como requisito para obtenção do título de Mestre em Finanças e Economia Empresarial, com especialização em Finanças
Data de Aprovação: ___/___/___
Banca examinadora:
______________________________________ Prof. Dr. Hsia Hua Sheng (Orientador)
FGV-EAESP
______________________________________ Profa. Dra. Mayra Ivanoff Lora (Co-orientadora) FGV- EESP
______________________________________ Prof. Dr. Wilson Toshiro Nakamura
Agradecimentos
Expresso meus sinceros agradecimentos a todos que contribuíram para a realização da presente obra:
A Lia, pela compreensão e paciência infinitas e pela companhia reconfortante nos momentos mais árduos ao longo deste percurso;
À minha família, cujos exemplos e sacrifício me proporcionaram condições para o sucesso;
A meus amigos, temporariamente abandonados por mim, mas sempre encorajadores;
A toda a equipe Itaú Private Bank, pela oportunidade e por todo suporte oferecidos;
A todos os colegas, professores e monitores do Mestrado Profissional em Economia, pelo aprendizado e amizade;
Aos Profs. Hsia Hua Sheng e Mayra Ivanoff Lora, pela orientação e incentivo durante o desenvolvimento deste trabalho.
Resumo
Desenvolvemos modelos de ajuste parcial e de duration para testar a relevância de fatores específicos de países na determinação da estrutura de capital de empresas listadas nas bolsas de valores brasileira, chilena e mexicana. Utilizamos dados em painel, em um período que se estende do quarto trimestre de 1996 ao segundo trimestre de 2010, abrangendo 4403 observações relacionadas a 139 empresas diferentes. Os resultados obtidos sugerem que a dinâmica da estrutura de capital varia por país e que idiossincrasias locais são determinantes-chave dos níveis de alavancagem das empresas. Não detectamos comportamento explicado pela Teoria de Trade Off entre as empresas brasileiras, chilenas e mexicanas, o que indica que teorias alternativas possam comandar os processos de decisão de financiamento dos gestores latino americanos.
Palavras-chave: estrutura de capital, custos de ajustamento, modelos de ajuste
Abstract
We develop partial adjustment and duration models to test the relevance of country idiosyncrasies in determining the capital structure of publicly-traded Brazilian, Chilean and Mexican firms. Our data panel, ranging from the 4th quarter of 1996 to the 2nd quarter of 2010, consists of 4403 firm-quarter observations pertaining to 139 firms. Our findings suggest that capital structure dynamics vary by country and that local idiosyncrasies are key determinants of firms’ leverage levels. Additionally, trade off behavior cannot be clearly detected among Brazilian, Chilean and Mexican firms, suggesting that alternative theories steer the financing decision processes of Latin American managers.
Keywords: capital structure, adjustment costs, partial adjustment models, duration
Lista de Quadros
Lista de Tabelas
Sumário
1 Introduction ... 13
2 Literature Review ... 15
3 Hypotheses and Econometric Models ... 20
3.1 Objectives of the Research ... 20
3.2 The Relevance of Firms’ Country of Origin ... 20
3.3 Partial Adjustment Model and Speed of Adjustment ... 21
3.4 Duration Analysis ... 22
3.5 Data and Sample Selection ... 25
3.5.1 Panel data for the partial adjustment model ... 25
3.5.2 Cross-section data for the duration model ... 26
4 Empirical Results ... 27
4.1 Speed of Adjustment ... 27
4.2 Duration Analysis ... 30
5 Conclusion ... 34
13
1 Introduction
Notwithstanding the vast body of knowledge developed throughout the last decades, results of capital structure research are still not consistent in clarifying the key factors behind firms’ decisions. Recent evidences point out that country, institutional and economic factors have significant influence over capital structure behavior and thus their omission from previous studies would represent a shortcoming to the discussion hitherto. Kayo and Kimura (2010) and Jong, Kabir and Nguyen (2008) analyze capital structure behavior along firms of several countries worldwide, whereas other studies such as Cheng and Shiu (2007), Joeveer (2006) and Mitton (2008) restrict analyses to a smaller group of related countries.
Overlooking the effects of country idiosyncrasies, Lemmon, Roberts and Zender (2008) argue that the specifications so far adopted to analyze capital structure are at least debatable and may have misled researchers. They state that capital structure is not predominantly determined by classical determinants (such as size and tangibility) and advocate for the development of new approaches to unveil the actual factors governing leverage. Likewise, Leary and Roberts (2005) emphasize that the oversight of adjustment costs to the dynamics of capital structure has misguided researchers throughout past studies. They propose that costly adjustment responds for the observed persistence of shocks to leverage and explains the apparent indifference of firms to leverage oscillations.
14 order to assess whether the obtained results are consistent with the hypotheses of active rebalancing and costly adjustment; and to verify whether the estimated results significantly diverge when firms are grouped by country of origin and propose theoretical grounds to support the evidences.
15
2 Literature Review
The capital structure literature is well developed, particularly regarding the trade off and pecking order theories. We refer to Rocha (2007) and Matsuo and Eid Jr. (2005) for a comprehensive overview of empirical studies since Modigliani and Miller (1958) and the most relevant theories developed thus far.
Contrasting with other theories, the trade off theory establishes that firms actively counteract deviations of their leverage ratios, aiming at optimal levels (FLANNERY; RANGAN, 2006). Static trade off models disregard the effect of adjustment costs, thus implying that leverage adjustments would instantly neutralize shocks; and that the target capital structures are unchanging in time. Dynamic trade off allows for timely response and shocks persistence, given that the speed to offset deviations would depend on the magnitude of adjustment costs. (LEARY; ROBERTS, 2005). It also allows firms to reassess their target capital structures over time, determining more appropriate levels (ROCHA, 2007).
A noteworthy contribution of researchers that ventured in the dynamic approach, such as Flannery and Rangan (2006) and Dang, Kim and Shin (2008), is the development of partial adjustment models in which the optimal capital structure is determined endogenously. We pay particular attention to the findings of Lemmon et al. (2008). They estimated a partial adjustment model wherein the speed of adjustment provides a direct way of quantifying the extent to which time-varying factors help determining target leverage. Following Dang et al. (2008), who further developed the models employed by Ozkan (2001) and Flannery and Rangan (2006), a general partial adjustment model may be given by:
1 (1)
16 is a measure of the rate at which firms close the gap between their actual and target leverage levels each period.
Equation (1) approximates firms’ capital structure behavior and presupposes that leverage eventually reverts to its target level. The model allows for not only examining whether firms target and pursue specific leverage ratios, but also investigating whether variables exhibit explanatory power when their omission significantly reduces the speed of adjustment (LEMMON ET AL., 2008). They concluded that leverage eventually reverts to a given target level essentially determined by factors other than time-varying firm characteristics, and prompted future research to further investigate the implications of such findings.
We also highlight the paper of Leary and Roberts (2005), who innovated through applying a duration model to corroborate that the persistence of shocks to leverage results from costly adjustment rather than management unconcern for capital structure deviations. Given that costly adjustment creates disincentives for firms to immediately offset shocks to capital structure and firms would not engage in active rebalancing until its associated marginal gains exceed the adjustment costs, the authors advocate for the existence of a range within which leverage floats erratically.
Rebalancing halts until leverage violates either the upper or lower threshold levels – when this happens, firms adjust leverage back within the range boundaries. The duration of periods of relative inactivity would therefore be determined by cost functions (which determine the upper and lower boundaries) and leverage history (which determines the proximity to such boundaries).
17 gives the probability that a state that persisted as long as t ends within a short increment of time (COTTRELL; LUCCHETTI, 2008). This yields the log-likelihood:
∑ log !, , " ∑ log # ! , , " $og % ! , , " (2)
Leary and Roberts (2005) established grounds to future research regarding not only the role of adjustment cost functions in shaping the behavior of capital structure, but also the explanatory power of factors triggering the adjustment process towards target leverage rather than target leverage itself. Key accomplishments from other recent research founded on dynamic models are summarized in Chart 1.
Chart 1 – Selected papers on the dynamic modeling of capital structure
Author(s) Year Remarks
Copat 2009 Verifies through static and dynamic models that firm-specific factors are key determinants of leverage for Latin American firms
Dang et al. 2008 Develops an asymmetric partial adjustment model to evaluate the role of financial flexibility and adjustment costs to explain the capital structure of UK firms
Machado 2009 Employs a duration analysis to evaluate the impact of costly adjustment on the behavior of leverage for Brazilian firms
Lemmon et al. 2008
Employs static and dynamic models to find evidences that rather than be explained by time-varying determinants, leverage is mostly driven by permanent effects
Rocha 2007 Employs a dynamic model to test the validity of and directly compare the trade-off, pecking order, market timing and management inertia theories for Brazilian firms
Flannery and
Rangan 2006 Employ a partial adjustment model to find evidences that US firms adjust their capital structures toward a target leverage ratio.
Leary and
Roberts 2005 Employs a duration analysis to evaluate the impact of costly adjustment on the behavior of leverage for US firms Source: developed by the author
18
Chart 2 - Selected papers on institutional, macroeconomic and industry determinants of capital structure
Author(s) Year Remarks
Kayo and
Kimura 2010
Country and industry-specific factors are less important than firm-specific factors to explain leverage, developed and emerging countries’ firms display different behavior
Bastos et al. 2009 Macroeconomic and institutional factors are less important than firm-specific factors to explain leverage for Latin American countries firms
Copat 2009 Firm-specific factors are the key determinants of leverage for Latin American
firms Kirch, Mateus
and Terra 2008
Firm-specific factors are the key determinants of leverage for private Eastern European firms
Mitton 2008 Country-specific factors are less important than firm-specific factors to explain
leverage for emerging countries firms Cheng and
Shiu 2007
Institutional factors are at least as relevant as firm-specific factors to explain leverage for emerging countries firms
Joeveer 2006
Country-specific factors are key determinants of leverage for small and private firms, while industry-specific factors play the same role for publicly-traded firms
Jörgensen and
Terra 2003
Firm-specific factors are the key determinants of leverage for Latin American firms
Booth et al 2001 Institutional factors are at least as relevant as firm-specific factors to explain leverage for emerging countries firms
Source: developed by the author
20
3 Hypotheses and Econometric Models
3.1 Objectives of the Research
Dynamic models are employed in this study to verify that country effects play a key role in determining the capital structure of firms. Rather than looking for macroeconomic or institutional determinants of the leverage levels, we aim at observing how severely results vary across countries due to their idiosyncrasies. The next subsection will further detail our purpose and its implementation.
3.2 The Relevance of Firms’ Country of Origin
We investigate whether and how the estimated results for Brazilian, Chilean and Mexican firms suffer major variations when analyzed across countries. These three countries were chosen given their recent record of relative political and economic stability, which favors firms to devise long run strategies rather than mainly responding to erratic institutional shocks. Moreover, all three belong to the largest economies in the region and exhibit reasonably sophisticated capital markets.
To the extent of our literature review, previous studies do not provide structured and exhaustive comparisons between Latin American countries in terms of institutional and macroeconomic environments. Rather, they identify potential determinants of capital structure and develop reasoning for their employment. Our approach is not to develop such comparison but to examine directly from estimation results whether countries matter for the analysis of capital structure behavior.
21 the dynamic models. Mexico’s free trade agreement with the USA allows its economy to benefit from an anchor of external credibility, whereas all three countries show varied maturity in the decoupling of institutions from the political cycles. Other factors such as investment grade, GDP growth, exchange rates, level of economic freedom and inflation, among others, may account for disturbances in the estimated results.
Chart 3 identifies the dummy variables and interactions employed so as to segregate each country’s contribution to the dependent variables. We define Brazil as the country of reference, therefore dummies are constructed to identify whether a firm is Chilean or Mexican: should both cases be negative, the firm is Brazilian. The interactions are built through the multiplication of each main effect by the country dummies.
Chart 3- Dummy variables and interactions
Variable Rationale
CL equals 1 when the observation is related to a Chilean firm and 0 otherwise
MX equals 1 when the observation is related to a Mexican firm and 0 otherwise
CL_X is an interaction equal to the product of CL and a given variable X
MX_X is an interaction equal to the product of MX and a given variable X
Source: developed by the author
3.3 Partial Adjustment Model and Speed of Adjustment
22 Given that the lagged term y'( in Equation (1) brings forth the issue of
auto-correlation, the Arellano-Bond estimator is employed to address the concerns of dynamic panel estimation. We refer to Dang et al. (2008) for a further discussion regarding the econometric issues. Target leverage derives from πX'(, and, assuming that the exogenous factors contained in are significant, the exclusion of any of them from the specification should reduce the estimated speed of adjustment: the rationale is that the actual target leverage and the one being modeled would differ. Lemmon et al. (2008) mention that such procedure corresponds to adding measurement error to the target leverage, similarly to the experiment performed by Flannery and Rangan (2006) to illustrate the speed reduction due to decreases in the signal to noise ratio of the target estimate.
The selected time-varying factors and their respective expected impacts over leverage are shown in Chart 4.
3.4 Duration Analysis
By analyzing the influence of country factors over the duration of the intervals of time without active rebalancing, we aim at evaluating whether the costly adjustment framework helps explaining the capital structure evolution in the three countries under analysis. Moreover, differing results across countries would indicate that country peculiarities affect the dynamics of costly adjustment, providing additional evidence that country-specific cultural, macroeconomic and institutional factors exert major influence over capital structure decisions.
23 significant change in leverage as an upward or downward net variation of 5% between two consecutive periods.
In order to properly capture the effects of the independent variables, we follow Machado (2009) and perform two independent duration analyses: the first, henceforth named upward duration analysis, estimates the factors that govern the duration of periods of relative inactivity preceding positive net variations greater than 5%; the second analysis, henceforth named downward duration analysis, does the same considering negative net variations greater than 5%. We estimated all regressors lagged by one period since current information is not likely to be available at the occasion of adjustment.
Chart 4- Independent variables employed in the partial adjustment and duration models
Variable Alias Adjustment Partial Duration Upward Downward Duration Rationale
Cash and Near Cash
Items CASH neutral Neutral neutral Leary and Roberts (2005)
Interest
Rate INTEREST – + – Rochman, Eid Junior and Laureano (2009)
Market to Book Ratio MKT2BOOK – + – Flannery and Rangan (2006), Lemmon et al. (2008), Leary and Roberts (2005)
Income Volatility OINCVOL – + – Leary and Roberts (2005)
Profitability PROFIT + – +
Flannery and Rangan (2006), Lemmon et al. (2008), Leary and Roberts (2005)
Size SIZE + – +
Flannery and Rangan (2006), Lemmon et al. (2008), Leary and Roberts (2005)
Tangibility TANG + – + Flannery and Rangan (2006), Lemmon et al. (2008), Leary
and Roberts (2005)
Leverage Level LEV applicable not + – Flannery and Rangan (2006), Lemmon et al. (2008), Leary and Roberts (2005)
Leverage Variation DLEV applicable not + – Leary and Roberts (2005)
Leverage Increase LUP applicable not + – Leary and Roberts (2005)
Source: developed by the author
24 The selected variables and their respective expected impacts over the duration of inactivity periods are shown in Chart 4.
Given that durations are measured within finite windows of time, it may happen that the last observation in a time series occurs before an adjustment. In such situations, henceforth named “right censoring”, the hazard function does not apply and equation (2) has to be implemented allowing the survivor function to be the single contributor to the estimation (COTTRELL; LUCCHETTI, 2008). Censoring dummies (i.e. CENSUP and CENSDOWN) are included in order to handle right censoring. “Left censoring” (e.g. the first observation in a time series occurring before a change of state) is resolved by forcing the measurement of each time series to necessarily start in a given change of state.
Chart 5 - Definition of the dependent and independent variables of the partial adjustment and duration models
Variable Alias Description SOA Duration
Cash and Near Cash CASH Ratio of cash and near cash to total assets Yes Yes
Duration DUR Number of consecutive quarters of leverage inactivity No Yes
Interest Rate INTEREST Basic interest rate in each country Yes Yes
Leverage Level LEV Ratio of total debt to the sum of market value of equity and total debt Yes Yes
Leverage Variation DLEV 1-period difference of leverage level No Yes
Leverage Increase LUP Dummy equal to 1 if previous period’s variation of leverage is positive No Yes
Market to Book Ratio M2BOOK Ratio of market value to book value Yes Yes
Income Volatility OINCVOL Ratio of the 1-period difference of operational income to total assets Yes Yes
Profitability PROFIT Ratio of operational income to total assets Yes Yes
Size SIZE Log of total assets Yes Yes
Tangibility TANG Ratio of fixed assets to total assets Yes Yes
Source: developed by the author
25
3.5 Data and Sample Selection
The dataset is composed of firm-quarter observations of publicly-traded Brazilian, Chilean and Mexican companies obtained from the Bloomberg Professional service database, between the 4th quarter of 1996 and the 2nd quarter of 2010. Interest rates were obtained from daily time series available at Banco Central do Brasil, Banco Central de Chile and Banco de México, matched to the dates of each respective firm-quarter observation. All variables were built according to the definitions of Chart 5.
3.5.1 Panel data for the partial adjustment model
Firm-quarters containing missing data were removed from the original sample, as well as all observations related to financial companies since they are subject to particular accounting considerations.
In order to minimize the impact of outliers to the analyses, we follow Flannery and Rangan (2006), Lemmon et al. (2008) and Dang et al. (2008) and exclude observations at the upper and lower one-percentiles for all firm-specific variables (except for leverage level and variation ). At last, only firm-quarters pertaining to time series exhibiting at least 12 contiguous quarters have been maintained in the database in order to allow the use of dynamic estimators that require lagged instruments.
26
Table 1- Descriptive statistics of the dependent and independent variables used in the estimation of the partial adjustment model
Variable Mean Median Std. Dev. Min Max
Leverage Level 0.31 0.28 0.21 0.00 0.96
Size 7.75 7.70 1.35 2.16 11.76
Tangibility 0.48 0.50 0.20 0.00 0.94
Profitability 0.03 0.02 0.02 -0.15 0.13
Market to Book Ratio 1.68 1.21 5.45 0.28 201.09
Cash and Near Cash 0.10 0.07 0.09 0.00 0.87
Income Volatility 0.15 0.01 7.56 -274.20 266.22
Interest Rate 12.19 11.25 6.95 0.50 42.00
Source: developed by the author
Notes: The first column identifies the variables constructed from financial time series obtained through the Bloomberg Professional service database and the websites of each respective country’s central bank; each of the remaining five columns exhibit a given statistic associated to the variable, respectively mean value, median value, standard deviation, minimum value and maximum value.
3.5.2 Cross-section data for the duration model
The cross-sectional datasets were built from the available panel data. Table 2 summarizes their statistics.
27
Table 2 - Descriptive statistics of the dependent and independent variables used in the estimation of the duration model
Panel A – Upward Adjustments
Variable Mean Median Std. Dev. Min Max
Duration 5.35 3.00 6.48 1.00 42.00
Leverage Level 0.35 0.33 0.19 0.00 0.93
Size 7.87 7.81 1.39 3.14 11.40
Tangibility 0.45 0.47 0.21 0.00 0.89
Profitability 0.02 0.02 0.02 -0.06 0.12
Market to Book Ratio 1.34 1.18 0.61 0.49 7.15
Cash and Near Cash 0.10 0.07 0.09 0.00 0.47
Income Volatility -0.04 0.00 5.56 -125.87 15.69
Interest Rate 11.38 11.25 5.86 0.50 33.14
Leverage Variation 0.01 0.00 0.08 -0.37 0.63
Panel B – Downward Adjustments
Variable Mean Median Std. Dev. Min Max
Duration 4.90 3.00 5.35 1.00 35.00
Leverage Level 0.43 0.41 0.20 0.00 0.96
Size 7.82 7.72 1.34 3.13 11.38
Tangibility 0.45 0.46 0.19 0.00 0.88
Profitability 0.02 0.02 0.02 -0.15 0.12
Market to Book Ratio 1.19 1.08 0.46 0.48 4.82
Cash and Near Cash 0.10 0.08 0.09 0.00 0.50
Income Volatility 0.38 0.04 4.97 -13.44 98.89
Interest Rate 11.74 11.25 6.86 0.50 42.00
Leverage Variation 0.00 -0.01 0.09 -0.28 0.91
Source: developed by the author
Notes: Panel A exhibits statistics of the variables used in the upward adjustments model, Panel B exhibits statistics related to the downward adjustments model. The first column identifies the variables constructed from financial time series obtained through the Bloomberg Professional service database and the websites of each respective country’s central bank; each of the remaining five columns exhibit a given statistic associated to the variable, respectively mean value, median value, standard deviation, minimum value and maximum value.
4 Empirical Results
4.1 Speed of Adjustment
28 variables to observe whether the estimated speeds of adjustment suffer negligible variation, as stated by Lemmon et al. (2008). Column (i) displays the results of the estimation of all the independent variables. Column (ii) displays the results of a model selected through the following process: first, all non-significant interactions were removed and a new estimation performed; then, all non-significant main effects were removed and a new estimation performed; finally, the remaining non-significant variables were removed and the final model estimated. In order to account for the influence of the lagged term over the results, column (iii) displays the output of an estimation containing no independent variables but for LEV, MX_LEV and CL. Columns (iv) and (v) display the results of two new estimations adding SIZE and M2BOOK to model (iii), respectively, as independent variables.
We followed the literature and lagged all regressors by one period to avoid estimating the model with information not available at the occasion of adjustment. The Arellano-Bond test for AR(1) rejects the null hypothesis of no autocorrelation in first differences for all the five sets of variables. However, this is an expected result given the structure of the residuals (MILEVA, 2009). The tests for AR(2) do not reject the hypothesis of no autocorrelation in parameter levels. The Sargan test does not reject the hypothesis that all instruments, jointly, are exogenous whereas the Wald test rejects that the coefficients of the exogenous variables are equal to zero. These results are also found in Table 3.
29
Table 3 - Results of the estimated partial adjustment model
Panel A - Estimated coefficients and p-values
(i) (ii) (iii) (iv) (v)
Est. p-value Est. p-value Est. p-value Est. p-value Est. p-value Speed of
adjustment ( 0.20 0.17 0.16 0.19 0.14
LEV 0.80 <0.01 0.83 <0.01 0.84 <0.01 0.81 <0.01 0.86 <0.01
SIZE -0.11 <0.01 -0.04 <0.01 -0.04 <0.01
TANG 0.06 0.66
PROFIT 0.02 0.94
M2BOOK 0.00 0.01 0.01 <0.01 0.01 <0.01
CASH -0.07 0.32
OINCVOL 0.00 0.91
INTEREST 0.00 0.17
CL_SIZE 0.05 0.08
CL_TANG -0.21 0.16
CL_PROFIT 0.51 0.13
CL_M2BOOK 0.05 0.13
CL_CASH -0.26 0.11
CL_OINCVOL 0.00 0.93
CL_INTEREST 0.00 0.15
MX_SIZE 0.08 0.05
MX_TANG 0.25 0.29
MX_PROFIT 0.16 0.70
MX_M2BOOK 0.01 0.59
MX_CASH 0.11 0.38
MX_OINCVOL 0.00 0.67
MX_INTEREST 0.00 0.75
CL_LEV -0.29 0.06
MX_LEV -0.40 <0.01 -0.56 <0.01 -0.50 <0.01 -0.55 <0.01 -0.51 <0.01
CL 0.00 0.17 -0.004 <0.01 -0.006 <0.01 -0.004 <0.01 -0.006 <0.01
MX 0.00 0.03 0.002 0.03 0.002 0.03
Panel B - Regression statistics and test results
(i) (ii) (iii) (iv) (v)
Sum of Sq.
Errors 20.09 21.60 22.78 21.12 22.30
Std. Error 0.09 0.09 0.09 0.09 0.09
AR(1) -3.07 [<0.01] -3.33 [<0.01] -3.37 [<0.01] -3.11 [<0.01] -3.40 [<0.01]
AR(2) -0.76 [0.45] -0.96 [0.34] -0.86 [0.42] -1.00 [0.32] -0.81 [0.42]
Sargan 118.07 [1.00] 128.44 [0.99] 129.47 [0.99] 125.50 [1.00] 130.38 [0.99]
Wald 631.30 [<0.01] 455.80 [0.00] 553.83 [0.00] 526.92 [<0.01] 543.11 [0.00]
Source: developed by the author
30 Although these findings do not allow us to verify the relatively minor contribution of classical determinants in detriment of time-unvarying, firm-specific factors, we may still suspect about the existence of a permanent component of leverage: given that LEV by large showcases its greatest contribution in explaining future leverage, the role of a long run mean in determining the target capital structure may be implied.
With respect to the relevance of country idiosyncrasies, the negative sign of MX_LEV across the different specifications denotes a large, positive and significant at 95% impact over . Based on this, we may infer that Mexican managers are more avid to close the gap between actual and target leverage than their Brazilian and Chilean counterparts. In fact, this position may be sustained for Brazil since it is considered a country with low levels of equity issuance (ROCHMAN ET AL., 2009) and presents elevated financing costs (MARCON; GRZEBIELUCKAS; BANDEIRA DE MELLO; MULLER, 2007) which would put off firms’ attempts to adjust capital structure. Future research may indicate reasons for the observed behavior of Chilean and Mexican companies.
Additional evidence is provided by the signs of SIZE and M2BOOK, challenging the adherence of Brazilian, Chilean and Mexican publicly traded firms to the trade off theory. Several previous studies point out that pecking order behavior drives the financing decisions of Brazilian firms, a usual explanation being that local legislation makes it less attractive for Brazilian firms to look for external sources of financing than using their own resources (ROCHMAN ET AL., 2009). We suggest that pecking order, market timing and management inertia determinants are inspected among Latin American firms through similar dynamic modeling, thus contributing to elucidate the adherence of firms to other major theories.
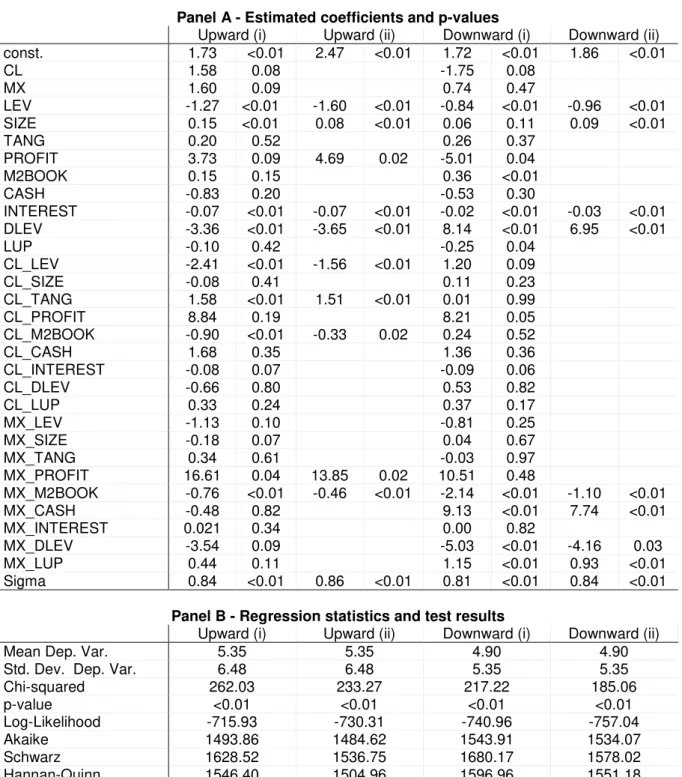
4.2 Duration Analysis
31 display the results of the estimation of all the independent variables. Columns (ii) display the results of models selected through the following process: first, all significant interactions were removed and a new estimation performed; then, all non-significant main effects were removed and a new estimation performed; finally, the remaining non-significant variables were removed and the final model estimated. Since OINCVOL exhibited a high Variance Inflation Factor score, it was removed from estimations to avoid multi-colinearity issues.
DLEV is the sole variable that behaves accordingly to the theory for both models: firms with a recent history of positive or negative buildup of leverage are less likely to perform an adjustment that reinforces their current deviation. The signs of the coefficients for LEV, INTEREST and SIZE in the downward adjustment model meet the expected results within a 95% confidence interval.
32
Table 4 - Results of the estimated duration model
Panel A - Estimated coefficients and p-values
Upward (i) Upward (ii) Downward (i) Downward (ii)
const. 1.73 <0.01 2.47 <0.01 1.72 <0.01 1.86 <0.01
CL 1.58 0.08 -1.75 0.08
MX 1.60 0.09 0.74 0.47
LEV -1.27 <0.01 -1.60 <0.01 -0.84 <0.01 -0.96 <0.01
SIZE 0.15 <0.01 0.08 <0.01 0.06 0.11 0.09 <0.01
TANG 0.20 0.52 0.26 0.37
PROFIT 3.73 0.09 4.69 0.02 -5.01 0.04
M2BOOK 0.15 0.15 0.36 <0.01
CASH -0.83 0.20 -0.53 0.30
INTEREST -0.07 <0.01 -0.07 <0.01 -0.02 <0.01 -0.03 <0.01
DLEV -3.36 <0.01 -3.65 <0.01 8.14 <0.01 6.95 <0.01
LUP -0.10 0.42 -0.25 0.04
CL_LEV -2.41 <0.01 -1.56 <0.01 1.20 0.09
CL_SIZE -0.08 0.41 0.11 0.23
CL_TANG 1.58 <0.01 1.51 <0.01 0.01 0.99
CL_PROFIT 8.84 0.19 8.21 0.05
CL_M2BOOK -0.90 <0.01 -0.33 0.02 0.24 0.52
CL_CASH 1.68 0.35 1.36 0.36
CL_INTEREST -0.08 0.07 -0.09 0.06
CL_DLEV -0.66 0.80 0.53 0.82
CL_LUP 0.33 0.24 0.37 0.17
MX_LEV -1.13 0.10 -0.81 0.25
MX_SIZE -0.18 0.07 0.04 0.67
MX_TANG 0.34 0.61 -0.03 0.97
MX_PROFIT 16.61 0.04 13.85 0.02 10.51 0.48
MX_M2BOOK -0.76 <0.01 -0.46 <0.01 -2.14 <0.01 -1.10 <0.01
MX_CASH -0.48 0.82 9.13 <0.01 7.74 <0.01
MX_INTEREST 0.021 0.34 0.00 0.82
MX_DLEV -3.54 0.09 -5.03 <0.01 -4.16 0.03
MX_LUP 0.44 0.11 1.15 <0.01 0.93 <0.01
Sigma 0.84 <0.01 0.86 <0.01 0.81 <0.01 0.84 <0.01
Panel B - Regression statistics and test results
Upward (i) Upward (ii) Downward (i) Downward (ii)
Mean Dep. Var. 5.35 5.35 4.90 4.90
Std. Dev. Dep. Var. 6.48 6.48 5.35 5.35
Chi-squared 262.03 233.27 217.22 185.06
p-value <0.01 <0.01 <0.01 <0.01
Log-Likelihood -715.93 -730.31 -740.96 -757.04
Akaike 1493.86 1484.62 1543.91 1534.07
Schwarz 1628.52 1536.75 1680.17 1578.02
Hannan-Quinn 1546.40 1504.96 1596.96 1551.18
Observations 569 569 599 599
Robust Errors No No No No
Source: developed by the author
34
5 Conclusion
Our analyses detected that firms exhibit dissimilar rebalancing behavior when compared by country. Results from the partial adjustment model suggest that Mexican managers, in comparison to their Brazilian and Chilean counterparties, put forth more effort to promptly correct leverage levels back to their target ratios. Actually, evidence supporting the trade off behavior of Brazilian, Chilean and Mexican firms is not found and other approaches such as pecking order, market timing or management inertia may apply. This conclusion is in line with Bastos et al. (2009), who point out that unique local characteristics account for a variation of results across different countries and that pecking order is more robust in explaining firms financing decisions in the analyzed countries.
The outcome of the partial adjustment model also shows that classically employed determinants considerably influence the speeds of adjustment. In this, rather than validating the proposition that other factors would predominantly govern target leverage levels, we sustain the conclusion of Copat (2009) that time-varying classical determinants are the key factors behind the capital structure adjustment of Latin American firms towards a target.
Nevertheless, the contribution of past leverage to explaining future states of capital structure may indicate that permanent components stabilize the long run mean and consequently play an important role in determining firms’ optimal leverage. Further investigation is required to identify whether permanent components actually exist and which economic mechanisms lay behind them.
35 were not able to draw reliable conclusions regarding country effects in this analysis and suggest that this discussion be extended through the assessment of costly adjustment by making use of alternative specifications.
In summary, our paper relates findings in favor of the relevance of country idiosyncrasies as determinants of capital structure. We contributed to the efforts of Copat (2009) and Bastos et al. (2009) by further developing the dynamic perspective in the analysis of capital structure divergences across Latin American countries and expect future research to develop novel approaches that expound how institutional, macroeconomic and other country specific factors shape the capital structure of Latin American firms.
36
6 References
Bastos, D., Nakamura, W., & Basso, L. (2009). Determinants of capital structure of publicly traded companies in Latin America: an empirical study considering macroeconomic and institutional factors. Revista de Administração Mackenzie, 10(6)
Booth, L., Aivazian, V., Demirgüç-Kunt, A., & Maksimovic, V. (2001). Capital structure in developing countries. The Journal of Finance, 56(1), 87-130.
Cameron, A. C., & Trivedi, P. K. (2005). Microeconometrics, Methods and Applications. Cambridge University Press.
Cheng, S., & Shiu, C. (2007). Investor protection and capital structure: international evidence. Journal of Multinational Financial Management, 17(1), 30-44.
Copat, R. (2009). Fatores específicos da empresa, do setor e do país: quais deles são os direcionadores-chave da estrutura de capital na América Latina? Unpublished Masters Dissertation, Universidade Federal do Rio Grande do Sul, Porto Alegre, Brazil.
Cottrell, A., & Lucchetti, R. J. (2008). Gretl User’s Guide, Gnu regression, econometrics and time series. http://sourceforge.net/projects/gretl/files/manual/
Dang, V. A., Kim, M., & Shin, Y. (2008). Asymmetries in capital structure adjustments: new evidence from a dynamic panel threshold model. The European Financial Management Association Conference, 1981, Athens, Greece.
Demirgüç-Kunt, A., & Maksimovic, V. (1998). Law, finance and firm growth. The Journal of Finance, 53(6), 2107-2137.
Flannery, M.J., & Rangan, K.P. 2006. Partial adjustment toward target capital structures. Journal of Financial Economics, 79(3), 469-506.
Frank, M. Z., & Goyal, V. K. (2003). Testing the pecking order theory of capital structure. Journal of Financial Economics, 67(2), 217–248.
Hovakimian, A. (2006). Are observed capital structures determined by equity market timing? Journal of Financial and Quantitative Analysis, 41, 221-243
37
Jong, A. de, Kabir, R., & Nguyen, T. (2007). Capital structure around the world: the roles of firm and country specific determinants. European Finance Association Annual Meeting, Oct. 2007, Zurich, Switzerland.
Jörgensen, J., & Terra, P. (2003). Determinants of capital structure in Latin America: the role of firm-specific and macroeconomic factors. Tenth Annual Conference of the Multinational Finance Society, 2003, Montreal, Canada: 1-48.
Kalbfleisch, J. D. & Prentice, R. L. (2002). The Statistical Analysis of Failure Time Data, Wiley, 2nd edition.
Kayo, E.K., & Kimura, H. (2011) (available online Aug. 2010). Hierarchical determinants of capital structure. Journal of Banking & Finance, 35, 358-371.
Kirch, G., Mateus, C., & Terra, P. (2008). The effect of ownership structure, country governance, and financial development on the capital structure of unlisted Eastern European firms. VIII Encontro Brasileiro de Finanças, 2008, Rio de Janeiro, Brazil: 1-59.
Kleinbaum, D., & Klein, M. (2005). Survival Analysis – a self-learning text. Springer Science + Business Media, Inc.
Korajczyk, R., & Levy, A. (2003). Capital structure choice: macroeconomic conditions and financial constraints, Journal of Financial Economics, 68, 75-109.
Leary, M. T., & Roberts, M. R. (2005). Do firms rebalance their capital structures? The Journal of Finance, 60(6), 2575-2619.
Lemmon, M., Roberts, M., & Zender, J. (2008). Back to the beginning: persistence and the cross-section of corporate capital structure. The Journal of Finance, 63(4), 1575–1608.
Machado, G. (2009). Custos de ajustamento e a dinâmica da estrutura de capital em empresas brasileiras. Unpublished Masters Dissertation, Escola de Pos-Graduacao em Economia, Fundacao Getulio Vargas, Rio de Janeiro, Brazil.
Marcon, R., Grzebieluckas, C., Bandeira de Mello, R., & Muller, R. (2007). O comportamento da estrutura de capital e a performance de firmas brasileiras, argentinas e chilenas. Revista de Gestão USP, 14(2), 33-48.
Matsuo, A. K., & Eid Junior, W. (2005). Estrutura de capital no Brasil: uma resenha de estudos no período 1988-2003. Encontro Brasileiro de Finanças, 2005, São Paulo, Brazil.
38
Mitton, T. (2008). Why have debt ratios increased for firms in emerging markets? European Financial Management, 14(1), 127–151.
Modigliani, F., & Miller, M. (1958). The costs of capital, corporation finance, and the theory of investment. The American Economic Review, 48(3), 261-297.
Ozkan, A. (2001). Determinants of capital structure and adjustment to long run target: evidence from UK company panel data. Journal of Business Finance and Accounting, 28, 175-198.
Rocha, F. D. (2007). A estrutura de financiamento das empresas brasileiras de capital aberto: uma avaliação empírica de novas proposições teóricas. Unpublished Masters Dissertation, Centro de Pós-Graduação em Pesquisas em Administração, Universidade Federal de Minas Gerais, Belo Horizonte, Brazil.