Received 31 July, 2013 Accepted 2 Nov., 2013 (006165)
1 Centro de Engenharias e Ciências Exatas, Universidade Estadual do Oeste do Paraná – Unioeste, Toledo, PR, Brasil, e-mail: [email protected] 2 Departamento de Química, Universidade Estadual de Maringá – UEM, Maringá, PR, Brasil
3 Departamento de Zootecnia, Universidade Estadual de Ponta Grossa – UEPG, Ponta Grossa, PR, Brasil *Corresponding author
Incorporation of conjugated linoleic acid (CLA)
and α-linolenic acid (LNA) in pacu fillets
Deoclécio José BARILLI1*, Mayara SANTAROSA2, Ana Beatriz ZANQUI2, Wilson Rogério BOSCOLO1, Aldi FEIDEN1, Wilson Massamitu FURUYA3, Sandra Terezinha Marques GOMES2, Jesuí Vergílio VISENTAINER2,
Nilson Evelázio de SOUZA2, Makoto MATSUSHITA2
1 Introduction
The changes in the eating habits caused by industrialization has led to an increase in the consumption of foods with a high content of omega-6 fatty acids (n-6) and a decrease in the consumption of foods rich in omega-3 fatty acids (n-3). This imbalance in the n-6/n-3 ratio was around 1:1 to 2:1 during the pre-industrialization period, especially due to the consumption of seafood, and it reached values ranging from 10:1 to 20:1 (Simopoulos, 2002). In addition, the balance between the polyunsaturated fatty acids is associated with prevention of coronary heart and cardiovascular disease, rheumatoid arthritis, depression, cancers, diabetes, and anti-inflammatory action (Navarro et al., 2012; Sanderson et al., 2002).
The polyunsaturated fatty acids of the n-3 series, e.g. eicosapentaenoic (EPA, 20:5n-3) and docosahexaenoic (DHA, 22:6n-3), have the essential α-linolenic acid (LNA; 18:3n-3) as their precursor. The fatty acids EPA and DHA are associated with the reduction of risk factors for cardiovascular diseases (Haglund et al., 1998), psoriasis (Mayser et al., 1998) and cancer (Kimura et al., 2001).
Conjugated linoleic acid (CLA) is a term utilized to describe positional and geometric isomers of the linoleic acid (LA 18:2n-6); the two main occurring isomers are 9c, 11t and 10t, 12c. These compounds occur in meat and dairy products from ruminants, but they are also present at lower levels in many other foodstuffs (Chin et al., 1992; Pariza et al., 2001).
Among the health benefits attributed to the CLA, anticarcinogenesis (Ha et al., 1987; Ip et al., 1996), reduction in the development of arteriosclerosis (Chouinard et al., 1999;
Kritchevsky et al., 2004), immunomodulation (Cook & Pariza, 1998), and the capacity to change lipid metabolism in humans (Gaullier et al., 2004) stand out.
The amount of CLA found in foods is small, and their ingestion by humans varies between 0.5-1.0 g/day/person (Chin et al., 1992). Thus, supplementing CLA by consuming foods such as fish is an alternative to increase intake of this acid.
Studies show that dietary fatty acids are transferred to the fish fillets via their diet (Henderson, 1996). Accordingly, the incorporation of linseed oil in fish diet has improved their profile of n-3 fatty acids (Justi et al., 2003; Visentainer et al., 2005).
Similarly, some other studies have demonstrated the possibility of incorporating CLA in fish fillets by feeding them diets based on this acid (Leaver et al., 2006; Santos et al., 2007a, b).
Pacu, a species originated in the rivers that make up the Prata Basin, is farmed mainly in the South and Southeast regions of Brazil. It has a great potential for commercialization and for farming in intensive-culture systems, rusticity, optimal growth rates, and adaptation to artificial feeding (Castagnolli & Cyrino, 1986) in addition to having a very much appreciated meat, of high commercial value. However, like the other tropical-climate fish species, pacu is poor in fatty acids of the n-3 series.
The objective of this study was to evaluate the incorporation of conjugated linoleic acid (CLA) and α-linolenic acid (LNA) in fillets of pacu reared in net cages and fed diets enriched with these acids.
Abstract
The objective of this study was to evaluate the incorporation of conjugated linoleic acid and α-linolenic acid in fillets of pacu fish raised in net cages and fed diets enriched with these acids. The fish were fed for 49 days, and at the end of this period the fatty acid content in the fillets was determined by gas chromatography. Concentrations of α-linolenic acid, eicosapentaenoic acid, and the total omega-3 (n-3) fatty acid in the fillets increased, improving the n-6/n-3 ratio. In addition, the incorporation of conjugated linoleic acid in the fish fillets proved well established. This study showed that the use of diets enriched with conjugated linoleic acid and α-linolenic acid results in the incorporation of these acids in the of pacu fish fillets, improving their nutritional quality.
ln( ) ln( ) 100 final body weight initial body weight SGR
t
−
= ×
(1)
were: t = experimental period (days).
2.3 Total lipid extraction and analysis of fatty acid methyl esters
The total lipids (TL) were extracted by the method of Bligh & Dyer (1959), and the fatty acid methyl esters (FAME) were prepared by methylation of the triacylglycerols, as described by Hartman & Lago (1973).
The FAME were separated using a gas chromatograph (Shimadzu 14A, Japan), equipped with a flame ionization detector (FID) and a fused-silica capillary column (Varian, USA) (CP - 7420 Select FAME; 100 m length, 0.25 internal diameter and 0.25 µm cyanopropyl film). The temperature of the column was set at 165 °C for 18 min, and it was then increased to 180 °C (30 °C/min) for 22 min, and finally to 240 °C (15 °C/min) for 20 min. The temperature of the injector and detector was 260 °C. The gas flows (White Martins) were 1.2 mL/min for the carrier gas (H2); 30 mL/min for the auxiliary gas (N2); and 30 mL/min and 300 mL/min for H2 and the synthetic air flame, respectively. A two microliters injection was performed, and the sample split ratio was 1/50.
The peak areas were determined using Clarity Lite software version 2.4.1.91. The fatty acids were identified by comparing the retention times of the FAME peaks with the corresponding peaks in the standards (Sigma Co., St. Louis, MO, USA). The fatty acids (FA) (mg g–1 TL) were quantified in relation to the
internal standard, methyl tricosanoate (Sigma®), according to Joseph & Ackman (1992) using the following Equation 2:
( ) x IS x
IS x AE
A W CF
FA mg g TL
A W CF
× ×
=
× × (2)
where: Ax is the area of a specific fatty acid; WSI is the weight of the internal standard (mg); CFx is the theoretical correction factor;AIS is the area of the internal standard (PI), Wx is the
2 Materials and methods
2.1 Fish, diet, and management
The experiment was conducted in net cages in the Center for Development of Fish Farming Technologies, located in the tank of the Itaipu Binacional Dam, in the municipality of Santa Helena/PR, Brazil, at coordinates W 54° 21’ and S 24° 51’.
The fish (n = 300; 220 ± 11.45 g initial weight) were divided into 12 net cages in groups of 25 individuals and were subjected to four treatments with six replications each.
All fish were initially acclimated for a period of 30 hours, receiving only Diet A (control). Afterwards, some fish continued to be fed diet A, and the others received diets B (1% LNA), C (1% CLA), and D (0.5% LNA + 0.5% CLA), which were formulated according to Table 1. The fish were fed an extruded commercial diet (8 mm; Supra®, Paraná, Brazil) containing 32% crude protein and 3.062 kcal kg–1 digestible energy; and each
oil was manually poured into the feed and allowed to drain out. The fish were fed amounts corresponding to 2% of the adjusted body weight three times a day (08:00, 13:00 and 17:00 h). Six fish were collected from each net cage at the beginning (time zero) and end of the experiment to evaluate fatty acid incorporation and every seven days (for 49 days) to determine the incorporation profiles of CLA. After each collection, the fish were weighed and the fillets were ground, homogenized, and wrapped in polyethylene bags under nitrogen gas until analyses.
2.2 Chemical composition and specific growth rate
Moisture and ash were determined gravimetrically by oven drying at 105 °C and incineration in a muffle furnace at 600 °C, respectively, according to Cunnif (1998). The crude protein content was obtained by the method of Kjeldahl (Cunnif, 1998) using the 6.25 nitrogen-to-protein conversion factor.
The specific growth rate (SGR) was calculated according to Izquierdo et al. (2005) using Equation 1:
Table 1. Composition (%) of the experimental dietsa.
Ingredients Diets
A B C D
Soybean oil 4.00 2.15 2.33 3.12
Flaxseed oil b 0.00 1.85 0.00 0.46
Supplement LUTA-CLA®60 BASFc 0.00 0.00 1.67 0.42
Proximate composition d
Moisture 7.50 ± 0.01 7.36 ± 0.04 7.64 ± 0.02 7.47 ± 0.02
Crude Protein 32.30 ± 0.38 32.97 ± 0.31 31.92 ± 0.34 32.20 ± 0.33
Total Lipids 8.60 ± 0.30 8.25 ± 0.23 8.55 ± 0.29 8.62 ± 0.28
Ash 10.47 ± 0.01 10.60 ± 0.04 10.56 ± 0.02 10.58 ± 0.04
α-Linolenic Acid 0.00 1.00 0.00 0.50
Conjugated Linoleic Acid 0.00 0.00 1.00 0.50
a Extruded commercial diet (5 mm, Supra®) - safe levels:vit. A = 10,000 IU; vit. D3 = 3,000 IU; vit. E = 800 mg; vit. K3 = 5 mg; vit. B1 = 5 mg; vit. B2 = 10 mg; vit. B6 = 6 mg; vit.
B12 = 12 mcg; folic acid = 1 mg; pantothenic acid = 50 mg; vit. C = 250 mg; biotin = 0.5 mg; choline = 2,000 mg; niacin = 80 mg; Fe = 40 mg; Cu = 20 mg; Mn = 30 mg; Zn = 100 mg; I = 5 mg; and Se = 0.4 mg. b Commercial product containing 54% α-linolenic acid. c Supplement LUTA-CLA® 60 BASF (BASF AG, Ludwigshafen, Germany), containing 60% of conjugated
2.4 Statistical analysis
The results were subjected to variance analysis (ANOVA) at the 5% of significance level, using the software Statistica® 7 (Stat Soft Inc., Tulsa, OK, USA), and the means were compared by the Tukey test.
3 Results and discussion
The fatty acids of the n-3 series are considered essential for freshwater fish, and therefore, they must be acquired through their diet. However, these fish have enzymes able to convert ALA into EPA and DHA fatty acids. Table 3 shows the fatty acid profile of the experimental diets. The presence of CLA isomers in the diets C and D, resulting from the addition of the supplement and flaxseed oil in diets B and D, can be seen when compared to the control diet.
The variation in the chemical composition of the fish may result from some endogenous and exogenous factors, among which are: feeding, environmental factors, and temperature and season of the year (Moreira et al., 2001). The composition (%) of the fillets of pacu fed the experimental diets A, B, C, and D are given in Table 4. The main changes in the initial composition of the fillets were: increase (P<0.05) in the total lipid concentration for the fish fed diet B and consequent reduction in the water content and increase in the crude protein level in the fillets of fish fed diets C and D.
Fountoulaki et al. (2009) and Kennedy et al. (2007) evaluated the fatty acid profiles of gilt-head bream (Sparus aurata L.) and Atlantic cod (Gadus morhua L.) fed commercial diets enriched with vegetable oils, fish oil, and CLA, respectively. Unlike the results obtained in the present study, the authors found no changes in the composition (%) of these fish fillets.
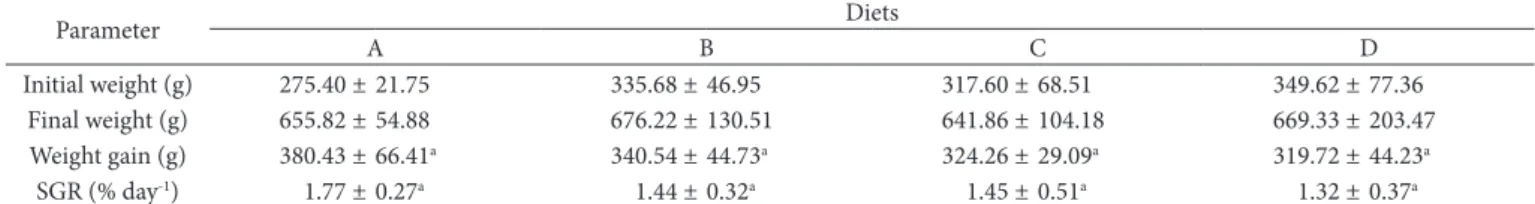
Table 5 shows the weight evolution of and the SGR of the fish in the four treatments. At the end of the experiment (49 days), there were no significant differences (P>0.05) in weight gain or specific growth rate between the fish fed different diets. These results demonstrate that the addition of linseed oil and CLA to the diet did not affect fish growth. However, the experimental diets used in this study provided better SGR than those used by Izquierdo et al. (2005) and Fountoulaki et al. (2009), varying between 0.62-0.68 and 0.75-0.90, for fish fed different vegetable oils.
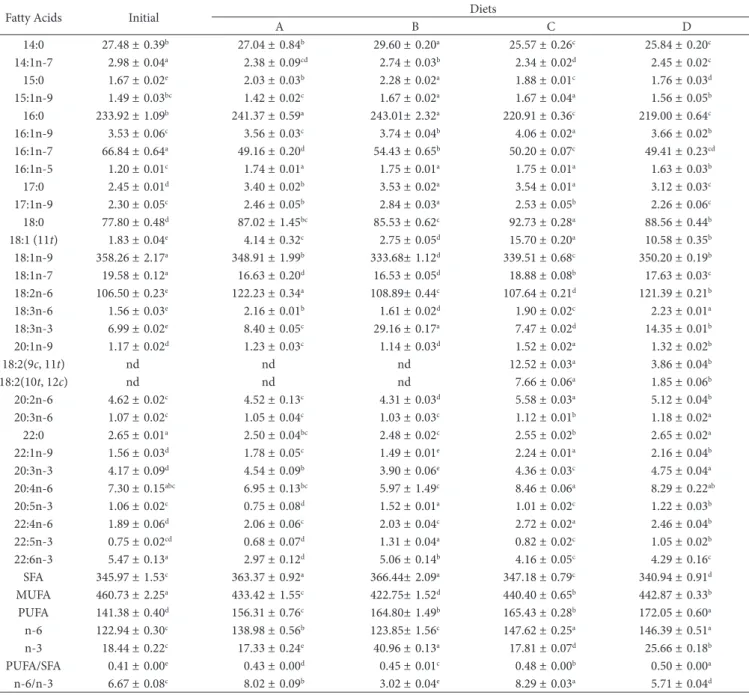
Table 6 presents the fatty acid profile, in mg g–1 of total lipids
(TL), the sums of saturated (SFA), monounsaturated (MUFA), and polyunsaturated (PUFA) fatty acids, omega-6 (n-6) and omega-3 (n-3) series, PUFA/SFA, and n-6/n-3 ratios of pacu fillets fed experimental diets for 49 days.
The main fatty acids found in the fish fillets subjected to the four treatments were oleic acid (18:1 n-9), palmitic acid (16:0), linoleic acid (18:2 n-6), and stearic acid (18:0) accounting for more than 75% of the amount of fatty acids in the fillets. These results are close to those found by Moreira et al. (2001), who studied three species of non-native fish of the genus Brycon (reared in cages) and Brycon (native) captured in the rivers of the Prata Basin.
weight of the sample (g); and CFAE is the conversion factor of methyl ester to fatty acid.
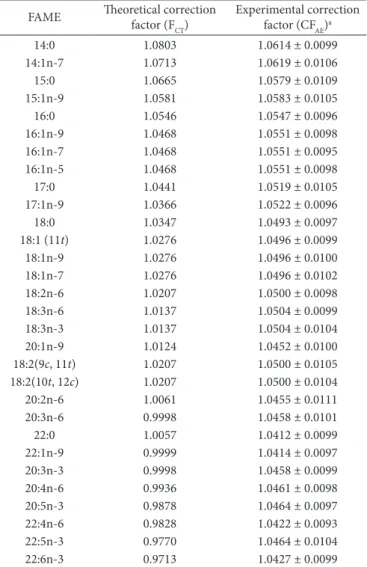
The experimental correction factor (CFAE) of the flame ionization detector was determined according to Visentainer & Franco (2006) using a standard mixture solution of fatty acid methyl esters (189-19 Sigma) at known concentrations, including the internal standard methyl tricosanoate (23:0). The factors were calculated using Equation 3 and the average of 4 repetitions, as shown in Table 2.
IS x AE
x IS
A W
CF
A W
× =
× (3)
where: AIS = area of the internal standard; WSI = weight of the internal standard; Ax = area of the specific fatty acid, and Wx = weight of the specific fatty acid.
The limit of detection (LOD) and limit of quantification (LOQ) were estimated by triplicate analysis of successively diluted methyl arachidate standard solution (1.0 mg.mL–1) considering
the signal-to-noise ratio relative to the background signal as 3 and 10, respectively (Analytical Methods Committee, 1987).
Table 2. Experimental and theoretical response factors for the internal standard methyl tricosanoate (23:0).
FAME Theoretical correction factor (F
CT)
Experimental correction factor (CFAE)a
14:0 1.0803 1.0614 ± 0.0099
14:1n-7 1.0713 1.0619 ± 0.0106
15:0 1.0665 1.0579 ± 0.0109
15:1n-9 1.0581 1.0583 ± 0.0105
16:0 1.0546 1.0547 ± 0.0096
16:1n-9 1.0468 1.0551 ± 0.0098
16:1n-7 1.0468 1.0551 ± 0.0095
16:1n-5 1.0468 1.0551 ± 0.0098
17:0 1.0441 1.0519 ± 0.0105
17:1n-9 1.0366 1.0522 ± 0.0096
18:0 1.0347 1.0493 ± 0.0097
18:1 (11t) 1.0276 1.0496 ± 0.0099
18:1n-9 1.0276 1.0496 ± 0.0100
18:1n-7 1.0276 1.0496 ± 0.0102
18:2n-6 1.0207 1.0500 ± 0.0098
18:3n-6 1.0137 1.0504 ± 0.0099
18:3n-3 1.0137 1.0504 ± 0.0104
20:1n-9 1.0124 1.0452 ± 0.0100
18:2(9c, 11t) 1.0207 1.0500 ± 0.0105 18:2(10t, 12c) 1.0207 1.0500 ± 0.0104
20:2n-6 1.0061 1.0455 ± 0.0111
20:3n-6 0.9998 1.0458 ± 0.0101
22:0 1.0057 1.0412 ± 0.0099
22:1n-9 0.9999 1.0414 ± 0.0097
20:3n-3 0.9998 1.0458 ± 0.0099
20:4n-6 0.9936 1.0461 ± 0.0098
20:5n-3 0.9878 1.0464 ± 0.0097
22:4n-6 0.9828 1.0422 ± 0.0093
22:5n-3 0.9770 1.0464 ± 0.0104
22:6n-3 0.9713 1.0427 ± 0.0099
Table 3. Fatty acid profile (mg g–1 of total lipids) of the experimental diets.
Fatty acids Diets
A B C D
14:0 7.98 ± 0.09ab 8.54 ± 0.37b 7.24 ± 0.38a 6.79 ± 0.11a
14:1n-7 0.88 ± 0.03 0.97 ± 0.02 0.98 ± 0.04 0.94 ± 0.01
15:0 1.84 ± 0.08ab 2.02 ± 0.05b 1.77 ± 0.06ab 1.67 ± 0.01a
15:1n-9 0.74 ± 0.02 0.77 ± 0.03 0.75 ± 0.01 0.70 ± 0.00
16:0 170.76 ± 7.36 150.90 ± 5.86 162.16 ± 3.67 161.07 ± 0.88
16:1n-9 1.53 ± 0.08a 1.85 ± 0.03b 1.64 ± 0.07ab 1.61 ± 0.02ab
16:1n-7 11.15 ± 0.30ab 12.23 ± 0.50b 11.15 ± 0.27ab 10.73 ± 0.07a
16:1n-5 1.65 ± 0.08a 1.38 ± 0.05b 1.80 ± 0.02a 1.68 ± 0.01a
17:0 3.91 ± 0.19ab 3.50 ± 0.07a 4.27 ± 0.06b 3.94 ± 0.10ab
17:1n-9 1.29 ± 0.02 1.27 ± 0.04 1.32 ± 0.08 1.17 ± 0.04
18:0 69.81 ± 3.34ab 63.75 ± 2.79a 80.15 ± 0.75c 77.25 ± 0.15bc
18:1 (11t) 5.62 ± 0.73ab 4.57 ± 0.12a 5.41 ± 0.13ab 7.01 ± 0.05b
18:1n-9 259.20 ± 11.39ab 239.49 ± 4.50a 278.84 ± 2.33b 265.35 ± 1.00ab
18:1n-7 9.40 ± 0.35ab 8.79 ± 0.17b 9.82 ± 0.20a 9.82 ± 0.11a
18:2n-6 348.18 ± 23.82c 279.96 ± 2.59ab 245.08 ± 1.25a 300.90 ± 0.36bc
18:3n-6 0.92 ± 0.11a 0.78 ± 0.03a 0.34 ± 0.01b 0.70 ± 0.00a
18:3n-3 27.73 ± 1.34a 148.64 ± 5.66c 15.97 ± 0.09a 50.02 ± 0.16b
20:1n-9 4.51 ± 0.33b 1.84 ± 0.06a 2.11 ± 0.09a 2.23 ± 0.04a
18:2 (9c, 11t) nd nd 57.35 ± 0.72b 15.25 ± 0.12a
18:2 (10t, 12c) nd nd 55.83 ± 0.67b 14.48 ± 0.04a
20:2n-6 1.97 ± 0.05a 1.36 ± 0.05b 2.06 ± 0.02a 2.01 ± 0.02a
20:3n-6 4.43 ± 0.24b 0.49 ± 0.02a 0.41 ± 0.02a 0.43 ± 0.01a
22:0 3.88 ± 0.14 nd nd nd
22:1n-9 2.07 ± 0.09b 0.47 ± 0.02a 0.36 ± 0.01a 0.38 ± 0.00a
20:3n-3 1.96 ± 0.27b 1.97 ± 0.05b 1.30 ± 0.01a 1.26 ± 0.01a
20:4n-6 1.63 ± 0.08c 1.13 ± 0.03a 1.48 ± 0.03bc 1.31 ± 0.03ab
20:5n-3 nd 0.74 ± 0.02b 0.35 ± 0.01a 0.35 ± 0.01a
SFA 258.18 ± 4.03a 228.69 ± 7.83b 255.59 ± 3.50a 250.72 ± 1.21a
MUFA 298.04 ± 11.52ab 273.64 ± 3.71a 314.19 ± 2.32b 301.61 ± 0.97ab
PUFA 386.82 ± 22.67ab 435.07 ± 7.60b 380.17 ± 2.54a 386.69 ± 0.56ab
n-6 357.13 ± 23.68a 283.72 ± 2.56b 362.55 ± 2.45a 335.07 ± 0.51ab
n-3 34.13 ± 1.73b 151.84 ± 5.68d 18.03 ± 0.11a 52.05 ± 0.15c
PUFA/SFA 1.50 ± 0.07a 1.91 ± 0.07b 1.49 ± 0.03a 1.54 ± 0.01a
n-6/n-3 10.56 ± 1.11c 1.87 ± 0.06a 20.11 ± 0.05d 6.44 ± 0.02b
Means followed by different letters in the same row are significantly different (P<0.05) according to the Tukey test; Means ± standard deviation (n = 6); SFA = total saturated fatty acids; MUFA = total monounsaturated fatty acids; PUFA = total polyunsaturated fatty acids; n-6 = total n-6 fatty acids; n-3 = total n-3 fatty acids; nd = not detected (detection limit = 0.015 mg g–1).
Table 4. Composition (%) of the fillets of fish fed the experimental diets.
Analysis Initial Diets
A B C D
Moisture 72.31 ± 0.12a 71.97 ± 0.18a 69.48 ± 0.14c 72.61 ± 0.30a 70.72 ± 0.55b
Crude Protein 15.92 ± 0.33b 15.22 ± 0.03c 17.17 ± 0.19a 15.27 ± 0.12c 17.37 ± 0.16a
Lipids Total 9.78 ± 2.0b 10.22 ± 0.25b 10.88 ± 0.15a 9.89 ± 0.09b 9.99 ± 0.11b
Ash 1.20 ± 0.4a 1.07 ± 0.01c 1.08 ± 0.04bc 1.15 ± 0.04abc 1.17 ± 0.04ab Means followed by different letters in the same row are significantly different (P<0.05) according to the Tukey test; means ± standard deviation (n = 6).
Table 5. Initial and final weight, weight gain, and specific growth rate of the fish fed experimental diets for 49 days.
Parameter Diets
A B C D
Initial weight (g) 275.40 ± 21.75 335.68 ± 46.95 317.60 ± 68.51 349.62 ± 77.36 Final weight (g) 655.82 ± 54.88 676.22 ± 130.51 641.86 ± 104.18 669.33 ± 203.47 Weight gain (g) 380.43 ± 66.41a 340.54 ± 44.73a 324.26 ± 29.09a 319.72 ± 44.23a
SGR (% day-1) 1.77 ± 0.27a 1.44 ± 0.32a 1.45 ± 0.51a 1.32 ± 0.37a
n-6/n-3 ratios of the fillets of fish fed diets B, C and D reached the recommended values (Table 4).
An increase (P<0.05) in the concentration of LNA was observed in the fish fillets fed diet A in relation to time zero. The fish fed the diet enriched with linseed oil (diet B) had an increase of 317% in the concentration of LNA, rising from 6.99 to 29.16 mg g–1 TL after 49 days. In the fish fillets fed diet D, in
which 0.5% LNA and 0.5% CLA were added, the concentration of LNA by the end of the experiment was 14.35 mg g–1 TL,
which corresponds to an increase of 105% in relation to time zero. These results prove that the composition of the diets used in the present study directly influenced the composition of the fish fillets.
Diets A and B resulted in an increase (P<0.05) in the total SFA in the fillets in relation to the beginning of the experiment. Regarding the amount of PUFA, there was an increase (P<0.05) in all diets, but it was highest in the fish fillets fed diet D. Justi et al. (2003) found no difference in the SFA and PUFA concentrations in fillets of Nile Tilapia (Oreochromis niloticus) fed a diet supplemented with linseed.
The PUFA/SFA and n-6/n-3 ratios can be used as parameters to indicate whether a given food is healthy. According to The Health (1994) recommendations, the values for PUFA/SFA should be above 0.45 Martin et al. (2006) and Simopoulos (2008), state that the ratio may vary between 2-4/1 according to the disease in question. In the present study, the PUFA/SFA and
Table 6. Fatty acid profile (mg g–1 of total lipids) in fillets of pacu fed experimental diets after 49 days.
Fatty Acids Initial Diets
A B C D
14:0 27.48 ± 0.39b 27.04 ± 0.84b 29.60 ± 0.20a 25.57 ± 0.26c 25.84 ± 0.20c
14:1n-7 2.98 ± 0.04a 2.38 ± 0.09cd 2.74 ± 0.03b 2.34 ± 0.02d 2.45 ± 0.02c
15:0 1.67 ± 0.02e 2.03 ± 0.03b 2.28 ± 0.02a 1.88 ± 0.01c 1.76 ± 0.03d
15:1n-9 1.49 ± 0.03bc 1.42 ± 0.02c 1.67 ± 0.02a 1.67 ± 0.04a 1.56 ± 0.05b
16:0 233.92 ± 1.09b 241.37 ± 0.59a 243.01± 2.32a 220.91 ± 0.36c 219.00 ± 0.64c
16:1n-9 3.53 ± 0.06c 3.56 ± 0.03c 3.74 ± 0.04b 4.06 ± 0.02a 3.66 ± 0.02b
16:1n-7 66.84 ± 0.64a 49.16 ± 0.20d 54.43 ± 0.65b 50.20 ± 0.07c 49.41 ± 0.23cd
16:1n-5 1.20 ± 0.01c 1.74 ± 0.01a 1.75 ± 0.01a 1.75 ± 0.01a 1.63 ± 0.03b
17:0 2.45 ± 0.01d 3.40 ± 0.02b 3.53 ± 0.02a 3.54 ± 0.01a 3.12 ± 0.03c
17:1n-9 2.30 ± 0.05c 2.46 ± 0.05b 2.84 ± 0.03a 2.53 ± 0.05b 2.26 ± 0.06c
18:0 77.80 ± 0.48d 87.02 ± 1.45bc 85.53 ± 0.62c 92.73 ± 0.28a 88.56 ± 0.44b
18:1 (11t) 1.83 ± 0.04e 4.14 ± 0.32c 2.75 ± 0.05d 15.70 ± 0.20a 10.58 ± 0.35b
18:1n-9 358.26 ± 2.17a 348.91 ± 1.99b 333.68± 1.12d 339.51 ± 0.68c 350.20 ± 0.19b
18:1n-7 19.58 ± 0.12a 16.63 ± 0.20d 16.53 ± 0.05d 18.88 ± 0.08b 17.63 ± 0.03c
18:2n-6 106.50 ± 0.23e 122.23 ± 0.34a 108.89± 0.44c 107.64 ± 0.21d 121.39 ± 0.21b
18:3n-6 1.56 ± 0.03e 2.16 ± 0.01b 1.61 ± 0.02d 1.90 ± 0.02c 2.23 ± 0.01a
18:3n-3 6.99 ± 0.02e 8.40 ± 0.05c 29.16 ± 0.17a 7.47 ± 0.02d 14.35 ± 0.01b
20:1n-9 1.17 ± 0.02d 1.23 ± 0.03c 1.14 ± 0.03d 1.52 ± 0.02a 1.32 ± 0.02b
18:2(9c, 11t) nd nd nd 12.52 ± 0.03a 3.86 ± 0.04b
18:2(10t, 12c) nd nd nd 7.66 ± 0.06a 1.85 ± 0.06b
20:2n-6 4.62 ± 0.02c 4.52 ± 0.13c 4.31 ± 0.03d 5.58 ± 0.03a 5.12 ± 0.04b
20:3n-6 1.07 ± 0.02c 1.05 ± 0.04c 1.03 ± 0.03c 1.12 ± 0.01b 1.18 ± 0.02a
22:0 2.65 ± 0.01a 2.50 ± 0.04bc 2.48 ± 0.02c 2.55 ± 0.02b 2.65 ± 0.02a
22:1n-9 1.56 ± 0.03d 1.78 ± 0.05c 1.49 ± 0.01e 2.24 ± 0.01a 2.16 ± 0.04b
20:3n-3 4.17 ± 0.09d 4.54 ± 0.09b 3.90 ± 0.06e 4.36 ± 0.03c 4.75 ± 0.04a
20:4n-6 7.30 ± 0.15abc 6.95 ± 0.13bc 5.97 ± 1.49c 8.46 ± 0.06a 8.29 ± 0.22ab
20:5n-3 1.06 ± 0.02c 0.75 ± 0.08d 1.52 ± 0.01a 1.01 ± 0.02c 1.22 ± 0.03b
22:4n-6 1.89 ± 0.06d 2.06 ± 0.06c 2.03 ± 0.04c 2.72 ± 0.02a 2.46 ± 0.04b
22:5n-3 0.75 ± 0.02cd 0.68 ± 0.07d 1.31 ± 0.04a 0.82 ± 0.02c 1.05 ± 0.02b
22:6n-3 5.47 ± 0.13a 2.97 ± 0.12d 5.06 ± 0.14b 4.16 ± 0.05c 4.29 ± 0.16c
SFA 345.97 ± 1.53c 363.37 ± 0.92a 366.44± 2.09a 347.18 ± 0.79c 340.94 ± 0.91d
MUFA 460.73 ± 2.25a 433.42 ± 1.55c 422.75± 1.52d 440.40 ± 0.65b 442.87 ± 0.33b
PUFA 141.38 ± 0.40d 156.31 ± 0.76c 164.80± 1.49b 165.43 ± 0.28b 172.05 ± 0.60a
n-6 122.94 ± 0.30c 138.98 ± 0.56b 123.85± 1.56c 147.62 ± 0.25a 146.39 ± 0.51a
n-3 18.44 ± 0.22c 17.33 ± 0.24e 40.96 ± 0.13a 17.81 ± 0.07d 25.66 ± 0.18b
PUFA/SFA 0.41 ± 0.00e 0.43 ± 0.00d 0.45 ± 0.01c 0.48 ± 0.00b 0.50 ± 0.00a
secretion into circulating blood stream. Twibell et al. (2000) suggested that the DHA is “captured” by the fish liver, and thus its amount in the muscles is reduced, which would explain such decrease. Moreover, DHA is one of the major components of brain and retinal cell membranes, playing an important role in the formation and operation of these organs (Lauritzen, 2001).
Figure 1 shows the profile of the incorporation of isomers 9c, 11t and 10t, 12c, and the total CLA (sum of the two isomers) in the fish fillets fed diets C and D and collected every 7 days.
The supplementation of CLA in diets C and D resulted in a significant increase (P<0.05) in the concentrations of isomers 9c, 11t and 10t, 12c, and total CLA in the fillets. The concentrations of total CLA at the end of the study were 20.18 mg g–1 (diet C) and 5.71 mg g–1 (diet D); for the isomers
9c, 11t and 10t, 12c, they were 12.52 and 7.66 mg g–1 (diet C)
and 3.86 and 1.85 mg g–1 (diet D), respectively. The difference
in the incorporation of the isomers is due to the fact that 9c, 11t is better incorporated into the lipid fractions (Yu et al., 1998), whereas 10t, 12c is related to energy metabolism (Pariza et al., 2001). The concentrations of CLA found in the muscle of Striped bass was 73.0 mg g–1 (Twibell et al., 2000); 19.0 mg g–1
in codfish fingerlings (Kennedy et al., 2007); and 35.8 mg g–1 in
the muscle of pacu (Santos et al., 2009). These results indicate that the ability of fish to accumulate CLA varies according to the species; a consequence of differences in energy, metabolism, or diet composition (Santos et al., 2007b).
4 Conclusion
Fish adapt to cultivation in net cages, and the diets utilized were well accepted and did not affect their growth. The LNA present in the diet resulted in the incorporation of this acid in the fillets of P. mesopotamicus, increasing the EPA content and reducing the n-6/n-3 ratio. However, the DHA contents did not change. P. mesopotamicus also demonstrated CLA-incorporation ability. These results contributed to an improvement in the nutritional quality of the meat of this fish.
These results can be compared to those obtained by Justi et al. (2003) in a study conducted with Nile Tilapia, in which the authors used diets enriched with 3.75% linseed oil and also verified an increase of 290% in the concentration of LNA in the fillets.
The concentration of EPA in the fish fillets fed diet A was lower compared with that at the beginning of the experiment due to the presence of PUFA n-6 in the diet. With regard to the fish fed diet C, no significant variation was observed in the concentration of EPA after 49 days. As for the fish fed diets B and D, there was an increase (P<0.05) in the concentration of EPA in the fillets with variations from 1.06 mg g–1 TL (time zero) to
1.52 and 1.22 mg g–1 TL, respectively. This increase is mainly due
to the incorporation of LNA and subsequent conversion to EPA by the process of elongation and desaturation, which proves the capacity of the pacu to perform this process. This is a desirable outcome since EPA is especially related to the protection of the cardiovascular health (Haglund et al., 1998), given that the eicosanoids derived from this acid have anti-inflammatory, antithrombotic, anti-arrhythmic, and vasodilatory properties.
The fatty acids of the n-3 family, especially EPA and DHA, are found in high concentrations in marine fish. Visentainer et al. (2000) determined the concentration of these fatty acids in some species of marine fish of the Brazilian coast. The observed values ranged between 94.8-186.8 mg g–1
for EPA and 137.7-165.0 mg g–1 for DHA for the tuna, bonito,
and sardine species.
The DHA concentrations in the fish fillets found at the end of the experiment were lower (P<0.05) in all diets in relation to the value determined initially (Table 6), different from the results of Zanqui et al. (2013) and Santos et al. (2007a), who did not observe reduction in the DHA levels in fish fillets fed diets containing CLA.
The liver is considered the primary site for biosynthesis of DHA, which becomes available for uptake and subsequent
acids. Archiv für Tierernaehrung, 49(1), 5-22. http://dx.doi. org/10.1080/17450399609381859
Ip, C., Briggs, S. P., Haegele, A. D., Thompson, H. J., Storkson, J., & Scimeca, J. A. (1996). The efficacy of conjugated linoleic acid in mammary cancer prevention is independent of the level or type of fat in the diet. Carcinogenesis, 17(5), 1045-50. PMid:8640911. http:// dx.doi.org/10.1093/carcin/17.5.1045
Izquierdo, M. S., Montero, D., Robaina, L., Caballero, M. J., Rosenlund, G., & Ginés, R. (2005). Alterations in fillet fatty acid profile and flesh quality in gilthead seabream (Sparus aurata) fed vegetable oils for a long term period. Recovery of fatty acid profiles by fish oil feeding. Aquaculture, 250(1-2), 431-44. http://dx.doi.org/10.1016/j. aquaculture.2004.12.001
Joseph, J. D., & Ackman, R. G. (1992). Capillary column gas-chromatographic method for analysis of encapsulated fish oils and fish ethyl-esters - colaborative study. Journal of Aoac International, 75(3), 488-506.
Justi, K. C., Hayashi, C., Visentainer, J. V., De Souza, N. E., & Matsushita, M. (2003). The influence of feed supply time on the fatty acid profile of Nile tilapia (Oreochromis niloticus) fed on a diet enriched with n-3 fatty acids. Food Chemistry, 80(4), 489-93. http://dx.doi.org/10.1016/ S0308-8146(02)00317-5
Kennedy, S. R., Bickerdike, R., Berge, R. K., Porter, A. R., & Tocher, D. R. (2007). Influence of dietary conjugated linoleic acid (CLA) and tetradecylthioacetic acid (TTA) on growth, lipid composition and key enzymes of fatty acid oxidation in liver and muscle of Atlantic cod (Gadus morhua L.). Aquaculture, 264(1-4), 372-82. http:// dx.doi.org/10.1016/j.aquaculture.2007.01.013
Kimura, Y., Takaku, T., Nakajima, S., & Okuda, H. (2001). Effects of carp and tuna oils on 5-fluorouracil-induced antitumor activity and side effects in sarcoma 180-bearing mice. Lipids, 36(4), 353-9. PMid:11383685. http://dx.doi.org/10.1007/s11745-001-0727-3 Kritchevsky, D., Tepper, S. A., Wright, S., Czarnecki, S. K., Wilson, T.
A., & Nicolosi, R. J. (2004). Conjugated linoleic acid isomer effects in atherosclerosis: Growth and regression of lesions. Lipids, 39(7), 611-6. PMid:15588017. http://dx.doi.org/10.1007/s11745-004-1273-8 Lauritzen, L. (2001). The essentiality of long chain n-3 fatty acids
in relation to development and function of the brain and retina. Progress in Lipid Research, 40(1-2), 1-94. http://dx.doi.org/10.1016/ S0163-7827(00)00017-5
Leaver, M. J., Tocher, D. R., Obach, A., Jensen, L., Henderson, R. J., Porter, A. R., & Krey, G. (2006). Effect of dietary conjugated linoleic acid (CLA) on lipid composition, metabolism and gene expression in Atlantic salmon (Salmo salar) tissues. Comparative biochemistry and physiology Part A, Molecular & integrative physiology, 145(2), 258-67. PMid:16904357. http://dx.doi.org/10.1016/j.cbpa.2006.06.034 Martin, C. A., Almeida, V. V., Ruiz, M. R., Visentainer, J. E. L.,
Matshushita, M., Souza, N. E., & Visentainer, J. V. (2006). Ácidos graxos poliinsaturados ômega-3 e ômega-6: importância e ocorrência em alimentos. Revista de Nutrição, 19. http://dx.doi. org/10.1590/S1415-52732006000600011
Mayser, P., Mrowietz, U., Arenberger, P., Bartak, P., Buchvald, J., Christophers, E., Jablonska, S., Salmhofer, W., Schill, W. B., Krämer, H. J., Schlotzer, E., Mayer, K., Seeger, W., & Grimminger, F. (1998). Omega-3 Fatty acid-based lipid infusion in patients with chronic plaque psoriasis: Results of a double-blind, randomized, placebo-controlled, multicenter trial. Journal of the American Academy of Dermatology, 38(4), 539-47. http://dx.doi.org/10.1016/S0190-9622(98)70114-8
Moreira, A. B., Visentainer, J. V., De Souza, N. E., & Matsushita, M. (2001). Fatty acids profile and cholesterol contents of three Brazilian
Acknowledgements
The authors thank the Group of Studies of Management in Fish Farming (Grupo de Estudos de Manejo na Aquicultura - GEMAq, Unioeste), Itaipu Binacional and the National Council for Scientific and Technological Development (Conselho Nacional de Desenvolvimento Científico e Tecnológico - CNPq) for the financial support.
References
Analytical Methods Committee (1987). Recommendations for the definition, estimation and use of the detection limit. Analyst, 112(2), 199-204. http://dx.doi.org/10.1039/an9871200199
Bligh, E. G., & Dyer, W. J. (1959). A rapid method of total lipid extraction and purification. Biochemistry and Cell Biology, 37(8), 911-7.
Castagnolli, N., & Cyrino, J. E. P. (1986). Piscicultura nos Trópicos. São Paulo: Manole.
Chin, S. F., Liu, W., Storkson, J. M., Ha, Y. L., & Pariza, M. W. (1992). Dietary sources of conjugated dienoic isomers of linoleic acid, a newly recognized class of anticarcinogens. Journal of Food Composition and Analysis, 5(3), 185-97. http://dx.doi. org/10.1016/0889-1575(92)90037-K
Chouinard, P. Y., Corneau, L., Saebø, A., & Bauman, D. E. (1999). Milk yield and composition during abomasal infusion of conjugated linoleic acids in dairy cows. Journal of Dairy Science, 82(12), 2737-45. http://dx.doi.org/10.3168/jds.S0022-0302(99)75530-X Cook, M. E., & Pariza, M. (1998). The Role of Conjugated Linoleic
Acid (CLA) in Health. International Dairy Journal, 8(5-6), 459-62. http://dx.doi.org/10.1016/S0958-6946(98)00069-7
Cunnif, P. A. (1998). Official methods of Analysis of AOAC international (16th ed.). Arlington: AOAC.
Fountoulaki, E., Vasilaki, A., Hurtado, R., Grigorakis, K., Karacostas, I., Nengas, I., Rigos, G., Kotzamanis, Y., Venou, B., & Alexis, M. N. (2009). Fish oil substitution by vegetable oils in commercial diets for gilthead sea bream (Sparus aurata L.); effects on growth performance, flesh quality and fillet fatty acid profile. Aquaculture, 289(3-4), 317-26. http://dx.doi.org/10.1016/j.aquaculture.2009.01.023
Gaullier, J. M., Halse, J., Hoye, K., Kristiansen, K., Fagertun, H., Vik, H., & Gudmundsen, O. (2004). Conjugated linoleic acid supplementation for 1 y reduces body fat mass in healthy overweight humans. American Journal of Clinical Nutrition, 79(6), 1118-25. PMid:15159244.
Ha, Y. L., Grimm, N. K., & Pariza, M. W. (1987). Anticarcinogens from fried ground beef: heat-altered derivatives of linoleic acid. Carcinogenesis, 8(12), 1881-7. PMid:3119246. http://dx.doi. org/10.1093/carcin/8.12.1881
Haglund, O., Wallin, R., Wretling, S., Hultberg, B., & Saldeen, T. (1998). Effects of fish oil alone and combined with long chain (n-6) fatty acids on some coronary risk factors in male subjects. Journal of Nutritional Biochemistry, 9(11), 629-35. http://dx.doi.org/10.1016/ S0955-2863(98)00065-5
Hartman, L., & Lago, R. C. (1973). Rapid preparation of fatty acid methyl esters from lipids. Laboratory practice, 22(6), 475-6 passim. PMid:4727126.
Health, D. (1994). Report on Health and Social Subjects nº 46. Nutritional Aspects of Cardiovascular Disease. London: HMSO.
Simopoulos, A. P. (2002). Omega-3 fatty acids in wild plants, nuts and seeds. Asia Pacific Journal of Clinical Nutrition, 11, S163-S73. http:// dx.doi.org/10.1046/j.1440-6047.11.s.6.5.x
Simopoulos, A. P. (2008). The Importance of the Omega-6/Omega-3 Fatty Acid Ratio in Cardiovascular Disease and Other Chronic Diseases. Experimental Biology and Medicine, 233(6), 674-88. PMid:18408140. http://dx.doi.org/10.3181/0711-MR-311
Twibell, R. G., Watkins, B. A., Rogers, L., & Brown, P. B. (2000). Effects of dietary conjugated linoleic acids on hepatic and muscle lipids in hybrid striped bass. Lipids, 35(2), 155-61. PMid:10757546. http:// dx.doi.org/10.1007/BF02664765
Visentainer, J. V., Carvalho, P. O., Ikegaki, M., & Park, Y. K. (2000). Concentração de ácido eicosapentaenóico (EPA) e ácido docosahexaenóico (DHA) em peixes marinhos da costa brasileira. Ciência e Tecnologia de Alimentos, 20(1), 90-3. http://dx.doi. org/10.1590/S0101-20612000000100017
Visentainer, J. V., De Souza, N. E., Makoto, M., Hayashi, C., & Franco, M. R. B. (2005). Influence of diets enriched with flaxseed oil on the alpha-linolenic, eicosapentaenoic and docosahexaenoic fatty acid in Nile tilapia (Oreochromis niloticus). Food Chemistry, 90(4), 557-60. http://dx.doi.org/10.1016/j.foodchem.2004.05.016
Visentainer, J. V., & Franco, M. R. B. (2006). Ácidos graxos em óleos e gorduras: identificação e quantificação. Varela.
Yu, L., Donkin, S. S., & Watkins, B. A. (1998). CLA reduced arachidonic acid formation in primary cultures of rat hepatocytes. FASEB Journal, 12(4), A535.
Zanqui, A. B., Maruyama, S. A., Barilli, D. J., Ribeiro, S. A. O., Gomes, S. T. M., Visentainer, J. V., Souza, N. E., Boscolo, W. R., & Matsushita, M. (2013). Incorporation of conjugated linoleic and alpha linolenic fatty acids into Pimedolus maculatus fillets. Food Science and Technology (Campinas), 33(3), 532-40. http://dx.doi.org/10.1590/ S0101-20612013005000066
Brycon freshwater fishes. Journal of Food Composition and Analysis, 14(6), 565-74. http://dx.doi.org/10.1006/jfca.2001.1025
Navarro, R. D., Silva Pereira Navarro, F. K., Ribeiro Filho, O. P., Ferreira, W. M., Pereira, M. M., & Seixas Filho, J. T. (2012). Quality of polyunsaturated fatty acids in Nile tilapias (Oreochromis niloticus) fed with vitamin E supplementation. Food Chemistry, 134(1), 215-8. http://dx.doi.org/10.1016/j.foodchem.2012.02.097
Pariza, M. W., Park, Y., & Cook, M. E. (2001). The biologically active isomers of conjugated linoleic acid. Progress in Lipid Research, 40(4), 283-98. http://dx.doi.org/10.1016/S0163-7827(01)00008-X Sanderson, P., Finnegan, Y. E., Williams, C. M., Calder, P. C., Burdge,
G. C., Wootton, S. A., Griffin, B. A., Joe Millward, D., Pegge, N. C., & Bemelmans, W. J. (2002). UK Food Standards Agency alpha-linolenic acid workshop report. British Journal of Nutrition, 88(5), 573-9. PMid:12425738. http://dx.doi.org/10.1079/BJN2002691 Santos, L. D., Furuya, W. M., Castro Silva, T. S., Michelato, M., &
Matsushita, M. (2009). Ácido linoléico conjugado em dietas para pacu: tempo de deposição, desempenho e perfil de ácidos graxos. Revista Brasileira de Zootecnia, 38(6), 980-8. http://dx.doi. org/10.1590/S1516-35982009000600002
Santos, L. D., Furuya, W. M., Matsushita, M., Silva, L. C. R., Silva, T. S. C., Botaro, D., & Sales, P. P. (2007a). Deposição de ácido linoléico conjugado (CLA) em tilápias-do-nilo. Revista Brasileira de Zootecnia, 36(5), 1225-30. http://dx.doi.org/10.1590/S1516-35982007000600002