Discrimination of maize inbreds for kernel quality traits and fatty
acid composition by a multivariate technique
Cem Ömer Egesel1*, Fatih Kahrıman2 and Muhammet Kemal Gül3
1
Department of Agricultural Biotechnology, Çanakkale Onsekiz Mart University,Terzioğlu Campus, 17020, Çanakkale, Turkey. 2Department of Field Crops, Çanakkale Onsekiz Mart University,Terzioğlu Campus, Çanakkale, Turkey. 3K+S Nitrogen GmbH, Maslak-Şişli, İstanbul, Turkey. *Author for correspondence. E-mail:[email protected]
ABSTRACT. Quality is considered to be mainly related to protein and oil concentration in maize kernel. Great effort has been made through the elevation of oil and protein concentrations; however, studies to enhance the composition quality of oil have been limited. Maize genotypes with special fatty acid composition may confer different end uses and added value. We investigated eight maize inbreds for kernel quality and fatty acid composition. Kernel samples from a two-year experiment were analyzed for oil, protein, moisture and ash, as well as several fatty acids, including oleic, linoleic, and linolenic acids. Results indicated differences among the genotypes for all traits, except for behenic acid. A680 appeared to be a promising parent to elevate oleic acid, while N194 and RSSSC were the genotypes with the highest oil and protein levels, respectively. A new statistical approach, Canonical Discriminant Analysis with Hypothesis-Error plot technique was utilized to evaluate the data. It showed a good level of agreement with linear tests, and show similar results with those of multi comparison test. With the easily understandable graphical outputs that can interpret the interaction of variables and cases, it offers a good alternative way in analyzing data.
Keywords: Zea mays, oil, protein, multivariate analysis.
RESUMO.Análise de linhagens de milho quanto às características de qualidade da semente e à composição de ácidos graxos por uma técnica multivariada. Considera-se que a qualidade está relacionada principalmente com a concentração de proteínas e de óleos na semente de milho. Grandes esforços foram feitos para elevar as concentrações de óleos e de proteínas; no entanto, os estudos para realçar a qualidade da composição do óleo têm sido limitados. Os genótipos de milho com composição especial de ácidos graxo podem conferir diferentes utilizações finais e maior valor. Foram investigados oito linhagens de milho quanto à qualidade da semente e à composição de ácidos graxos. As amostras de sementes de um ensaio de dois anos foram analisadas quanto aos teores de óleos, proteínas, umidade e cinza, assim como diversos ácidos, incluindo oleico, linoleico e linolênico. Os resultados indicaram diferenças entre os genótipos para todas as linhagens, com exceção do ácido behênico. O A680 pareceu ser promissor para elevar os níveis de ácido oleico, enquanto o N194 e o RSSSC foram as linhagens com os níveis mais elevados de óleos e de proteínas. Uma nova abordagem estatística, a Análise Discriminante Canônica com a técnica de Hipótese-Erro, foi utilizada para avaliar os dados. Esta indicou bom nível de concordância com os testes lineares, e mostra resultados semelhantes aos do teste de comparação múltipla. Os resultados gráficos são fáceis de interpretar e constitui boa alternativa para análise dos dados.
Palavras-chave:Zea mays, óleos, proteínas, análise multivariada.
Introduction
The quality of foodstuff derived from maize is directly related with the quality of the maize grain. Therefore, it is of importance to enhance the quality of the kernel which is widely used in both human and animal feeding. The quality is considered to be mainly related to protein and oil concentration in maize kernel. A typical maize hybrid contains 8-15%
protein (REYNOLDS et al., 2005), and most of these proteins consist of prolamins.
The oil concentration of widely used maize hybrids varies between 3.5-5% (LAMBERT, 2001), and affected by the size of embryo, maturity, and position of the kernel on the ear (CURTIS et al., 1968; LAMBERT, 2001). As a result of the studies to enhance oil and protein concentration, lines have
(Illinois High Oil) oil, and 320 g kg-1 (Illinois High Protein) protein (DUDLEY; LAMBERT, 1992). The main quality traits of the kernel, protein and oil, also possess some quality criteria of their own. The quality of maize protein is related to amino acid composition, while oil quality is partly determined by fatty acid composition (PONELEIT; BAUMAN, 1970). Ash is another parameter that can be seen to affect kernel quality. Total ash makes up 1-3% of maize grain, and most of the minerals constituting ash are mainly located in the embryo (ANONYMOUS, 1993).
There are numerous fatty acid types in nature, but 5 of them compromise about 90% of the total in the widely used crops (BROWSE; SOMERVILLE, 1991). These are palmitic (16:0), stearic (18:0), oleic (18:1), linoleic (18:2) and linolenic (18:3) acids (GOFFMAN; BÖHME, 2001). Mono unsaturated fatty acids have some superiorities over poly unsaturated fatty acids in both cooking and health aspects (MATTSON; GRUNDY, 1985). The eating habits containing high levels of saturated fats, sugar, and processed food, so called “Western-diet”, have been progressively expanding throughout the world, and have started to replace the other eating styles for the last decades (LIEBERMAN, 2003; POPKIN, 2003). In this type of eating, keeping the balance of plant-based oils and preferring the oils containing a larger ratio of the unsaturated fatty acids may have important health benefits. Compared to some other plant-based oils, corn oil contains a less amount of linolenic acid, one of the poly unsaturated fatty acids (PUFA), resulting in a higher quality in terms of shelf life and cooking stability (WEBER, 1987). Coupling with this advantage, increasing the currently low levels of oleic acid in maize grain through breeding studies may confer additional health benefits (TSIMIKAS et al., 1999).
Breeding studies in maize to enhance fatty acid composition started in 1970’s; however, they have not continued. Research in this area dealt with different aspects of grain quality, focusing mainly on determination of the grain quality traits and characterization of maize genotypes in terms of fatty acid composition. Jellum (1970) determined large ranges of oleic (16-64%) and linoleic (19-71%) acids and reported a negative correlation between them in a study with 788 maize strains. Dunlap et al. (1995a) evaluated 20 maize populations collected from US, Chile, Argentina and Uruguay for their fatty acid compositions, and reported ranges of 6.3-18.2% for palmitic acid, 0.9-4.5% for stearic acid, 18.5-46.1% for oleic acid, 36.6-66.8% for linoleic acid, 0.0-2.0% for linolenic acid, and 0.0-1.4% for arachidic acid. In another study by the same researchers using 418
hybrids and 98 inbreds 6.7-16.5% palmitic; 0.7-6.6% stearic, 16.2-43.8% oleic, 39.5-69.5% linoleic, and 0.0-3.7% linolenic acid values were reported (DUNLAP et al., 1995b). It may be inferred that,
genetic resources existed in Zea mays species should
be screened and characterized for their quality traits to determine objectives and possibilities of use in quality breeding. Based on the research results, it can be said that maize could possibly be enhanced for its oil quality although it does not have a high oil ratio as oilseed crops. This existing broad genetic variance for the fatty acids could be utilized to breed very different types of maize hybrids.
Despite the fact that maize is not a high-ranked oil supplier plant in the world, it comprises a significant 10-15% of oil consumption in Turkey (YAYAR; BAL, 2007). In fact, it ranks third only to sunflower and olive oil and highly preferred by urban population. Therefore, studies to enhance corn oil quality would be of a distinct consequence. The main objective of this research was to evaluate 8 maize genotypes with different genetic constitution for their grain and oil quality and determine the potential of using them as genetic material in quality breeding studies, with an emphasis on manipulating fatty acid composition. We also intended to exercise the use of Canonical Discriminant Analysis with Hypothesis-Error plot technique for a better presentation and easier interpretation of scientific data collected from the studies of this kind.
Material and methods
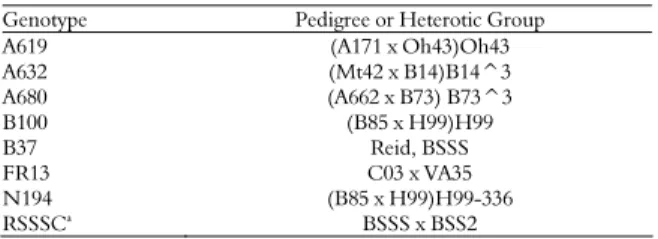
The plant material used in this study consisted of 8 maize inbreds randomly chosen from the set of genotypes existed in the maize breeding program of Çanakkale Onsekiz Mart University, Field Crops Department (Table 1).
Table 1. The maize genotypes used in the study.
Genotype Pedigree or Heterotic Group
A619 (A171 x Oh43)Oh43
A632 (Mt42 x B14)B14^3
A680 (A662 x B73) B73^3
B100 (B85 x H99)H99
B37 Reid, BSSS
FR13 C03 x VA35
N194 (B85 x H99)H99-336 RSSSCa
BSSS x BSS2
aOriginally a synthetic, but selfed for several generations.
The field trials were conducted in Çanakkale for two years (2006 and 2007), using a randomized complete block design. Each plot consisted of two rows, spaced 0.70 m and 5 m long, and final plant
density was set at about 71,400 plants ha-1. To
number of seed set in some of the plots, self-pollinated ears from each genotype were bulked and 3 subsamples were taken for laboratory analyses.
Monthly temperature and precipitation data for the two years are given in Figure 1. In the second year of the experiment, there was no precipitation in July, and higher temperature values were recorded compared to the first year (Figure 1). The soil in the experimental area had a sand-loam characteristic, poor in organic matter (1.26%) and slightly basic (pH = 7.93).
Figure1. Daily rainfall (mm) and temperature (oC) values for the
two years.
For kernel quality traits (protein, oil, ash, and moisture content), appropximately 200 g of seed were grounded from each sub-sample by using laboratory mill with a 0.5 mm sieve (Frictsch pulverisette 14, Germany). On these samples, ash and moisture were measured based on Association of Analytical Communities (AOAC) methods no. 923.03 and no. 925.10, respectively (AOAC, 1990a, 2000). Elementary analyses were done in EA3000 elementary analysis instrument with single reactor system (Eurovector, Italy) by the Dumas combustion principle (ICC, 2000). The instrument was conditioned as recommended by the producer to accomplish the combustion of the samples. For conditioning, reactor and gas column temperatures were set to 1,020 and 105°C, respectively; and waited in these conditions until the instrument has been stabilized. High purity oxygen at a pressure of 35 kPa was used for sample combustion, while helium (high purity, 78 kPa) was the carrier gas. After conditioning the instrument, a standard curve was prepared using L-Cystine (E11009; Eurovector s.p.a, Milano) calibration chemical. Ground kernel samples (0.5-1.5 mg) were weighed into tin caps for C/N analysis. Sample data were entered into elemental analysis instrument and C/N chromatograms were obtained. Calculated N values were multiplied by the coefficient 6.25 to yield total protein ratio of a sample.
Using the remaining ground tissue for each entry, oil extraction was achieved in Soxhlet extractor (Elektromag MX625, Turkey) following the method no. 920.85 by AOAC (1990b). For each replication, 10 g sample was extracted with n-hexan
at 70oC for 6 hours. Extracted oil was stored
appropriately at 4oC to be used in fatty acid analyses.
Fatty acids were analysed in the Plant Breeding Laboratories of the Department of Crop Sciences, Göttingen Georg-August University. The fatty acid composition of the selected samples was determined through GLC analysis of fatty acid methyl esters. They were prepared following the procedure developed by Thies (1971), and analysed on a Perkin Elmer gas chromatograph model 8600 (Perkin Elmer Corporation, Norwalk, CT, USA) equipped with a fused silica capillary column FFAP, 25 m 0.25 mm 0.25 m film thickness (Macherey & Nagel GmbH + Co. Kg, Güren, Germany). The oven, detector, and injector temperatures were 200, 250,
and 250oC, respectively. The carrier gas was
nitrogen, at a pressure of 100 kPa. Two microlitres of methylated samples (with 0.5 mL of i-octan and
0.2 mL of a solution of 5% NaHSO4 in water) were
injected, at a split rate of 1:70. Individual fatty acids were expressed as % of total fatty acids.
The statistical analysis was done using Proc GLM procedure of SAS statistical software (SAS, 1999). Tukey test was used for mean separation. The variance analysis was done based on the following model:
Yijk = µ + Si + Rj(Si) + Gk + SxGik + eijk
where:
Yijk: observation value, µ: general population
mean, Si: effect of year i (i=1, 2), Rj(Si): effect of
replication j within year i (j=1, 2, 3; i=1, 2), Gk:
effect of genotype k (k = 1, 2,…8), SxGik:
interaction effect of genotype by year, eijk: random
error term.
visualize a multivariate linear model in a low-dimensional view via a generalized canonical discriminant analysis. The heplot package gives plot ellipses representing the hypothesis and error sums-of-squares-and-products matrices for terms and linear hypotheses in a multivariate linear model (FRIENDLY; FOX, 2010).
Results and discussion
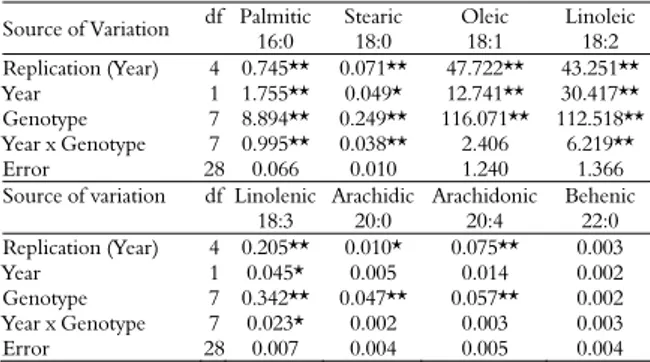
Variance analysis results of the kernel quality traits indicated a significant genotype x year interaction effect for moisture, ash, and oil (Table 2). Genotype effect was significant for all the variables investigated (p < 0.01). Of the oil quality traits, palmitic (16:0), stearic (18:0), linoleic (18:2), and linolenic (18:3) acids were affected by genotype x year interaction. Except for behenic acid (22:0), genotype was a significant effect for all fatty acids (p < 0.01) (Table 3).
Table 2. Mean squares for kernel quality traits.
Source of Variation Df Moisture Ash Protein Oil Replication (Year) 4 0.016 0.003 0.729 0.271*
Year 1 18.625** 0.139** 1.577 0.001
Genotype 7 0.399** 0.071** 7.653** 1.229** Year x Genotype 7 0.271** 0.021** 2.761 0.451**
Error 28 0.006 0.005 1.775 0.095
*, **: Statistically significant at p < 0.05 and 0.01 levels, respectively. df: Degrees of freedom.
Table 3. Mean squares for fatty acids.
Source of Variation df Palmitic 16:0
Stearic 18:0
Oleic 18:1
Linoleic 18:2 Replication (Year) 4 0.745** 0.071** 47.722** 43.251**
Year 1 1.755** 0.049* 12.741** 30.417** Genotype 7 8.894** 0.249** 116.071** 112.518**
Year x Genotype 7 0.995** 0.038** 2.406 6.219**
Error 28 0.066 0.010 1.240 1.366
Source of variation df Linolenic 18:3
Arachidic 20:0
Arachidonic 20:4
Behenic 22:0 Replication (Year) 4 0.205** 0.010* 0.075** 0.003
Year 1 0.045* 0.005 0.014 0.002
Genotype 7 0.342** 0.047** 0.057** 0.002 Year x Genotype 7 0.023* 0.002 0.003 0.003
Error 28 0.007 0.004 0.005 0.004
*, **: Statistically significant at p < 0.05 and 0.01 levels, respectively. Df: Degrees of freedom.
CDA with HE plot was utilized in order to evaluate the genotypes for the investigated traits (Fig 2). HE plot is a new method integrated to CDA (FRIENDLY, 2006a), and is different from other graphical methods (e.g., Multi Dimensional Scaling, Principal Component Analysis etc.) in that it allows to evaluate investigated traits (variables) and factors (cases) together. It also makes it possible to interpret the relationships among the variables in accordance with correlation analysis, by schematizing them as vectors drawn away from the origin. If a positive correlation exists between two variables, the vectors head similar directions, while
they show diverse directions in the case of a negative correlation. The length of the related vector indicates how well the variation for that trait can be explained in two-dimensional space (FRIENDLY, 2006b). In other words, the longer a vector is, the better interpretation is possible about the variable it represents. Besides, the shapes of the hypothesis (Genotypes) and error of hypothesis (Error) ellipses in HE plots give information about the distribution of the data and canonical dimensions. If hypothesis circle is annular it means total variation is explained by both canonical dimensions equally, while if it is a flat ellipsoid then it means the first dimension explains a higher ratio than the second dimension does. The diameter of the error circle indicates the error rate of the hypothesis, and the factor levels (cases) nestled within this circle have a high error rate. Normally, genotype x year interaction is not shown in HE plot graphics, nevertheless it is possible to evaluate the presence of this source of variation if the proximity of the genotypes to the vectors about the investigated trait and the ranking of these genotypes show differences in different years. In Figure 2, the first 4 graphs (a-d) intend to evaluate the genotypes in different years (genotype x year interaction). The last graphs (e and f) are for the evaluation of general means of the genotypes. Arachidic, arachidonic and behenic acids were not included in the graphical analysis because of their very low concentrations, and the values in Table 4 were used for any interpretation about them.
Can 2 (8
.4%)
5
0
-5
Can 2 (32
.2%)
15
10
5
0
-5
-10
-15
-5 0 5 -15 -10 -5 0 5 10 15
(a) Can 1 (84.9%) (b) Can 1 (58.8%)
Can 2 (18
.5%)
5
0
-5
Can 2 (24
.6%)
15
10
5
0
-5
-10
-15
-5 0 5 -15 -10 -5 0 5 10 15
(c) Can 1 (75.6%) (d) Can 1 (68.9%)
Can 2 (20
.5%)
6
4
2
0
-2
-4
-6
Can 2 (34
.1%)
15
10
5
0
-5
-10
-15
-6 -4 -2 0 2 4 6 -20 -15 -10 -5 0 5 10 15
(e) Can 1 (60.6%) (f) Can 1 (58.3%)
Figure 2. CDA with HE plots for kernel quality traits (a, c and e) and fatty acids (b, d and f). (a and b: 2006; c and d: 2007; e and f: Average of two years).
Although RSSSC had a high mean value for protein content (Table 4) it was located in the opposite direction of protein vector in graphichal presentation
year graph (Figure 2a) two canonical dimensions explain 93.3% of the between-group variation, and the first dimension accounts for 84.9% of it. In the second year graphs (Figure 2c) these numbers are 94.1% and 75.6%, respectively. The first dimension explains 60.6% of the total variation in the graph showing general means (Figure 2e). Therefore, the interpretations are more elucidative about the variables explained by Can1 dimension (i.e., vectors that are closer to the horizontal plane). Regarding the graphs about fatty acids, both canonical dimensions should be used when commenting on these traits. In all three graphs (Figure 2b, d and f), although the first canonical dimension explains a high ratio, the second dimension also has significant ratios and therefore both dimensions should be considered when explaining the variation on fatty acids existed in these graphs. In the graphs showing fatty acids in different years (Figure 2b and d) oleic acid (18:1) appears to have a negative association with the other fatty acids. In the first year’s graph (Figure 2b), it can be argued that B37 for
palmitic and linolenic acid, N194 and A680 for oleic acid, A632 and FR13 for linoleic acid, and A619 for stearic acid contents are of higher values compared to the other genotypes for the respective traits. In the second year (Figure 2d), B37 and N194 for palmitic, N194 and A680 for oleic, A619, A632, FR13, and RSSSC for linoleic acids are the superior genotypes. For stearic and linolenic acids, vector lengths are rather short, thereby limiting the accuracy of the HE plot for these traits.
Comparing the first and second year graphs, one can argue that B100 and B37 are the genotypes having a higher contribution to emerge an interaction effect, for palmitic and linoleic acid contents, respectively. Of the fatty acids investigated in this study, all but behenic acid exhibited significant differences among the genotypes. Looking at the graph showing general means (Figure 2f), B37 and A680 are the genotypes with the highest levels of palmitic and oleic acids, respectively; whereas A632 and FR13 have the highest linoleic acid.
Table 4. Genotype means for the investigated traits.
Moisture (%) Ash (%) Protein (%)
Genotypes 2006 2007 Mean 2006 2007 Mean 2006 2007 Mean
A619 9.3 b† 10.2 d 9.7 c 1.50 bc 1.48 a 1.49 b 11.1 11.6 11.4 b A632 9.2 b 9.9 e 9.6 d 1.67 a 1.50 a 1.58 a 13.9 10.9 12.4 ab A680 9.0 c 10.4 c 9.7 c 1.37 c-e 1.43 ab 1.40 cd 11.5 10.4 11.0 bc B100 9.6 a 10.7 b 10.1 a 1.35 de 1.32 bc 1.33 de 12.1 11.5 11.8 ab B37 8.8 d 10.3 cd 9.6 d 1.36 c-e 1.20 d 1.28 e 12.9 11.8 12.4 ab FR13 9.7 a 10.7 b 10.2 a 1.52 b 1.38 ab 1.45 bc 10.6 11.5 11.1 b N194 9.3 b 10.7 b 10.0 b 1.32 e 1.23 cd 1.28 e 8.9 9.9 9.4 c RSSSC 9.1 c 11.1 a 10.1 a 1.48 b-d 1.17 d 1.33 de 12.7 13.3 13.0 a
Mean 9.2 B†† 10.5 A 1.45 A 1.34 B 11.7 11.4
Oil (%) Palmitic acid (%) Stearic acid (%)
Genotypes 2006 2007 Mean 2006 2007 Mean 2006 2007 Mean
A619 4.72 a 3.76 cd 4.24 b 12.1 c 11.5 a 11.8 c 2.27 a 2.00 a 2.14 a A632 3.71 bc 3.79 c 3.75 cd 10.4 d 10.5 b 10.5 d 1.71 bc 1.76 c 1.74 cd A680 3.38 c 3.26 e 3.32 e 9.9 e 10.0 c 10.0 e 1.45 d 1.47 d 1.46 f B100 4.14 ab 4.23 b 4.19 b 9.8 e 10.9 b 10.4 d 1.55 cd 1.74 c 1.65 de B37 3.67 bc 3.49 de 3.58 de 13.5 a 11.9 a 12.7 a 1.90 b 1.73 c 1.81 bc FR13 3.63 bc 3.45 e 3.54 de 10.5 d 10.0 c 10.3 d 1.86 b 1.89 b 1.87 b N194 4.60 a 4.80 a 4.70 a 12.5 b 11.8 a 12.2 b 1.83 b 1.69 c 1.76 b-d RSSSC 3.46 bc 4.48 b 3.97 bc 9.7 e 8.7 d 9.2 f 1.69 bc 1.48 d 1.58 e
Mean 3.91 3.91 11.1 A 10.7 B 1.78 A 1.72 B
Oleic acid (%) Linoleic acid (%) Linolenic acid (%)
Genotypes 2006 2007 Mean 2006 2007 Mean 2006 2007 Mean
A619 25.0 22.9 23.9 d 58.3 b 61.3 a 59.8 b 1.08 de 1.06 bc 1.07 b A632 23.3 23.7 23.5 d 62.1 a 61.5 a 61.8 a 1.35 c 1.43 a 1.39 a A680 36.7 34.1 35.4 a 49.5 e 52.1 c 50.8 d 1.19 d 1.11 b 1.15 b B100 30.4 30.7 30.5 b 55.7 cd 54.0 c 54.8 c 1.42 bc 1.35 a 1.39 a B37 27.7 26.9 27.3 c 54.0 d 57.1 b 55.5 c 1.49 ab 1.30 a 1.40 a FR13 23.1 23.5 23.3 d 62.4 a 62.3 a 62.4 a 0.75 f 0.87 d 0.81 d N194 32.7 30.9 31.8 b 50.7 e 53.4 c 52.1 d 0.98 e 0.92 cd 0.95 c RSSSC 29.0 27.1 28.0 c 56.7 bc 60.3 a 58.5 b 1.57 a 1.30 a 1.44 a
Mean 28.5 A 27.5 B 56.2 A 57.8 B 1.23 A 1.17 B
Arachidic acid (%) Arachidonic acid (%) Behenic acid (%)
Genotypes 2006 2007 Mean 2006 2007 Mean 2006 2007 Mean
A619 0.63 0.63 0.63 a 0.28 0.25 0.26 e 0.10 0.14 0.12
A632 0.44 0.47 0.45 bc 0.38 0.37 0.38 bc 0.13 0.13 0.13 A680 0.48 0.51 0.50 bc 0.52 0.43 0.47 a 0.13 0.15 0.14
B100 0.44 0.41 0.42 c 0.48 0.50 0.49 a 0.14 0.19 0.16
B37 0.70 0.63 0.66 a 0.41 0.29 0.35 cd 0.13 0.10 0.12
FR13 0.61 0.59 0.60 a 0.29 0.27 0.28 de 0.14 0.08 0.11
N194 0.52 0.51 0.52 b 0.52 0.53 0.52 a 0.16 0.16 0.16
RSSSC 0.50 0.42 0.46 bc 0.47 0.43 0.45 ab 0.10 0.17 0.13
Mean 0.54 0.52 0.42 0.38 0.13 0.14
Oleic acid which has some advantages over the other fatty acids in terms of cooking and health (MATTSON; GRUNDY, 1985) is normally found in corn oil at a level of about 25%, and genotypes with higher levels of this fatty acid is economically more valuable (MIKKILINENI; ROCHEFORD, 2003). Figure 2f cannot provide accurate estimates of linolenic and stearic acid levels due to the short vector lengths, therefore Table 4 should be used to identify the superior genotypes for these traits. In addition, higher values of arachidic acid existed in A619, B37, FR13, while A680, B100 and N194 are the genotypes with higher levels of arachidonic acid (Table 4). Comparing the year means, ash, palmitic, stearic, oleic and linolenic acid values were higher in the first year; while, moisture and linoleic acid values were higher in the second year (Table 4).
We obtained similar results to earlier studies with regards to genetic and environmental factors having effects on the quality characteristics. Dunlap et al. (1995a) argued that saturated fatty acids were higher in hotter climates, nonetheless genetic factors play more important role on fatty acid composition than environmental factors. In our study, average daily temperature was higher in May-July period of the second year (Figure 1). Based on this, an increase in the saturated fatty acid ratios could have been expected. However, only 3 genotypes (A632, A680 and B100) for palmitic acid, and 4 genotypes (A632, A680, B100 and FR13) for stearic acid showed such an increase. It can be argued that there is an inconstant status in the saturated fatty acid ratios of the genotypes against the temperature changes; and in the G x Y interaction emerging as a result of these changes, genetic factors are more influential than the environmental factors. Along with this, it is notable that the expected increases have been exhibited by the same genotypes for both of these fatty acids. This brings to mind that some genotypes may have stable reactions to environmental effects, which offers a potential use in breeding studies focused on improving fatty acid composition. Further research using different temperature levels in controlled conditions may help to elicit the effect of temperature on fatty acids. Also, the negative correlation of oleic acid with the other fatty acids (i.e., linoleic and linolenic) (WASSOM et al., 2008) can be seen looking at the distance between the vectors representing them. The fact that linoleic and linolenic acids are biosynthesized at the expense of oleic acid explains the negative association between these fatty acids.
Conclusion
Enhancing the corn oil quality would open up new opportunities for food and industrial end uses of this crop. Even though a limited number of genotypes were studied, the results indicate that there was a considerable variation for fatty acid composition in the germplasm. Therefore, we can say that there is good chance for enhancement in these materials for fatty acid composition as well as the general grain quality traits. A680 appeared to be a promising parent to elevate oleic acid levels, while N194 and RSSSC were the genotypes with the highest oil and protein levels, respectively.
In explaining the present variation, multi-variable interpretations based on HE plots seem to have good level of agreement with linear tests (ANOVA), and show similar results with those of multi comparison test (Tukey) used in the statistical analysis of this data set. From this point of view, with its easily understandable graphical outputs that can interpret the interaction of variables and cases, CDA with HE plot method offers a good alternative way in analyzing data from this kind of studies. Along with these advantages, there may be some problems about the vector lengths when the numerical differences among the traits are large. In fact, the presence of short vectors that cannot exceed the error ellipse may be concurrent with an inaccurate ranking of the genotypes for the respective trait.
Acknowledgement
We are in debt to Dr. H. Becker’s lab in Georg-August University, for the analysis of fatty acids. We would also like to thank Dr. Ömer Bayram for translating the abstract into Portuguese, and our students for their assistance during the field studies.
References
ANONYMOUS. Maize in human nutrition. Food and Agriculture Organization of The United Nations. Rome: FAO, 1993.
AOAC-Association of Official Analytical Chemists. Methods of the association of official analysis chemists. 15th ed. Method No. 923.03. Arlington, 1990a. AOAC-Association of Official Analytical Chemists. Methods of the association of official analytical chemists. Method No. 920.85. 15th ed. Arlington, 1990b. v. II.
AOAC-Association of Official Analytical Chemists. Official method AOAC 925.10 for moisture in flour. Arlington, 2000.
Physiology and Plant Molecular Biology, v. 42, p. 467-506, 1991.
CURTIS, P. E.; LENG, E. R.; HAGEMAN, R. H. Developmental changes in oil and fatty acid content of maize strains varying in oil content. Crop Science, v. 8, n. 6, p. 689-693, 1968.
DUDLEY, J. W.; LAMBERT, R. J. Ninety generations of selection for oil and protein in maize. Maydica, v. 37, p. 81-87, 1992.
DUDLEY, J. W.; CLARK, D.; ROCHEFORD, T. R.; LEDEAUX, J. R. Genetic analysis of corn grain chemical composition in the random mated 7 generation of the cross of generations 70 of IHP × ILP. Crop Science, v. 47, n. 1, p. 45-57, 2007.
DUNLAP, F. G.; WHITE, P. J.; POLLAK, L. M. Fatty acid composition of oil from exotic corn breeding materials. Journal of the American Oil Chemist Society, v. 72, n. 9, p. 989-993, 1995a.
DUNLAP, F. G.; WHITE, P. J.; POLLAK, L. M.; BRUMM, T. J. Fatty acid composition of oil from adapted, elite corn breeding materials. Journal of the American Oil Chemist Society, v. 72, n. 9, p. 981-987, 1995b.
FRIENDLY, M. HE plots for multivariate linear models. Journal of Computational and Graphical Statistics, v. 16, n. 2, p. 421-444, 2006a.
FRIENDLY, M. Data Ellipses, HE Plots and reduced-rank displays for multivariate linear models: SAS software and Examples, Journal of Statistical Software, v. 17, n. 6, p. 1-43, 2006b.
FRIENDLY, M.; FOX, J. Candisc: Generalized Canonical Discriminant Analysis. R package version 0.5-19. Available from:<http://www.CRAN.R-project.org/package=candisc>. Access on: 21 Mar. 2010.
GOFFMAN, F. D.; BÖHME, T. Relationship between fatty acid profile and vitamine E content in maize hybrids (Zea mays L.). Journal of Agriculture and Food Chemistry, v. 49, n. 10, p. 4990-4994, 2001.
ICC-International Association for Cereal Science and Technology. Determination of crude protein in grain and grain products for food and feed by the Dumas Combustion Principle, ICC standard no. 167, 2000. JELLUM, M. D. Plant introductions of maize as a source of oil with unusual fatty acid composition. Journal of Agricultural and Food Chemistry, v. 18, n. 3, p. 365-370, 1970.
LAMBERT, R. J. High-oil corn hybrids. In: HALLAUER, A. R. (Ed.). Specialty corns. Boca Raton: CRC Press, 2001. p. 123-145.
LIEBERMAN, L. S. Dietary, Evolutionary, and Modernizing Influences on the Prevalence of Type2 Diabetes. Annual Review of Nutrition, v. 23, p. 345-377, 2003.
MATTSON, F. R.; GRUNDY, S. M. Comparison of effects of dietary saturated, monounsaturated, and polyunsaturated fatty acids on plasma lipids and lipopro-
teins in man. Journal of Lipid Research, v. 26, n. 2, p. 194-202, 1985.
MIKKILINENI, V.; ROCHEFORD, T. R. Sequence variation and genomic organization of fatty acid desaturase-2 (fad2) and fatty acid desaturase-6 (fad6) cDNAs in maize. Theorotical Applied Genetetics, v. 106, n. 7, p. 1326-1332, 2003.
PONELEIT, C. G.; BAUMAN, L. F. Diallel Analyses of Fatty Acids in Corn (Zea mays L.) Oil. Crop Science, v, 10, n. 4, p. 338-341, 1970.
POPKIN, B. M. The Nutrition Transition in the Developing World. Development Policy Review, v. 21, n. 5-6, p. 581-597, 2003.
R DEVELOPMENT CORE TEAM. R: A language and environment for statistical computing. R Foundation for Statistical Computing, Vienna. Available from: <http://www.R-project.org>. Access on: 21 Mar. 2010. REYNOLDS, T. L.; NEMETH, M. A.; GLENN, K. C.; RIDLEY, W. P.; ASTWOOD, J. D. Natural variability of metabolites in maize grain: differences due to genetic backround. Journal of Agricultural and Food Chemistry, v, 53, n. 26, p. 10061-10067, 2005.
SAS-Statistical Analisys System. Statistical analisys systemuser’s guide: version 8. Cary: Statistical Analysis System Institute, 1999.
THIES, W. Gaschromatographische und Papierchro-matographische Methoden. Z. Pflanzenzüchtg, v. 65, p. 181-202, 1971.
TSIMIKAS, S.; PHILIS-TSIMIKAS, A.; ALEXOPOULOS, S.; SIGARI, F.; LEE, C.; REAVEN, R. D. LDL isolated from Greek subjects on a typical diet or from American subjects on an oleate-supplemented diet induces less monocyte chemotaxis and adhesion when exposed to oxidative stress. Arteriosclerosis, Thrombosis, and Vascular Biology, v. 19, n. 1, p. 122-130, 1999.
WASSOM, J. J.; MIKKELINENI, V.; BOHN, M. O.; ROCHEFORD, T. R. QTL for fatty acid composition of maize kernel oil in Illinois high oil x B73 backcross-derived lines. Crop Science, v. 48, n. 1, p. 69-78, 2008. WEBER, E. J. Lipids of the kernel. In: WATSON, S. A.; RAMSTAD, P. E. (Ed.). Corn: chemistry and technology. St. Paul: American Association of Cereal Chemists, 1987. p. 311-350.
YAYAR, R.; BAL, H. S. G. Forecasting of corn oil price in Turkey. Journal of Applied Science Research, v. 3, n. 8, p. 706-712, 2007.
Received on August 31, 2010. Accepted on November 22, 2010.