NUTRITIONAL STATUS DISCRIMINATORY CAPACITY OF DIFFERENT METHODS OF OBTAINING BODY MASS INDEX Juliana Alvares Duarte Bonini Campos1(✉ [email protected]), Moema de
Souza Santana1, Adrielly dos Santos1, & Wanderson Roberto da Silva1
1 São Paulo State University, School of Pharmaceutical Sciences, Department of Food and Nutrition, Araraquara-SP, Brazil
Body Mass Index (BMI) is an internationally adopted measurement recommended by the World Health Organization (WHO) that seeks to verify whether an individual is at the appropriate weight (kg) for their height (m). This anthropometric indicator enables nutritional status to be classified and, in particular, excess weight in populations to be monitored. BMI, then, has been widely used as an indicator, although, in studies with large samples, directly taking height and weight measurements has been difficult. Thus, the literature indicates using reported data as an alternative to taking measurements in an effort to facilitate field work and considerable decrease the costs related to training personnel (training, standardization and calibration of anthropometrists), transport and acquisition of measurement equipment (Carvalho, Piovezan, Selem, Fisberg, & Marchioni, 2014).
Using reported height and weight data to calculate BMI has been documented and its use recommended in developed countries. In Brazil, use of such data is growing , however, despite use of such data spreading, there is conflict in the literature with regards their validity and reliability as results regarding reported and measured diverge, with concordance ranging from mediocre (Bleil, Salay, & da Silva, 2009) to excellent (Carvalho et al., 2014) between the methods. Some studies indicate no difference between BMI means obtained based on reported and measured for both males and females (Maranhão Neto, Polito, & Lira, 2005), while others indicate a difference between the means with variations in the errors according to gender (Oliveira et al., 2012).
Another alternative for obtaining BMI is using the Figure Rating Scale (FRS). The first Figure Rating Scale was proposed in 1983 by Stunkard, Sörensen and Schulsiger (1983) and since then has been adapted for different populations. In the Brazilian context, the creation of the FRS for adults, constructed and validated by Kakeshita, Silva, Zanatta and Almeida (2009) stands out. This scale permits perceptions of body size (current BMI) to be evaluated through a series of 15 silhouettes presented to each gender. The obvious advantage of using this method for obtaining BMI is the fact that the FRS enables the individual’s perception of their body size to be evaluated, as well as evaluating body judgements by further researching the figure that best represents the desired body, yielding information on body satisfaction. Kakeshita et al. (2009) found moderate and good concordance between measured BMI means those obtained using the FRS, but there are still few studies evaluating this relationship.
Thus, given how widely used BMI is for primary classification of nutritional status, it is relevant to investigate the discriminatory capacity of different methods of obtaining this indicator for classifying nutritional status and this study was therefore conducted with the aim of verifying the discriminatory capacity of reported BMI and that obtained using the FRS for classifying the nutritional status of university students.
METHOD
Study design and participants
This was a cross-sectional observational study. Students enrolled on the Pharmacy-Biochemistry course of São Paulo State University (n=430) were invited to participate (Adherence Rate=82.8%). Minimum sample size was established allowing for α=5% and power=80%, discriminatory power of the methods=70%. Thus, estimated minimum sample size was 378 individuals to detect underweight, 62 for normal weight and 120 to detect overweight/obesity. Considering the low prevalence of underweight among the students, this study had a limitation regarding the sample size and that needed to estimate underweight. This limitation was imposed by
the total sample size and agreement to participate in the study. However, the difference between the study sample (n=356) and the estimated (n=378) size was only 22 subjects, which does not compromise the statistical power of the analyses.
Material
Weight (kg) and height (m) measurements were reported by the participants and measured by one researcher after training and calibration in a pilot study. Weight was measured using electronic scales (Filizola®).
Height was measured using a portable stadiometer and participants, with their head positioned on the Frankfurt line, were instructed to stand with heels, calves, glutes and shoulders against the base of the device. BMI was calculated and nutritional status was classified according to WHO guidelines.
The FRS proposed by Kakeshita et al. (2009) was also used to estimate participants’ BMI. This scale is made up of 15 figures on separate 12.5 x 6.5 cm laminated cards. In the original instrument the participant had to indicate the figure which best represented their “current body”. In this study, participants were asked to indicate the figure that best represented their current body using two different methodologies of presenting the figures: i. in which the figures were presented in ascending order in cards (original method) and ii. in which the figures were also presented in ascending order on a single A4 sized sheet (alternative method). The proposal to test the alternative method of presenting the figures aimed to seek a strategy for using the FRS in epidemiological studies with large samples in which it is difficult to present the cards. Thus, in this study, this proposal was tested, seeking to identify its discriminatory capacity and its possible effects on obtaining individuals’ BMI and nutritional status.
Procedure
Half of the students, randomly selected, completed the FRS with the A4 sheet (alternative method) while the other students were presented with the FRS on cards (original method). After measurements were taken, students were again asked to select the FRS Figure that best represented their current
body, but this time using the other method of presenting the figures. This study was approved by the Ethics Committee (CAAE: 42105415.0.0000. 5426).
Prevalence of underweight, normal weight and overweight/obesity among the participants was estimated by point and by 95% confidence interval (CI95%). Concordance between participants’ BMI values obtained from different methods was estimated using the Intraclass Correlation Coefficient (ICC). In order to evaluate discriminatory capacity of nutritional state using the different methods measured BMI was considered as the gold standard. Values were estimated for sensitivity, specificity and accuracy. The Receiver Operator Characteristic Curve (ROC curve) was produced and its area estimated (AUROC). The z test was used to compare the discriminatory capacity of methods evaluated based on the difference between areas (DAUROC). A significance level of 5% was considered.
RESULTS
The participants’ mean age was 20.95 (SD=2.55) years, with 71.63% (n=255) females. The prevalence of underweight, normal weight and overweight/obesity obtained using the different methods can be seen in Table 1.
Table 1
Prevalence [confidence interval 95%] of nutritional status using the different methods of estimating BMI
Prevalence [CI95%] Figure Rating Scale
Nutritional status Measured Reported Original method Alternative method Underweight 08.7[5.8-11.6]0 07.9[5.1-10.7]0 23.3[18.9-27.7] 014.88[11.2-18.6] Normal weight 63.4[58.5-68.5] 67.7[62.8-72.6] 33.4[28.5-38.3] 27.8[23.1-32.5] Overweight/Obesity 27.8[23.1-32.5] 24.4[20.0-28.9] 43.2[38.1-48.4] 57.3[52.2-62.4]
The FRS (original and alternative method) overestimated the prevalence of underweight and overweight/obesity. The concordance between the test methods and the gold standard was BMI reported: .95;
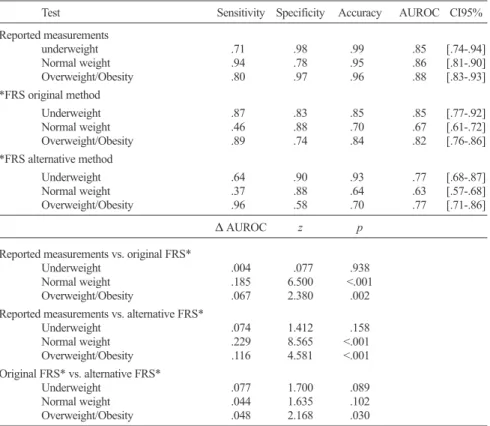
Figure rating scale cards: .71; Figure rating scale alternative: .63. Table 2 shows the discriminatory capacity of nutritional state using the different methods. Reported measurements were shown to have adequate discriminatory capacity for classifying nutritional status. Using the FRS (original and alternative), discriminatory capacity was compromised only in determining normal weight. Significant difference in the predictive capacity of nutritional status (normal weight and overweight/obesity) was found when the FRS (original and alternative method) and reported measurements were used. No significant difference was found between the discriminatory capacity for underweight and normal weight when the original or alternative FRS was used.
Table 2
Comparison of the discriminatory capacity of the different methods for determining nutritional status
Test Sensitivity Specificity Accuracy AUROC CI95%
Reported measurements underweight .710 0.980 .990 .85 [.74-.94] Normal weight .940 0.780 .950 .86 [.81-.90] Overweight/Obesity .800 0.970 .960 .88 [.83-.93] *FRS original method Underweight .870 0.830 .850 .85 [.77-.92] Normal weight .460 0.880 .700 .67 [.61-.72] Overweight/Obesity .890 0.740 .840 .82 [.76-.86] *FRS alternative method Underweight .640 0.900 .930 .77 [.68-.87] Normal weight .370 0.880 .640 .63 [.57-.68] Overweight/Obesity .960 0.580 .700 .77 [.71-.86] ∆ AUROC z p
Reported measurements vs. original FRS*
Underweight .004 0.077 .938
Normal weight .185 6.500 <.001
Overweight/Obesity .067 2.380 .002
Reported measurements vs. alternative FRS*
Underweight .074 1.412 .158 Normal weight .229 8.565 <.001< Overweight/Obesity .116 4.581 <.001< Original FRS* vs. alternative FRS* Underweight .077 1.700 .089 Normal weight .044 1.635 .102 Overweight/Obesity .048 2.168 .030
DISCUSSION
This study verified that BMI calculated by means of reported measure -ments for weight and height as well as based on the FRS are valid for discriminating underweight and overweight/obesity in university students. However, it was found that BMI obtained based on the FRS overestimates the prevalence of these conditions. Moreover, we also present evidence of excellent concordance between measured BMI and reported measurements and overestimation of this indicator when obtained using the FRS.
The excellent concordance found between measured and reported measurements corroborates evidence presented in the literature (Carvalho et al., 2014) suggesting that using reported measurements could be an interesting alternative in large epidemiological studies as reported measurements are simpler to collect and can reduce the time needed for data collection and thus the costs of research, as it dispenses with the need for specific equipment or trained and calibrated anthropometrists.
Regarding the relationship between the two methods of applying the FRS, it is worth noting that the alternative method overestimates participants’ mean BMI. We believe that this overestimation is related to possible visual compensation for the reduced size of the figures on the paper compared with on the cards. Thus, the reduced size (dimensions) of the figure may have given an optical illusion that resulted in individuals choosing a figure corresponding to a higher BMI. However, the way in which the FRS is applied does not appear to influence classification of nutritional status. We emphasize here the limitation of both methods of applying the FRS in diagnosing normal weight and therefore recommend that this instrument only be used when the aim of the study is to screen for underweight and overweight/obesity or that it be used in conjunction with another method of obtaining BMI (for example, reported measurements).
Furthermore, with regards using the FRS, both original (cards) and alternative (A4 sheet) methods of application overestimate prevalence of underweight and overweight/obesity. This may be related to the theory used in constructing the FRS, which is based on detecting “distortions” in perceived body size and thus seeking to identify individuals with extreme perceptions (Kakeshita et al., 2009). Thus, these overestimates may not be a problem for screening studies giving the chance to identify a greater number of individuals at “risk” of inappropriate nutritional status for further clinical investigation and determining diagnosis.
As for the nutrition status discriminatory capacity of the methods of obtaining BMI investigated here, the superiority of reported weight measurements stands out. These results corroborate those presented by Peixoto, Benício and Jardim (2006) and Lim, Seubsman and Sleigh (2009) reinforcing the quality of reported measurement for calculating BMI and classifying nutritional status. It can also be seen that the accuracy of reported measurements was shown to be higher than those found by methods applying the FRS for all types of nutritional status. The statis -tically significant differences found in nutritional status discriminatory capacity reinforce the superiority of reported measurements and the need for caution when using the FRS.
The results of this study may offer professionals/researchers from the area evidence of the validity of alternative methods to taking measure -ments for determining BMI and classifying nutritional status, enabling/ encouraging the undertaking of larger studies. We also believe that the proposal for the alternative method for applying the FRS, although it should be interpreted with caution for obtaining BMI, could be a viable alternative for classifying underweight and overweight/obesity, giving the possibility of broadening the results obtained as it evaluates individuals’ perceptions of their own body.
ACKNOWLEDGEMENTS
The São Paulo Research Foundation (FAPESP, grant #2015/02525-9) and the Coordination for the Improvement of Higher Education Personnel (CAPES) for financing the study.
REFERENCES
Bleil, R. A. T., Salay, E., & da Silva, M. V. (2009). Uso de medidas auto-referidas para avaliação do estado nutricional de adolescentes. Alimentos e Nutrição,
20(2), 335-341.
Carvalho, A. M., Piovezan, L. G., Selem, S. S. C., Fisberg, R. M., & Marchioni, D. M. L. (2014). Validação e calibração de medidas de peso e altura autorreferidas
por indivíduos da cidade de São Paulo. Revista Brasileira de Epidemiologia,
17(3), 735-746. doi: 10.1590/1809-4503201400030013
Kakeshita, I., Silva, A., Zanatta, D., & Almeida, S. (2009). Construção e fidedignidade teste-reteste de escalas de silhuetas brasileiras para adultos e crianças. Psicologia: Teoria e Pesquisa, 25(2), 263-270. doi: 10.1590/S0102-37722009000200015
Lim, L. L. Y., Seubsman, S., & Sleigh, A. (2009). Validity of selfreported weight, height, and body mass index among university students in Thailand: implications for population studies of obesity in developing countries.
Population Health Metrics, 7(15), 1-8. doi: 10.1186/1478-7954-7-15
Maranhão Neto, G. A., Polito, M. D., & Lira, V. A. (2005). Reliability between reported and measured weight and height, and influence of physical activity history on individuals who search for supervised practice of exercises.
Revista Brasileira de Medicina do Esporte, 11(2), 141-145. doi: 10.1590/
S1517-86922005000200009
Oliveira, L. P. M., Queiroz, V. A. O., Silva, M. C. M., Pitangueira, J. C. D., Costa, P. R. F., Demétrio, F., Assis, A. M. O. (2012). Índice de massa corporal obtido por medidas autorreferidas para a classificação do estado antropométrico de adultos: Estudo de validação com residentes no município de Salvador, estado da Bahia, Brasil. Epidemiologia e Serviço de Saúde, 21(2), 325-332. doi: 10.5123/S1679-49742012000200015
Peixoto, M. D. R. G., Benício, M. H. D. A., & Jardim, P. C. B. V. (2006). Validity of self-reported weight and height: The Goiânia study, Brazil. Revista de
Saúde Pública, 40(6), 1065-1072. doi: 10.1590/S0034-89102006000700015
Stunkard, A. J., Sörensen, T., & Schulsiger, F. (1983). Use of the Danish Adoption Register for the study of obesity and thinness. In S. S. Kety, L. P. Rowland, R. L. Sidman, & S. W. Matthysse (Eds.), The Genetics of Neurological and