CARBON SOURCES AND C:N RATIOS ON WATER QUALITY FOR NILE
TILAPIA FARMING IN BIOFLOC SYSTEM
1UGO LIMA SILVA2*, DARIO ROCHA FALCON2, MAURÍCIO NOGUEIRA DA CRUZ PESSÔA2,
EUDES DE SOUZA CORREIA3
ABSTRACT – The use of biofloc technology (BFT) can improve fish production in regions with low water availability. Therefore, information on dynamics of water quality is essential for success in fish rearing. Thus, the objective of the present study was to evaluate the water quality for Nile tilapia farming in a system without water exchange, during the fingerling stage, using different sources of carbon and C:N ratios. A completely randomized experimental design was used in a 2x3 factorial arrangement, with two carbon (C) to nitrogen (N) ratios (10:1 and 20:1) and three carbon sources (sugar, molasses and cassava starch). The C:N ratio and carbon source affected the variables alkalinity, settleable solids (SS), turbidity and total suspended solids (TSS), showing significantly higher values at C:N ratio of 20:1 (P < 0.05). The best carbon source for microbial floc formation were the molasses and sugar, under C:N ratios of 10:1 and 20:1. The stability of the monitored water quality parameters occurred from 6 to 7 weeks of rearing. The growth performance of Nile tilapia in BFT system fertilized with different organic carbon sources was not significantly different (P < 0.05) between treatments. The use of molasses to fertilize BFT systems can reduce costs of production in regions where this product is available.
Keywords: Oreochromis niloticus. Fish farming. Microbial flocs. Fingerling stage.
FONTES DE CARBONO E RELAÇÕES C:N NA QUALIDADE DA ÁGUA NO CULTIVO DE TILÁPIA DO NILO EM SISTEMA DE BIOFLOCO
RESUMO – O uso da tecnologia de biofloco (BFT) pode contribuir para a produção de peixes em regiões com reduzida água. Portanto, compreender a dinâmica da qualidade da água é essencial para o sucesso do cultivo de peixes. O objetivo do presente estudo foi avaliar a qualidade da água no cultivo de tilápia do Nilo em sistema sem troca de água, durante a fase de alevinagem, utilizando diferentes fontes de carbono e relações C:N. O delineamento experimental utilizado foi o arranjo fatorial 2x3, contendo duas relações carbono (C) e nitrogênio (N) (10:1 e 20:1) e três fontes de carbono (açúcar, melaço e amido de mandioca). Ambas as relações C:N e fontes de carbono influenciaram as variáveis alcalinidade, sólidos sedimentáveis (SS), turbidez e sólidos suspensos totais (SST) demonstrando valores significativamente mais elevados na relação C:N 20:1 (P < 0,05). As melhores fontes de carbono para a formação de flocos microbianos foram observados na utilização do melaço e açúcar na relação C:N de 10:1 e 20:1. A estabilidade dos parâmetros de qualidade de água monitorados ocorreu entre a 6 e 7 semanas de cultivo. O desempenho de tilapia do Nilo em sistema BFT fertilizado com diferentes fontes de carbono orgânico não foi significativamente diferente (P < 0,05) entre os tratamentos. A escolha de melaço para a fertilização do sistema BFT também pode ajudar a reduzir o custo de produção em regiões onde há disponibilidade deste produto.
Palavras-chave: Oreochromis niloticus.Piscicultura. Flocos microbianos. Alevinagem.
____________________ *Corresponding author
1Received for publication in 04/06/2016; accepted in 03/02/2017.
Paper extracted from the first author’s Doctoral’s thesis, funded by CNPq and FACEPE.
2Academic unit of Serra Talhada, Universidade Federal Rural de Pernambuco, Serra Talhada, PE, Brazil; [email protected],
Rev. Caatinga
INTRODUCTION
The Brazilian aquaculture production consists mainly of tilapia (Oreochromis sp.), shrimp
(Litopenaeus vannamei) and some native species as
tambaqui (Colossoma macropomum and its hybrids) (FAO, 2014). According to Avnimelech (2009) and Pérez-Fuentes et al. (2016), tilapia can be produced in different farming systems, and adapt to the super-intensive system based on biofloc technology (BFT).
BFT system carried out with minimal changes in water stimulates the formation of a predominantly aerobic and heterotrophic biota, which is induced through water fertilization with sources rich in organic carbon and constant aeration of the environment (WASIELESKY et al., 2006; AZIM; LITTLE, 2008; AVNIMELECH, 2009). The carbon
sources applied in BFT system are usually by-products derived from animal or human food
industry. However, some conditions must be met to select them, such as cost, local availability, biodegradability and assimilation efficiency by bacteria. The most commonly used sources are molasses, glycerol, vegetable sugar and bran (wheat, corn, rice and cassava) (EMERENCIANO; GAXIOLA; CUZON, 2013).
BFT farming systems do not discharge waste into water bodies, thus, pressures on the environment are mitigated, contributing to the expansion of aquaculture production (DESCHRYVER et al., 2008; AHMAD et al., 2016). The use of BFT allows us to control inorganic nitrogen by adding carbohydrates as energy source, inducing the conversion of this nitrogen by microorganisms present in the biofloc into microbial biomass, which is a good food source for fish (AVNIMELECH, 2009; PÉREZ-FUENTES et al., 2016; VILANI et al., 2016; WEI; LIAO; WANG, 2016).
Systems with decreased water renewal represent technical and environmental advancements, which are essential for modern and responsible aquaculture. Water quality management is critical in farming systems. Moreover, accumulation of toxic forms of inorganic nitrogen is one of the most significant problems related to water quality in intensive systems (AVNIMELECH, 2009). Even at low concentrations, ammonia (NH3) and
nitrite (NO2) are highly toxic to aquatic animals
(BOYD; TUCKER, 1998).
Setting water C:N ratio is key to controlling inorganic nitrogen and the consequent development of microbial flocs, which indicates the availability and competition for organic carbon and ammonia (SAMOCHA et al., 2007; AVNIMELECH, 2009; AVNIMELECH, 2014; NOOTONG; PAVASANT; POWTONGSOOK, 2011; EMERENCIANO; GAXIOLA; CUZON, 2013; PÉREZ-FUENTES et al., 2016; VILANI et al., 2016). In high C:N conditions, heterotrophic bacteria compete with
autotrophic bacteria for dissolved oxygen and space. However, in low C:N ratios, autotrophic organisms are favored (MICHAUD et al., 2006).
An optimal C:N ratio can improve production and recycling of nutrients. According to Burford et al. (2003) and Pérez-Fuentes et al. (2016), C:N ratio must be above 10:1, however, according to Schneider et al. (2005), the best C:N ratio is approximately 15:1. Wasielesky et al. (2006) found optimal C:N ratios for microbial floc formation from 14:1 to 30:1, with predominance of heterotrophic bacteria. Molasses were used for tilapia rearing by Widanarni, Ekasari and Maryam (2012) (C:N ratio of 15:1) and Lima et al. (2015) (C:N ratio of 6:1).
Studies have been motivated by the urgent need to find the best carbon source for aquaculture systems based on biofloc technology (WEI; LIAO; WANG, 2016; ZHANG et al., 2016). Many sources of carbon have been tested in BFT systems, such as grain, sugar, molasses, sugarcane bagasse, chopped hay and tapioca. The sources must be chosen considering their cost and local availability (HARGREAVES, 2013; FUGIMURA et al., 2015; SERRA et al., 2015; AHMAD et al., 2016).
Information on optimal C:N ratios for fish rearing is fundamental to understand the limnological dynamics and to develop a rational protocol of water fertilization to rear aquatic organisms in areas with reduced water availability. Thus, the objective of the present study was to evaluate the water quality in a Nile tilapia
(Oreochromis niloticus) farming system without
water exchange, during the fingerling stage, using different carbon sources and C:N ratios.
MATERIAL AND METHODS
The experiment was conducted in the Aquaculture Laboratory of the Federal Rural University of Pernambuco, in Serra Talhada, Pernambuco, Brazil, from April to June 2014.
Circular fiberglass tanks (1000 L) with 800 L of water were used for the experiment. The water used was filtered through a 200 µm mesh and individually aerated with four aeration stones, supplied by a radial compressor (2 HP). The tanks were placed in a hatchery under a shade screen of 75%, receiving natural light, and covered with screens to prevent the animals to escape.
A completely randomized experimental design was used in a 2x3 factorial arrangement, with two carbon (C) to nitrogen (N) ratios (10:1 and 20:1), and three carbohydrate sources (molasses, ML10 and ML20; sugar, SG10 and SG20; and cassava starch, CS10 and CS20), with four replications.
Dolomitic limestone was used in order to
performed, except to correct evaporation losses. The water used was from a local artesian well, and did not receive biofloc inoculum or microalgae.
Carbohydrates were daily added to induce a heterotrophic medium. The amount of carbohydrates
was calculated based on the carbon to nitrogen ratio (C:N). The amount of nitrogen
converted into ammonia (ΔN) in the feed was calculated according to the Equation 1 (ΔCarbohydrate = [ΔN x (C:N)] x %C-1), in which %C is
the percentage of carbon in the sources of
carbohydrates, i.e., 0.22 (molasses), 0.31
(sugar) and 0.46 (cassava starch) g g-1 carbon.
The carbon content in the carbohydrate (%C) was calculated according to the Equation 2 (ΔN = QFeed x %NFeed x %NExcretion), in which QFeed is
the daily amount of feed supplied, %NFeed is the
percentage of nitrogen input to the system (% crude protein x 6.25-1) and %N
Excretion is the
percentage of ammonia in water, directly or indirectly input by microbial excretion and degradation of organic nitrogen waste (0.5), which were analyzed in the Fundamental Chemistry Laboratory of the Federal University of Pernambuco.
The amount of carbohydrate added to the experimental units to reach the C:N ratio of each treatment was calculated using Equations 1 and 2 (SAMOCHA et al., 2007; AVNIMELECH, 2009).
Sexually reversed fingerlings of Nile tilapia with average weight of 1.68±0.05 g were obtained from a commercial fish farm and stored in experimental tanks at density of 300 fingerlings m-3.
The commercial feed supplied had 10% of moisture, 45.5% of crude protein, 8.1% of ether extract, 2.7% of crude fiber and 16% of mineral matter. The fish were fed ad libitum four times a day (7h30, 10h30, 13h30 and 16h30) at a feed rate that varied from 4 to 3% during the rearing.
The water temperature (°C), dissolved oxygen (mg L-1), electrical conductivity (mS cm-1), pH and
redox potential (mV) were daily monitored with a multi-parameter instrument (YSI ProPlus). Water transparency (cm) was measured with a Secchi disk and salinity was measured with an optical refractometer.
Water samples were collected weekly to
evaluate the total ammonia nitrogen (TAN) [mg N - (NH4 + NH3) L-1], nitrite (mg N-NO
2 L-1),
nitrate (mg N-NO3 L-1), inorganic phosphate
(mg P-PO4 L-1), alkalinity (mg CaCO3 L-1), turbidity
(NTU), settleable solids (mL L-1) and total
suspended solids (mg L-1). TAN, nitrite, nitrate,
inorganic phosphate and alkalinity were measured with a photometer (YSI 9500), based on the following methods: indophenol, nitricol, nitratest, vanadomolybdate and alkaphot, respectively. The
settleable solids (SS) and turbidity were measured with a Imhoff cone (AVNIMELECH, 2009) and a turbidimeter Alfakit, respectively. Organic (fixed solids, FS) and inorganic (volatile solids, VS) fractions were assessed through analyses of total suspended solids (TSS) (APHA, 1995).
Fish growth was monitored once every two weeks by means of biometrics in samples equivalent to 10% of the initial population of each experimental plot. All fish were weighed at the beginning and ending of rearing (after 63 days), using a precision scale (0.01 g). The final average weight, biomass, feed conversion and survival of the fishes were calculated at the end of the experiment. Regional fertilization costs, commercial values and availability of the different organic carbon sources were assessed.
All data were subjected to the Shapiro-Wilk (normality) and Bartlett (homoscedasticity) tests at significance level of 5%. All data showed normality of the sample and homogeneity of variance, thus, analysis of variance (two-way ANOVA) was applied to determine significant differences (P < 0.05) between treatments. Tukey’s test was used to compare means between treatments when needed, at significance level of 5%. These analyses are consistent with Zar (1996).
RESULTS AND DISCUSSION
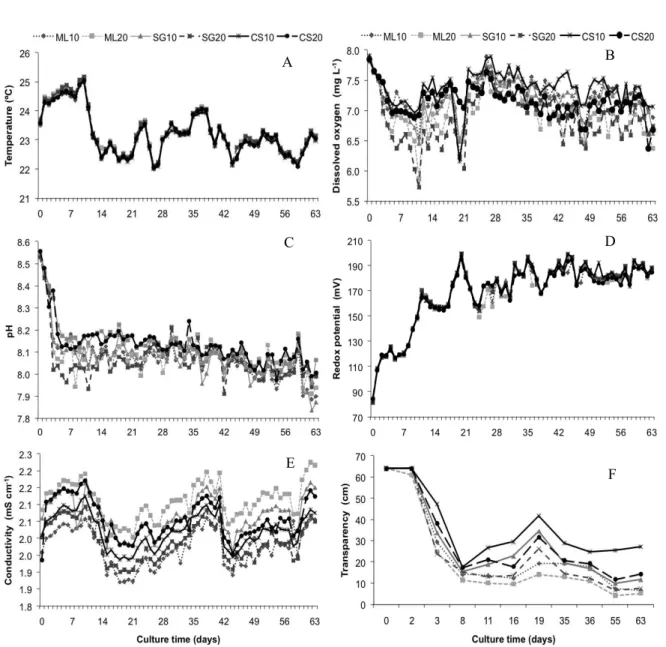
Control and management of physical, chemical, biological and technological variables determine the water quality in intensive fish production systems and consequently, the success in discharging good water quality into the environment. Variations of physicochemical parameters of water are presented in Figure 1.
The water mean (±SD) temperature (23.2±0.8ºC), dissolved oxygen (7.1±0.4 mg L-1), pH
(8.1±0.1), redox potential (168.2±25.2 mV), conductivity (2.0±0.1 mS cm-1) and salinity
(0.3±0.8 ‰) of the treatments showed no significant differences (P > 0.05). Treatments with cassava starch (CS10) had significantly greater water transparency than the other treatments (P < 0.05), denoting the low values of settleable solids and confirming no formation of bioflocs in these treatments. Thus, the suspended solids found were related only to particles originating from other sources, such as feed, scales and feces, and not from bioflocs. The increased water transparency at the 19th day of rearing were probably caused by the
Rev. Caatinga
A
1
1
BC
1
1
DE
1
F
1
Figure 1. Temporal variation of the water daily mean temperature (°C) (A), dissolved oxygen (mg L-1) (B), pH (C), redox
potential (mV) (D), conductivity (mS cm-1) (E) and transparency (cm) (F) during Nile tilapia rearing without water
exchange, adding molasses (ML), sugar (SG) and cassava starch (CS) and using carbon (C) to nitrogen (N) ratios of 10:1 and 20:1.
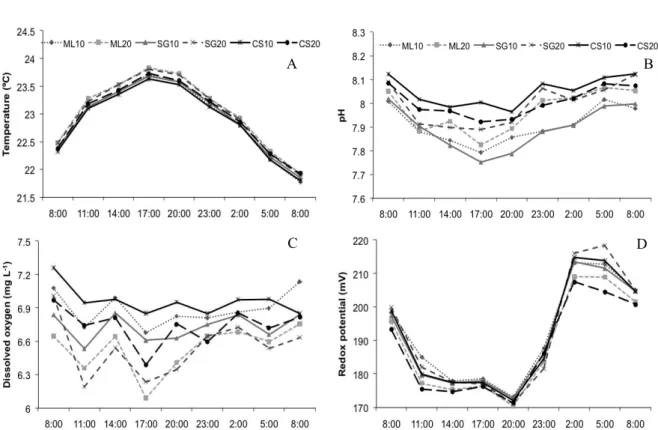
The circadian variations of physical and chemical parameters (water temperature, dissolved oxygen, pH and redox potential) at the end of rearing (63rd day) are shown in Figure 2. The experiment
was conducted in the semiarid region of the Pernambuco, where the average air temperature is 32°C, thus, the temperatures registered during the
experimental period were low for this region (<22°C), which contributed to reduce the
temperature in the water tanks. Thus, the temperature remained outside the comfort range of the species (25 to 29°C), affecting the fish survival rate (BOYD;
TUCKER 1998).
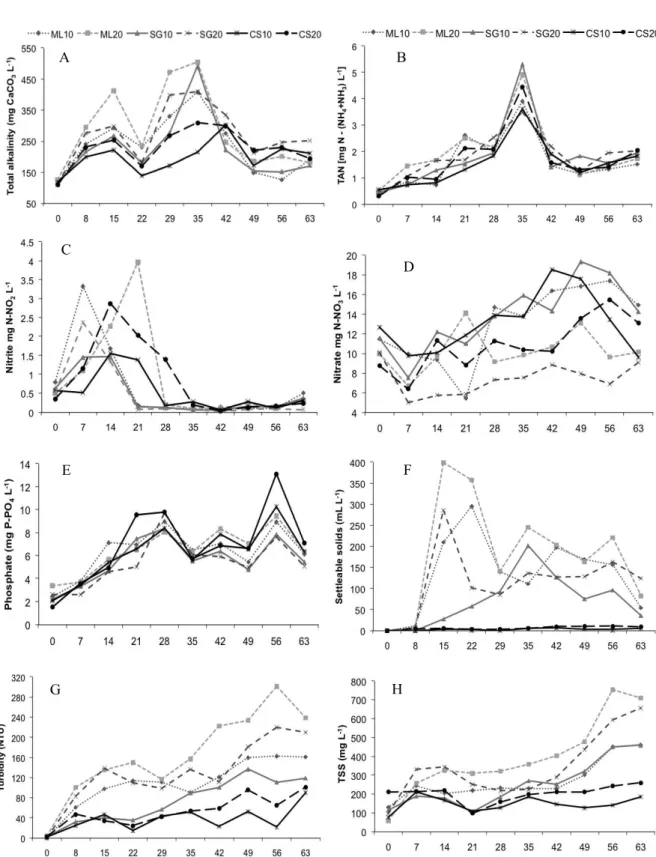
The water quality variables were measured weekly, during the 63 days of Nile tilapia rearing without water exchange (Table 1 and Figure 3). The water total ammonia nitrogen (TAN), nitrite nitrogen
(N-NO2) and inorganic phosphate phosphorus
(P-PO4) of the treatments were similar (P > 0.05).
The water quality variables were within the acceptable levels for Nile tilapia rearing, except temperature, total ammonia nitrogen (TAN) and nitrite (N-NO2), which were outside the comfort
A
1
1
BC
1
1
DFigure 2. Circadian variation of water temperature (°C) (A), pH (B), dissolved oxygen (mg L-1) (C) and redox potential
(mV) (D) at the end of fingerling stage of Nile tilapia reared without water exchange, adding molasses (ML), sugar (SG) and cassava starch (CS) and using carbon (C) to nitrogen (N) ratios of 10:1 and 20:1.
Table 1. Mean values (±SD) of physical and chemical parameters of water after 63 days of Nile tilapia rearing without water exchange, using Carbon (C) to nitrogen (N) ratios of 10:1 and 20:1, adding molasses (ML), sugar (SG) and cassava starch (CS).
Variables C:N Ratios Carbon sources
ML SG CS
Alkalinity (mg CaCO3 L-1)
10:1 225.0 ± 18.1 Aa1 233.2 ± 32.6 Aa 198.0 ± 17.0 Aa 20:1 301.8 ± 11.2 Ba 272.7 ± 34.6 Bab 223.7 ± 5.7 Bb
TAN (mg L-1) 10:1 20:1 1.7 ± 0.1 2.0 ± 0.3 2.0 ± 0.8 2.0 ± 0.3 1.6 ± 0.4 1.9 ± 0.4
N-NO2 (mg L-1) 10:1 0.6 ± 0.0 0.5 ± 0.1 0.5 ± 0.4 20:1 0.7 ± 0.1 0.5 ± 0.0 1.1 ± 0.5
N-NO3 (mg L-1) 10:1 20:1 12.4 ± 1.1 A 9.3 ± 1.1 B 13.6 ± 3.4 A 6.8 ± 0.6 B 13.6 ± 1.3 A 11.3 ± 0.2 B
P-PO4 (mg L-1) 10:1 6.7 ± 0.9 5.7 ± 0.9 6.6 ± 0.3 20:1 6.5 ± 1.6 5.9 ± 1.2 7.6 ± 1.4
SS (mL L-1) 10:1 162.3 ± 70.8 Aa 80.3 ± 17.7 Aab 3.5 ± 1.1 Ab 20:1 201.8 ± 80.4 Ba 124.2 ± 32.7 Bab 5.1 ± 2.1 Bb
Turbidity (NTU) 10:1 107.8 ± 4.7 Aa 86.0 ± 15.1 Aa 40.2 ± 7.1 Ab 20:1 195.6 ± 39.5 Ba 150.7 ± 26.9 Ba 57.8 ± 3.8 Bb
TSS (mg L-1) 10:1 255.3 ± 34.2 Aab 278.7 ± 46.4 Aa 154.9 ± 33.9 Ab 20:1 435.6 ± 90.2 Ba 357.7 ± 29.4 Bab 214.7 ± 13.3 Bb
ANOVA two-way
Factors Alkalinity TAN N-NO2 N-NO3 P-PO4 SS Turbidity TSS
C:N P < 0.001 n.s. n.s. P < 0.001 n.s. P < 0.05 P < 0.001 P < 0.001 Carbon
sources P < 0.001 n.s. n.s. n.s. n.s. P < 0.001 P < 0.001 P < 0.001 Interaction n.s.2 n.s. n.s. n.s. n.s. n.s. P < 0.05 n.s.
1Means followed by lowercase letter in the rows or uppercase letter in the columns are significantly different by the
Tukey’s test (P < 0.05); 2n.s.= not significant (P > 0.05); Means not followed by letters do not differ significantly;
TAN = Total ammonia nitrogen; N-NO2 = Nitrogen nitrite; N-NO3 = Nitrogen nitrate; P-PO4 = Inorganic phosphate
Rev. Caatinga A
1
1
BC
1
D
1
E
1
1
FH
1
G1
Figure 3. Weekly variation of quality of water used for Nile tilapia rearing without water exchange, adding molasses (ML), sugar (SG) and cassava starch (CS) and using carbon (C) to nitrogen (N) ratios of 10:1 and 20:1. A - Total alkalinity
(mg CaCO3 L-1), B - Total ammonia nitrogen (TAN) [mg N - (NH4 + NH3) L-1], C - Nitrite nitrogen (mg N-NO2 L-1),
D - Nitrate nitrogen (mg N-NO3 L-1), E - Inorganic phosphate phosphorus (mg P-PO4 L-1), F - Settleable solids (mL L-1),
G - Turbidity (NTU), H - Total suspended solids (mg L-1).
Although the average concentrations of ammonia were higher than 1.0 mg N L-1 and N-NO
2
higher than 0.5 mg N L-1 during the first weeks of
rearing, all treatments showed levels well above the
reduce ammonia levels in fish rearing environments, including nitrification, denitrification, mineralization, photosynthesis and assimilation by heterotrophic bacteria (EBELING; TIMMONS; BISOGNI, 2006). Ammonia oxidizing bacteria biologically convert ammonia to nitrite, which is oxidized to nitrate by nitrite oxidizing bacteria.
The nitrogen nitrate (N-NO3) concentrations
at the beginning of rearing were from the water source, a local geological well (Figure 3-D), which coincide with the analysis of the sources of supply.
N-NO3 concentrations were significantly higher
(P < 0.05) in the C:N ratio of 10:1, probably due to the high efficiency of the nitrification process under this ratio. The main factors that affect nitrification
rate are ammonia and nitrite concentrations, C:N ratio, dissolved oxygen, pH, temperature and
alkalinity (EBELING; TIMMONS; BISOGNI, 2006). Unlike algae, microbial populations are more stable and independent of light conditions (AVNIMELECH, 2006). The control of nitrogen concentrations depends on manipulation of the balance between organic carbon and inorganic nitrogen (C:N) contents, which has been frequently used to indicate the quality of organic substrates in aquaculture ponds (CRAB et al., 2012).
The C:N ratios and carbon sources used affected the water alkalinity, settleable solids (SS), turbidity, and total suspended solids (TSS), with significantly higher values in the C:N ratio of 20:1 (P < 0.05) (Table 1).
Alkalinity and pH may reduce due to inorganic carbon consumption by autotrophic and heterotrophic bacteria that form the microbial biomass (EBELING; TIMMONS; BISOGNI, 2006; PÉREZ-FUENTES et al., 2016; MARTINS et al., 2017). According to Martins et al. (2017), the use of sodium bicarbonate, calcium hydroxide or carbonate is effective to correct alkalinity and pH on BFT systems.
Treatments with C:N ratio of 20:1 showed significantly higher alkalinity (P < 0.05) than those with C:N ratio of 10:1. This result was probably due to an insufficient number of nitrifying bacteria that consume alkalinity in the C:N ratio of 20:1. According to Chen, Ling and Blancheton (2006), each gram of ammonia nitrogen that is oxidized to N-NO3 consumes about 7.07 g of alkalinity to
produce 0.17 g of bacterial biomass. Ebeling,
Timmons and Bisogni (2006) estimated that 3.57 g of alkalinity are consumed for every gram of
TAN assimilated into microbial biomass, to produce 8.07 g of biomass.
The addition of cassava starch (C:N ratio of 16:1) in the rearing water was used by Nootong, Pavasant and Powtongsook (2011), to assess the efficacy of assimilation through biofloc and nitrification in rearing tanks without water exchange. According to Nootong, Pavasante and Powtongsook
(2011), complete nitrification requires 6 to 7 weeks to stabilize in tilapia rearing systems without water exchange.
The decrease in N-NO2 and TAN
concentrations to stabilization at low levels was not controlled in the rearing. The concentration of N-NO3 tended to increase over the weeks of rearing,
confirming that the variations of nitrogen compounds (Figures 3B, 3C and 3D) did not prevent the nitrification process.
The addition of organic carbon (molasses, sugar, rice bran or cassava starch) in rearing tanks accelerates the growth of heterotrophic bacteria and stimulates a faster nitrogen absorption, compared with conventional rearing systems, such as those containing clear water, which receive only feed and have low C:N ratios (AVNIMELECH, 2009; WASIELESKY et al., 2006; EMERENCIANO; GAXIOLA; CUZON, 2013; VILANI et al., 2016). Organic carbon stimulates the growth of heterotrophic bacteria, whose growth rate is about 10 times faster than nitrifying bacteria (HARGREAVES, 2013).
The accumulation of total suspended solids (TSS) was significant during the rearing period in the molasses and sugar treatments. TSS can reach 1000 mg L-1 over the rearing period under biofloc
technology (AVNIMELECH, 2009), although according to Avnimelech (2014), it should not
exceed the minimum and maximum limits of 600 to 800 mg L-1. In this study, the maximum
values of TSS reached 750 mg L-1 (ML20),
associated with a slow increase of bioflocs in the CS treatments, as observed in low concentrations of SS, turbidity and TSS. This slow increase in bioflocs through the addition of CS may be due to its composition compared to other carbon sources. Molasses and sugar are simple carbohydrates, easily assimilated by bacteria, while cassava starch is constituted of complex carbohydrates, polysaccharides, which need to be broken down to be assimilated by bacteria. Thus, the CS treatment showed significantly reduced SS (P < 0.05) compared to the other treatments, confirming that there were no bioflocs in these treatments.
Rev. Caatinga
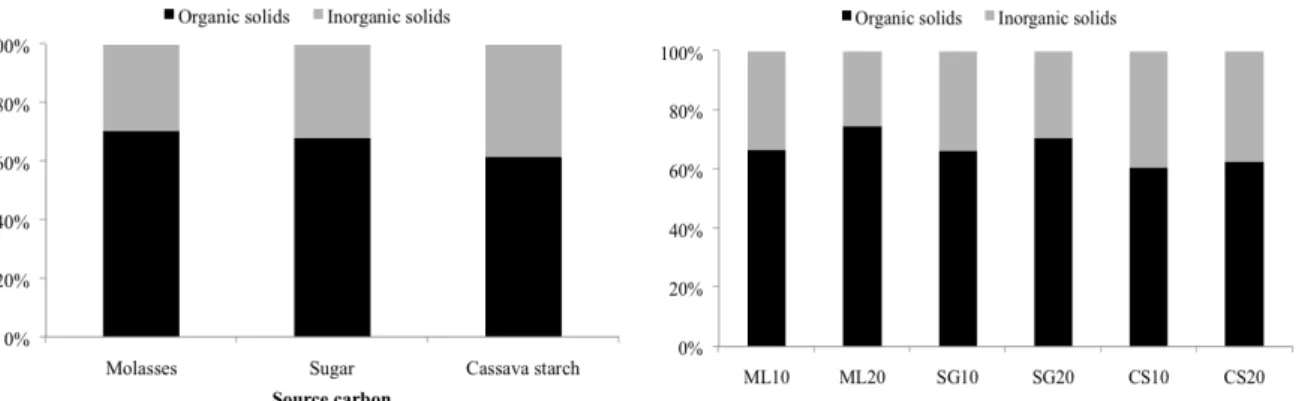
The suspended solids related to organic (67%) and inorganic solids (33%) are shown in Figure 4-A. The applications of different carbon sources to induce a heterotrophic medium resulted in different organic to inorganic ratios (Figure 4-B). Significantly higher percentages of organic solids
were found in treatments with molasses (70%), compared with those in treatments with cassava starch (64%), which showed higher percentages of inorganic solids (36%). This result may be related to the ash and minerals involved in the processing of cassava starch.
Figure 4. A - Organic and inorganic solids fractions in the water used for Nile tilapia rearing using different carbon sources;
B - Organic and inorganic solids fraction in the water used for Nile tilapia rearing using carbon (C) to nitrogen (N) ratios of
10:1 and 20:1, adding molasses (ML), sugar (SG) and cassava starch (CS).
The results of the Nile tilapia growth performance are shown in Table 2. The variables initial and final weight, final biomass, feed
conversion and survival of the Nile Tilapia of the
treatments showed no significant differences (P > 0.05).
Variables C:N 10:1 C:N 20:1
ML SG CS ML SG CS
Initial weight (g) 1.7 ± 0.0 1.7 ± 0.1 1.7 ± 0.0 1.6 ± 0.0 1.7 ± 0.1 1.6 ± 0.0 Final weight (g) 14.7 ± 0.5 14.2 ± 1.2 13.4 ± 3.1 13.2 ± 0.7 15.7 ± 2.3 13.8 ± 1.4 Final biomass
(Kg m-3) 1.4 ± 0.5 1.4 ± 0.2 0.8 ± 0.2 1.1 ± 0.3 1.3 ± 0.1 1.3 ± 0.2 FCR1 1.7 ± 0.5 1.6 ± 0.5 2.5 ± 1.5 2.5 ± 1.2 1.6 ± 0.2 1.7 ± 0.4 Survival (%) 31.5 ± 7.4 34.2 ± 8.6 22.5 ± 11.2 29.3 ± 10.9 29.2 ± 7.3 31.8 ± 10.4 Table 2. Mean (±SD) growth performance of Nile tilapia(300 fingerlings m-3) rearedfor 63 days without water exchange,
using carbon (C) to nitrogen (N) ratios of 10:1 and 20:1, adding molasses (ML), sugar (SG) and cassava starch (CS).
1FCR= feed conversion ratio = (supplied feed count) (biomass gained)-1. ML = molasses; SG = sugar; CS = cassava
starch. Means not followed byletters do not differ significantly (P > 0.05).
The oscillations in water quality variables during the first six weeks of rearing and the decrease in water temperature probably contributed to the low growth performance of the fishes, as a result of cumulative exposure to stressors, resulting in the decline of organic resistance. Fishes at the fingerling stage are more susceptible to sudden changes in water parameters because of their rapid metabolism compared with other development stages. Starting a system without water exchange to inducing heterotrophic conditions causes constant changes in water quality that can hinder the growth performance of tilapia resulting in high mortality rates during rearing in the fingerling stage (Figure 5-B).
The average weight (g) and survival rate (%) as a function of rearing time of Nile tilapia
fingerlings throughout the experiment without water exchange are shown in Figure 5. During the experimental period, fish growth ranged from 1.68 to 14.17 g as shown in Figure 5-A.
The costs of fertilization with these three organic carbon sources evaluated in the BFT systems of Nile tilapia showed that cassava starch had the
highest (US$ 1.14) and molasses the lowest (US$ 0.28) costs (Table 3). However, Fugimura et al.
A
1
1
B
Figure 5. Evolution of the growth (A) and survival (B) of Nile tilapia reared without water exchange for 63 days, using carbon (C) to nitrogen (N) ratios of 10:1 and 20:1, adding molasses (ML), sugar (SG) and cassava starch (CS).
Table 3. Costs of organic carbon sources for organic fertilization in BFT for Nile tilapiafingerlings.
Source of organic carbon C:N Ratio TAU1 (kg) US$ kg-1 TC2 (US$)
Molasses 10:1 1.18 0.25 0.29
20:1 1.13 0.28
Sugar 10:1 1.09 0.42 0.46
20:1 1.12 0.47
Cassava starch 10:1 20:1 0.97 1.07 1.12 1.09 1.19
1TAU = Total amount of organic carbon sources used; 2TC = Total cost of organic fertilization during the study.
The monitoring of water quality conducted provided data to understand the dynamics of water quality, however, further experiments using BFT in water, beginning with presence of microbial flocs, should be conducted to assess the fish performance.
The results found can contribute to optimize the tilapia production with biofloc technology, particularly with regard to the recycling of feed and reduction of water use, the decreasing of discharges of nutrients into the environment, and lowering production costs. Moreover, monitoring the system development requires special attention to rapidly respond to negative changes that could affect the fish organic homeostasis.
CONCLUSIONS
The growth performance of Nile tilapia in BFT system fertilized with different organic carbon sources was not significantly different between treatments. Starting a BFT system causes constant variations of water quality parameters, hindering the performance of tilapia fingerlings. Molasses and sugar as a source of organic carbon in the C:N ratio of 10:1 and 20:1 can be used for rearing Nile tilapia with biofloc technology. The choice of molasses for fertilization of the BFT system can reduce the cost of production in regions where this product is available.
ACKNOWLEDGMENTS
The authors thank the Foundation for Science and Technology of the State of Pernambuco (FACEPE) for granting a doctoral scholarship to the first author and the National Council for Scientific and Technological Development (CNPq) and the FACEPE for their financial support.
REFERENCES
AHMAD.H, I. et al. Growth, non-specific immunity and disease resistance of Labeo rohita against
Aeromonas hydrophila in biofloc systems using
different carbon sources. Aquaculture, Amsterdam, v. 457, n. 20, p. 61-67, 2016.
APHA. Standard methods for the examination of water and wastewater. 19. ed. Washington, US: A.P.H.A/ A.AW.W.A / W.E.F, 1995. 1082 p.
AVNIMELECH, Y. Bio-filters: The need for a new comprehensive approach. Aquacultural Engineering, Oxford, v. 34, n. 3. p. 172-178, 2006. AVNIMELECH, Y. Biofloc Technology: a practical guide book. 2. ed. Baton Rouge, US: The World Aquaculture Society, 2009. 182 p.
Rev. Caatinga
AZIM, M. E.; LITTLE, D. C. The biofloc technology (BFT) in indoor tanks: Water quality, biofloc composition, and growth and welfare of Nile tilapia (Oreochromis niloticus). Aquaculture, Amsterdam, v. 283, n. 1-4, p. 29-35, 2008.
BOYD C. E.; TUCKER, C. S. Pond aquaculture water quality management. 1ª. ed. Kluwer Academic Publishers, Norwell, MA. 1998. 685 p.
BURFORD, M. A. et al. Nutrient and microbial dynamics in high-intensity, zero-exchange shrimp ponds in Belize. Aquaculture, Amsterdam, v. 219, n. 1-4, p. 393-411, 2003.
CHEN, S.; LING, J.; BLANCHETON, J. P. Nitrification kinetics of biofilm as affected by water quality factors. Aquacultural Engineering, Oxford, v. 34, n. 3, p. 179-197, 2006.
CRAB, R. et al. Biofloc technology in aquaculture: beneficial affects and future challenges. Aquaculture, Amsterdam, v. 356-357, n. 1, p. 351-356, 2012.
DESCHRYVER, P. R. et al. The basics of bio-flocs technology: the added value for aquaculture. Aquaculture, Amsterdam, v. 277, n. 3-4, p. 125-137, 2008.
EBELING, J. M.; TIMMONS, M. B.; BISOGNI, J. J. Engineering analysis of the stoichiometry of photoautotrophic, autotrophic, and heterotrophic removal of ammonia-nitrogen in aquaculture systems. Aquaculture, Amsterdam, v. 257, n. 1-4, p. 346-358, 2006.
EMERENCIANO, M.; GAXIOLA, G.; CUZON, G. Biofloc technology (BFT): a review for aquaculture application and animal food industry. 2013. Disponível em: <http://dx.doi.org/10.5772/53902>. Acesso em: 15 jun. 2015.
FOOD AND AGRICULTURE
ORGANIZATION - FAO. Fishery Information, Data and Statistics Unit. FishStat plus: universal software for fishery statistical time series. Version 2.3. Rome. 2014. Disponível em: <http:// www.fao.org/fi/statist/FISOFT/FISHPLUS.asp>. Acesso em: 01 dez. 2014.
FUGIMURA, M. M. S. et al. Brewery residues as a source of organic carbon in Litopenaeus schmitti
white shrimp farms with BFT systems. Aquaculture International, Amsterdam, v. 23, n. 2, p. 509-522, 2015.
HARGREAVES, J. A. Biofloc production systems for aquaculture. Southern regional Aquaculture Center, United States Department of Agriculture,
National Institute of Food and Agriculture. n. 4503, 2013, 12 p.
LIMA, E. C. R. et al. Cultivo da tilápia do Nilo
Oreochromis niloticus em sistema de bioflocos com
diferentes densidades de estocagem. Revista Brasileira de Saúde e Produção Animal, Salvador, v. 16, n. 4, p. 948-957, 2015.
MARTINS, G. B. et al. The utilization of sodium bicarbonate, calcium carbonate or hydroxide in biofloc system: water quality, growth performance and oxidative stress of Nile tilapia (Oreochromis
niloticus). Aquaculture, Amsterdam, v. 468, n. 1, p.
10-17, 2017.
MICHAUD, L. et al. Effect of particulate organic carbon on heterotrophic bacterial populations and nitrification efficiency in biological filters. Aquacultural Engineering, Oxford, v. 34, n. 3, p. 224-233, 2006.
NOOTONG, K.; PAVASANT, P.; POWTONGSOOK, S. Effects of organic carbon addition in controlling inorganic nitrogen concentrations in a biofloc system. Journal of the World Aquaculture Society, Baton Rouge, v. 42, n. 3, p. 339-346, 2011.
PÉREZ-FUENTES, J. A. et al. C:N ratios affect nitrogen removal and production of Nile tilapia
Oreochromis niloticus raised in a biofloc system
under high density cultivation. Aquaculture, Amsterdam, v. 452, n. 1, p. 247-251, 2016.
SCHNEIDER, O. et al. Analysis of nutrient flows in integrated intensive aquaculture systems. Aquacultural Engineering, Oxford, v. 32, n. 3-4, p. 379-401, 2005.
SAMOCHA, T. M. et al. Use of molasses as carbon source in limited discharge nursery and grow-out systems for Litopenaeus vannamei. Aquacultural Engineering, Oxford, v. 36, n. 2, p. 184-191, 2007. SERRA, F. P. et al. Use of different carbon sources for the biofloc system adopted during the nursery and grow-out culture of Litopenaeus vannamei. Aquaculture International, Amsterdam, v. 23, n. 6, p. 1325-1339, 2015.
VILANI, F. G. et al. Strategies for water preparation in a biofloc system: Effects of carbon source and fertilization dose on water quality and shrimp performance. Aquacultural Engineering, Oxford, v. 74, n. 1, p. 70-75, 2016.
shrimp Litopenaeus vannamei. Aquaculture, Amsterdam, v. 258, n. 1-4, p. 396-403, 2006.
WIDANARNI.; EKASARI, J.; MARYAM, S. Evaluation of biofloc technology application on water quality and production performance of red tilapia Oreochromis sp. cultured at different stocking densities. Hayati Journal of Biosciences, Hayati, v. 19, n. 2, p. 73-80, 2012.
WEI, Y.; LIAO, S.; WANG, A. The effect of different carbon sources on the nutritional composition, microbial community and structure of bioflocs. Aquaculture, Amsterdam, v. 465, n. 1, p. 88-93, 2016.
ZAR, J. H. Biostatistical analysis. New Jersey: Prentice Hall. 1996. 662 p.