EFFECT OF POTASSIUM FERTILIZATION ON YIELD AND
NUTRITION OF YERBA MATE (Ilex paraguariensis)
(1)Delmar Santin(2), Eliziane Luiza Benedetti(3), Nairam Félix de Barros(4), Igor Carvalho de Almeida(5), Greice Pereira Leal(6), Lucas Fontes(5), Júlio César Lima Neves(7), Ivar
Wendling(8) & Carlos Bruno Reissmann(9)
SUMMARY
Yerba mate (Ilex paraguariensis) is a tree species native to the subtropical regions of South America, and is found in Brazil predominantly in the southern region. Despite the historical importance in this region, so far, studies on crop nutrition to improve yields are scarce. Thus, this study evaluated the effect of potassium rates on K soil availability, and the yield and nutritional status of yerba mate. The experiment was conducted in São Mateus do Sul, State of Paraná, on a Humox soil, where K2O rates of 0, 20, 40, 80, 160, and 320 kg ha-1 were tested on 7-year-old plantations. The experiment was harvested 24 months after installation by removing approximately 95 % of the canopy that had sprouted from the previous harvest. The soil was evaluated for K availability in the layers 0-10, 0-20, 10-20, and 20-40 cm. The plant parts leaf fresh matter (LM), twigs (TW), thick branches (BR) and commercial yerba mate (COYM), i.e., LM+TW, were analyzed. In addition, the relationship between fresh matter/dry matter (FM/DM) and K concentration in LM, AG and BR were evaluated. The fertilization increased K availability in all evaluated soil layers, indicating good mobility of the nutrient even at low rates. Yerba mate responded positively to increasing K2O rates with higher yields of all harvested components. The crop proved K-demanding, with a maximum COYM yield of 28.5 t ha-1, when 72 mg dm-3 K was available in the 0-20 cm layer. Yerba
(1) Received for publication on July 11, 2013 and approved on June 2, 2014.
(2) Pos Doctoral student, Federal University of Santa Catarina. Av. Luiz de Camões, 2090, Bairro Conta Dinheiro. CEP 88520-000 Lages (SC), Brazil, E-mail: [email protected]
(3) Professor, Federal Institute of Santa Catarina. Av. Expedicionários, 2150, Bairro Campo da Água Verde. CEP 89460-000 Canoinhas (SC), Brazil. E-mail: [email protected]
(4) Full Professor, Soil Science Department - DPS, Federal University of Viçosa - UFV. Av. P. H. Rolfs, s/n. CEP 36570-900 Viçosa (MG), Brazil. E-mail: [email protected]
(5) Undergraduate student, UFV. E-mail: [email protected], [email protected]
(6) Master's degree student, Soil Science and Plant Nutrition Department, Escola Superior de Agricultura "Luiz de Queiroz", ESALQ/USP. Av. Pádua Dias, 11. Caixa Postal 9. CEP 13418-900 Piracicaba (SP), Brazil. E-mail: [email protected] (7) Adjunct Professor, DPS, UFV. E-mail: [email protected]
(8) Researcher, Embrapa Forestry. Estrada da Ribeira, km 111. CEP 83411-000 Colombo (PR), Brazil. E-mail: [email protected]
mate in the plant production stage requires soil K availability at medium to high level; in clayey soil with low K availability, a rate of 300 kg ha-1 K
2O should be applied at 24 month intervals to obtain high yields. A leaf K concentration of 16.0 g ha-1 is suitable for yerba mate in the growth stage.
Index terms: soil K availability, K mobility in the soil, nutrient use efficiency, nutritional status.
RESUMO:PRODUÇÃO E NUTRIÇÃO DA ERVA-MATE (Ilex paraguariensis) INFLUENCIADAS PELA ADUBAÇÃO POTÁSSICA
A erva-mate (Ilex paraguariensis), espécie arbórea nativa das regiões subtropicais da
América do Sul, ocorre no Brasil predominantemente na Região Sul. Apesar da histórica importância da cultura nessa região, até o momento, raros foram os trabalhos realizados sobre sua nutrição no intuito de melhorar a produtividade. Assim, objetivou-se avaliar a influência de doses de K e sua disponibilidade no solo, na produtividade e no estado nutricional da erva-mate. O experimento foi conduzido em São Mateus do Sul, PR, em um Latossolo
Vermelho-Escuro álico, onde se avaliaram as doses 0, 20, 40, 80, 160 e 320 kg ha-1 de K
2O em
cultivo com sete anos de idade. A colheita, 24 meses após a instalação do experimento, consistiu na remoção de aproximadamente 95 % da copa, que brotou da colheita anterior. Avaliou-se, no solo, a disponibilidade de K nas profundidades de 0-10, 0-20, 10-20 e 20-40 cm. Na planta, avaliaram-se a massa verde de folhas (FO), galhos finos (GF), galhos grossos (GG) e erva-mate comercial (ECOM), correspondente a FO+GF. Foi, também, avaliada a relação entre massa verde/massa seca (MV/MS) e o teor de K nas FO, GF e GG. A adubação elevou a disponibilidade de K em todas as camadas do solo avaliadas, indicando boa mobilidade do nutriente mesmo
em pequenas doses. A erva-mate respondeu positivamente ao aumento das doses de K2O, com
incremento da produtividade de todos os componentes colhidos. A cultura evidenciou-se exigente
em K, tendo a máxima produção de ECOM de 28,5 t ha-1, quando a disponibilidade do
nutriente no solo, na camada de 0-20 cm, era de 72 mg dm-3. A erva-mate em fase de produção
requer disponibilidade de K no solo entre o nível médio a alto, e, em solo argiloso e com baixo
teor de K disponível, a dose de 300 kg ha-1de K
2O deve ser aplicada em intervalo de 24 meses
para obtenção de alta produtividade. O teor de K foliar de 16,0 g kg-1 é adequado para a
cultura da erva-mate em fase de produção.
Termos de indexação: disponibilidade de potássio no solo, mobilidade de potássio no solo, eficiência de uso do nutriente, estado nutricional.
INTRODUCTION
Yerba mate (Ilex paraguariensis), a long-living
perennial arboreal species (Carvalho, 2003), is native to the subtropical regions of South America (Oliveira & Rota, 1985) and in Brazil it occurs naturally in acid soils with low exchangeable cations, mainly in the southern region (Carvalho, 2003). It is cultivated mostly on small and medium-sized farms and, until recently, accounted for the income of thousands of small farmers (Gazeta…, 1999). However, the
reduction of the average national yield from 17.3 t ha-1
in 1990 to 6.7 t ha-1 in 2012 (IBGE, 2012), indicates
that the crop is in decline.
Research has shown that yerba mate can be classified as healthy food with functional properties for the human body (Gugliucci, 1996; Mejía et al., 2010; Berté et al., 2011). This fact, along with the increasing world population, is expected to stimulate a rising demand for raw material of this crop. However, little advance has been observed in research
on the production system in Brazil, which could affect the economic viability of the crop in the medium term.
intensity of harvesting in the last decades, and considering that the replenishment of the nutrients exported in the harvested crops is still a rare practice, the current production system is unsustainable.
Of all nutrients, K is the second most exported at harvest. Berger (2006) assessed the nutrient concentration in leaves+twigs, wood, bark, residue, and root of adult herb plants and found that, except in the bark, K was the second most exported nutrient, in particular in the leaf+twig component,
with 122 kg ha-1 K. The major K export at harvest
explains the response to K fertilization of yerba mate in some studies (Lourenço et al., 1999; Pandolfo et al., 2003).
Potassium is transported to the root surface predominantly by diffusion and mass flow mechanisms (Oliveira et al., 2004; Ernani et al., 2007a). In the soil, the rate of K transport in the deeper layers is intermediate to that of N and P (Ernani et al., 2007b) and is determined by the amount of water leaching through the profile and the nutrient concentration in the soil solution (Ernani et al., 2007b; Neves et al., 2009), but is intensified in sandy (Werle et al., 2008) and low CEC soils (Ernani et al., 2007a). Thus, in soils with these properties split applications are recommended, to minimize K leaching losses (Raij, 1991). The application of rates compatible with the crop fertilizer requirements also helps to reduce K losses (Ernani et al., 2007a). For Kaminski et al. (2010), K fertilization programs should establish a sufficiency level, based on which the recommended rate would meet the crop requirements, in agreement with the amount exported by the crop, avoiding the establishment of broad bands of K availability for fertilizer recommendation. Adopting these measures would prevent the movement of K to deeper soil layers.
The scarce reports on fertilization of herb fields impair the establishment of crop-specific nutritional needs and fertilization recommendation. Given the above, the objective was to evaluate the effect of K fertilization rates on yerba mate yield, soil K availability and the nutritional status of plants in the herb field.
MATERIAL AND METHODS
The experiment was conducted in São Mateus do Sul, PR, on the second Paraná Plateau (longitude
50o 32’ W, latitude 25o 54’ S, 789 m asl). The regional
climate is temperate (Cfb), with average annual rainfall between 1,600-1,800 mm (IAPAR, 1994). The local soil, a Humox, has a low pH and clayey texture (Table 1).
After removing part of the forest, sparse individuals of native yerba mate, Araucaria, walnut and cinnamon remained in the area. In 2001, yerba mate
was planted at 2 × 2 m spacing, using seedlings derived from seeds collected from local mother plants. Prior to the experiment, the first harvest of yerba mate (formation pruning) was performed approximately 1 m above the ground 24 months after planting, and the other harvests were carried out every 18 months. No liming and mineral or organic fertilization had ever been applied in the area. In January 2009, the experiment was initiated, and the herb field was mechanically weeded in September, January and April of each year.
Treatments consisting of six K2O rates were
arranged in a randomized block design with five replications. Each experimental unit consisted of 10 healthy plants, separated from the neighboring plot by two border rows.
Rates of 0, 20, 40, 80, 160, and 320 kg ha-1 K
2O in the source potassium chloride were applied. At the
beginning of the experiment, 1 t ha-1 of dolomitic
limestone was applied to the soil surface on the entire area, as recommended by CQFSRS/SC (2004). As
additional fertilizers, N and P were applied (80 kg ha-1
of N and P2O5, respectively), in the form of urea and
triple superphosphate.
The K2O rates and additional fertilizers were
applied to the soil surface in the area under the tree canopies without incorporation into the soil, at the
beginning of January and September. The K2O rates
and additional fertilizers were applied three times (Table 2).
At harvest, a composite soil sample was prepared from 15 single samples collected at three points from under the canopy of five plants in the layers 0-10, 10-20 and 20-40 cm of each plot. Samples from the 0-10 cm layer were collected with a spade, in bands (width 20 cm × thickness 3 cm). Then, from the center of the same points, soil was collected with a Dutch auger from the layers underneath. After air-drying and sieving through a 2 mm mesh, the samples were analyzed to determine the K availability, extracted with Mehlich-1 (De Filippo & Ribeiro, 1997) and determined by flame photometry (AOAC, 1975). From the data of the 0-10 and 10-20 cm layers, the K availability in the 0-20 cm layer was calculated.
Before harvest, shoots were collected from the middle third of the canopy, for chemical analysis of K and to determine the relationship between fresh and dry matter of leaves and twigs. At harvest, one representative sample of thick branches per plot was taken for the same measurements. The shoot sample was separated into leaves and twigs immediately after harvest. After quantifying the fresh matter, the plant
material was washed, dried at 65 oC to constant
The effect of fertilization was evaluated 24 months after the beginning of the experiment (Table 2). At harvest, approximately 95 % of the fresh matter grown after the previous harvest was removed, and the material was separated in commercial yerba mate (COYM = leaves+twigs) and thick branches (BR), and the amount of fresh matter of both determined. Plant material with a diameter smaller than 7 mm, approximately, was considered twigs (TW), and above this diameter branches (BR).
The fresh matter yield of the components leaves (LM), twig (TW), thick branches (BR) and commercial yerba mate (COYM) were determined. For COYM, the effect of the fertilizer rate on yield was also calculated (COYM.PID = total yield minus yield of unfertilized plot). The K use efficiency (KUE) was calculated as the ratio between dry matter (DM) of the harvested plant components (COYM+BR) and cumulative
nutrient concentration (kg DM kg-1 K) (Barros et al.,
1986). The K recovery rate from fertilizer by the plant (pl.RR) was computed by the formula:
100 x .
R . K
pl . unf . KCont pl
. f . KCont RR
.
pl ÷
ø ö ç
è
æ
-= ,
where pl.RR = plant recovery rate of K from fertilizer; KCont.f.pl = K concentration of components (COYM+BR) of fertilized plants; KCont.unf.pl = K concentration of unfertilized plants; and K.R = K rate applied. The ratio between fresh and dried matter (FM/DM) was calculated for LM (LM.FM/DM), TW (TW.FM/DM) and COYM (COYM.FM/DM).
Data were evaluated by ANOVA and the effect of K was estimated by regression. For K in the soil, in the partitioning of the interaction between the factors plot (rate) and subplot (layer) to evaluate the effect of the subplot within the plot, the mean square was adopted as error of the combined residue and the respective number of degrees of freedom, according to Satterthwaite (1946).
RESULTS AND DISCUSSION
Available potassium in soil
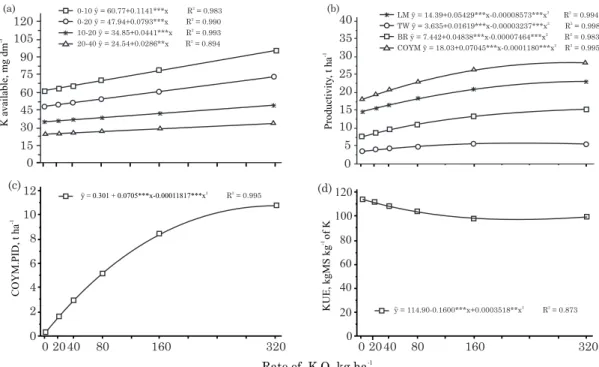
The concentration of available K in the soil increased linearly in all layers with increasing K fertilizer rate. Potassium availability increases most in the 0-10 cm layer (Figure 1a), where the increase
of available K was 37 mg dm-3 at the highest rate
(320 kg ha-1 K
2O), (Figure 1a). The smallest increase
in K concentration (9 mg dm-3) at the highest rate
was found in the 20-40 cm layer. In the intermediate layers 0-20 and 10-20 cm, soil K increased by 25 and
14 mg dm-3, respectively.
The increase in K concentration in deeper layers, even in the 20-40 cm layer and at the lowest rates (20
and 40 kg ha-1 K
2O), may have been especially favored
by high soil acidity and high annual rainfall in the region. Although the soil CEC can be considered high
(CQFSRS/SC, 2004), only Al3+ occupied the major part
of the exchange sites (Table 1).
The increase in K availability was linear even in the deeper layers (Figure 1d), due to a higher K concentration in the soil solution after K fertilization, indicating the vertical mobility of K in the soil (Rosolem et al., 2006; Neves et al., 2009). Therefore, although the soil was very clayey with high CEC, the movement of K to the deeper layers was significant.
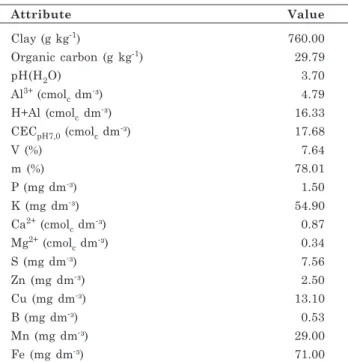
Attribute Value
Clay (g kg-1) 760.00
Organic carbon (g kg-1) 29.79
pH(H2O) 3.70
Al3+ (cmol c dm
-³) 4.79
H+Al (cmolc dm-³) 16.33
CECpH7,0 (cmolc dm-³) 17.68
V (%) 7.64
m (%) 78.01
P (mg dm-³) 1.50
K (mg dm-³) 54.90
Ca2+ (cmolc dm-³) 0.87
Mg2+ (cmol
c dm-³) 0.34
S (mg dm-³) 7.56
Zn (mg dm-³) 2.50
Cu (mg dm-³) 13.10
B (mg dm-³) 0.53
Mn (mg dm-³) 29.00
Fe (mg dm-³) 71.00
Table 1. Clay content and soil properties in the 0-20 cm layer at the experimental site
Mehlich-1 (0.05 mol L-1 HCl + 0.0125 mol L-1 H
2SO4): P, K, Fe, Mn, Cu, and Zn; KCl 1 mol L-1: Ca, Mg and Al; Calcination and HCl solution: B; and calcium phosphate: S.
Subdivision and time of application of K2O rates and additional fertilizers(1)
Harvest 1st portion 2nd portion 3rd portion
K2O rate Time K2O rate Time K2O rate Time Time
33.3 % Jan/2009 33.3 % Sep/2009 33.3 % Sep/2010 Jan/2011
Table 2. Splitting and time of fertilizer application and timing of yerba mate harvest
(1) A supplementary fertilizer rate (80 kg ha-1 of N and P
This fact would probably not have been detected if the liming rate had been higher, which would have caused the neutralization of exchangeable Al and H and occupation of sites by K. In soils with high acidity
where Al3+ concentrations are high, this ion is rather
adsorbed by negative charges than by other lower valence cations, favoring K mobility in the soil profile (Bissani et al., 2004). In addition, the neutralization of part of the exchangeable H and Al by liming could raise the effective CEC (Albuquerque et al., 2000) and favor K adsorption and consequently reduce its mobility in the soil profile. Another practice to reduce K movement would be to increase the splitting of fertilization.
Yield and K nutritional status of yerba mate
Yerba mate responded positively to K fertilization with yield increases in all harvested plant components, with an increase in COYM in the order of 58 %.
Highest yields of 23.0, 5.7, 15.3, and 28.5 t ha-1,
respectively, of LM, FG, BR, and COYM were obtained with K fertilizer rates of 317, 250, 320, and 298
kg ha-1 K
2O (Figure 1b).
The COYM yield was much higher than the
national average yield of 6.7 t ha-1 in 2012 (IBGE,
2012). In Argentina, in low-technology cultivation
systems, the average annual yield is 3.0 t ha-1, but
higher than 12.0 t ha-1 yr-1 in those with high
technology (Montechiesi, 2008). The maximum
COYM yield was 28.5 t ha-1, exceeding the national
average by 325 % and was 482 % higher than the
state average of Paraná (IBGE, 2012). This result demonstrates the importance of a good nutritional management for increased domestic yerba mate yield.
In general, high K2O rates were required to
maximize the yield of each component. A linear yield
increase with annual rates of 120 kg ha-1 K
2O was
obtained in 6-year-old herb fields (Lourenço et al., 1999). After nine years, when the K soil concentration
was below 120 mg dm-3, the annual application of
143 kg ha-1 K
2O resulted in fresh matter yield close
to the maximum response (Pandolfo et al., 2003). The COYM yield (Figure 1b) was highest when the K concentration in the soil layers 0-10 and 0-20 cm was
95 and 72 mg dm-3, respectively, which was considered
high and medium (CQFSRS/SC, 2004). Thus, even where yerba mate occurs naturally in low fertility soils (Carvalho, 2003), high levels of soil K availability are required to reach the maximum production capacity.
The COYM yield was influenced by the K fertilizer rate (COYM.PID) (Figure 1c) and use efficiency (KUE) (Figure 1d) and was positively and negatively influenced by the nutrient levels, respectively. At a
K2O rate of 298 kg ha-1, COYM.PID 10.8 t ha-1 was
highest (Figure 1c) and KUE lowest (97 kg DM kg-1 K)
at 227 kg ha-1 K
2O (Figure 1d). Therefore, yields are
maximized when KUE is close to 100 kg DM kg-1 K
contained in the harvested material. The use of low nutrient rates in low-fertility soils leads to a linear
0 40 80 120 160 200 240 280 320
0 15 30 45 60 75 90 105 120 (a)
20 0 0 40 80 120 160 200 240 280 320
5 10 15 20 25 30 35 40 (b) 20
y = 14.39+0.05429***x-0.00008573***x R = 0.994
LM 2 2
2 2
y = 3.635+0.01619***x-0.00003237***x
TW R = 0.998
2 2
y = 7.442+0.04838***x-0.00007464***x
BR R = 0.983
y = 18.03+0.07045***x-0.0001180***x 5
COYM 2 R = 0.992
0 40 80 160 320
0 2 4 6 8 10 12 (c) 20
Rate of K O, kg ha2 -1
0 40 80 160 320
0 20 40 60 80 100 120 (d) 20
x x x x
x
x x
x
0-10 y = 60.77+0.1141***x R = 0.92 83
2
0-20 y = 47.94+0.0793***x R = 0.990
2
10-20 y = 34.85+0.0441***x R = 0.993
20-40 y = 24.54+0.0286**x R = 0.8942
R = 0.9
2 2 95
y = 0.301 + 0.0705***x-0.00011817***x
x x x x x x
y = 114.90-0.1600***x+0.0003518**x2 R = 0.2 873
COYM PID
.
, t ha
-1
KUE MS
, kg
kg
-1 of K
K available, mg dm
-3
Productivity
, t ha
-1
yield response and a high nutrient use efficiency by the plant (van Keulen, 1982). At higher rates or when fertility is high, the nutrient use efficiency is reduced (Epstein & Bloom, 2004). Nutrient absorption in addition to the need for biochemical processes can result in toxicity or other nutrient imbalances (van Keulen, 1982; Hawkesford et al., 2012) reducing yields, as apparently occurred in this study at the highest K rates.
The ratio between fresh and dry matter (FM/DM) of LM (LM.FM/DM) and COYM (COYM.FM/DM) was affected by the fertilizer rate and was positively linearly related with the K rates. At a rate that maximized yield and COYM, the values of the relationship LM.FM/COYM.FM and FM/DM were, respectively, 3.06 and 3.13. For TW (TW.FM/DM), this relationship was however not affected by K rates, with a mean value of 3.55 (Table 3).
The records regarding FM/DM in yerba mate for LM range from 2.41 (Campos, 1991) to 3.40 (Santin, 2008), in TW from 2.38 to 2.54 (Campos, 1991) and COYM from 1.90 (Reissmann et al., 1985) to 2.59 (Campos, 1991). The values of the FM/DM ratio found here are therefore higher than the commonly observed for yerba mate. However, the studies of Campos (1991) and Reissmann et al. (1985) were carried out in unfertilized herb fields. Thus, the values presented here can be assumed as ideal for representing the condition of maximum yerba mate yield in relation to K rates.
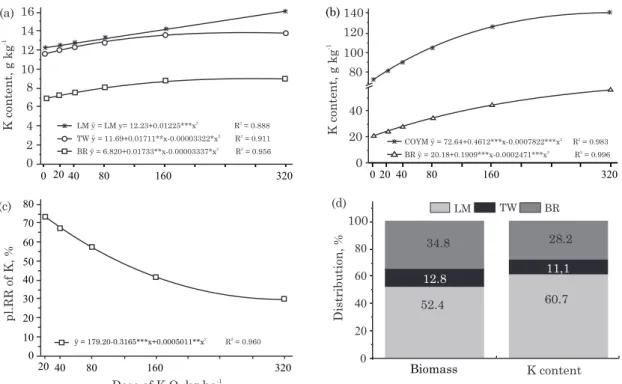
The K concentration of all components (Figure 2a), the K concentration in COYM and in BR (Figure 2b), as well as the plant recovery rate of K (pl.RR)
(Figure 2 d) were affected by the K2O rate. The K
concentration in TW and BR was maximum at rates
of 258 and 260 kg ha-1 K
2O, with 13.9 and 9.1 g kg-1,
respectively. The leaf K concentration was linear with
increasing K2O rates, with a maximum of 16.2 g kg-1
at the highest rate tested (Figure 2a).
The rate that obtained the highest COYM, the K concentration in COYM and BR was 141 and 56 kg
ha-1 K, respectively (Figure 3b). When aside from
COYM, BR is also removed from the area, 197 kg ha-1 K
would be exported. However, under this same condition
(K2O rate of 298 kg ha-1), the distribution of the K
concentration and matter of each component varies
according to the concentration of this nutrient in plant tissue. Comparing the distribution of fresh matter produced with the K concentration of each component harvested, the percentage K concentration of TW and BR tends to decrease compared to the fresh matter. On the other hand, the percentage K concentration of LM increases compared to fresh matter (Figure 2d). Reissmann et al. (1985) had pointed out the significant nutrient loss from the area at mate harvest. When thick branches left over from the harvest are also removed from the area, the fertilizer replenishment should take an increase in the K rate into account (Figure 2d) for a harvest interval of 24 months.
The recovery rate of the plant K (pl.RR) decreased with increasing fertilizer rates. The pl.RR was lowest
(29.2 %) at a rate of 316 kg ha-1 K
2O. The pl.RR may
be affected, among other factors, by fertilization and plant age (Santos, 2002), and decreased with increasing fertilizer rates (Teixeira et al., 2002) and was higher, the higher plant growth and the larger the root system (Prezotti, 2001; Rosa, 2002). The reduction of pl.RR (Figure 2c) at increasing rates reflects the reduction in KUE with increased plant nutrient availability (Epstein & Bloom, 2004), as occurred in this study (Figure 1d).
Higher K concentrations in the leaves than in thick branches and twigs are generally observed in tree species, because in this tissue the metabolic processes are most intense (Epstein & Bloom, 2004). The increase in leaf K concentration and COYM yield, in response to fertilization, signals the need for K fertilization in plantations of yerba mate (Figure 2). The leaf K concentration that induced the highest
COYM yield was 15.9 g kg-1. In the literature, leaf K
concentrations from 5.4 g kg-1 (Jacques et al., 2007)
to 20.8 g kg-1 (Radomski et al., 1992) are reported for
yerba mate. In experiments after six years of successive K fertilizer applications and harvests, Pandolfo et al. (2003) found a mean leaf K
concentration of 17.4 g kg-1 which is closest to that
obtained in this study at the rate for maximum COYM yield.
For the same species, a K concentration in TW
from 9.9 g kg-1 (Reissmann et al., 1983) to 13.4 g kg-1
was observed (Reissmann et al., 1985) and in BR, from
5.0 g kg-1 (Campos, 1991) to 9.6 g kg-1 (Berger, 2006).
In this study, the rate at which COYM yield is
maximized (298 kg ha-1 K
2O), the K concentration in
FG and BR was, respectively, 13.8 and 9.0 g kg-1. For
BR, the K concentration was higher than what is normally found in yerba mate. In the few studies addressing K concentration in BR, such as those of Campos (1991) and Berger (2006), values were measured on unfertilized herb fields, where soil K availability was possibly below the crop requirement. Thus, the K concentrations in BR in this study can be considered ideal.
Variable(1) Equation R2
LM.FM/DM y = 2.804 + 0.0008538** x 0.770
TW.FM/DM y = y = 3.550
-COYM.FM/DM y = 2.891 + 0.0008214*** x 0.810 Table 3. Regression equation and mean values of the
ratio between fresh and dry matter (FM/DM) of K-fertilized yerba mate
CONCLUSIONS
1. The soil K availability for yerba mate in the
growth stage should be 120 mg dm-3 in the 0-10 cm
soil layer, and 80 mg dm-3 K in the 0-20 cm layer.
2. Yerba mate in the growth stage, cultivated on clayey soil with low K availability, reached highest
yields when fertilized with 300 kg ha-1 K
2O applied in
24-month intervals.
3. Thick branches export large amounts of K, and when removed from the area, maintenance fertilization area must be increased by 30 %.
4. Potassium fertilization barely influences the ratio of fresh/dry matter of commercial yerba mate
and a leaf K concentration of 16.0 g kg-1 is suitable
for the crop in the growth stage.
ACKNOWLDEGEMENTS
The authors thank the Agropecuária Vier Ltda and Baldo S.A. in São Mateus do Sul, PR, and are indebted to Embrapa Florestas, Colombo, PR, the Soil Science Department of the Federal University of Viçosa and the National Council for Scientific and Technological Development (CNPq) for funding this research.
LITERATURE CITED
ALBUQUERQUE, J.A.; BAYER, C.; ERNANI, P.R. & FONTANA, E.C. Propriedades físicas e eletroquímicas de um Latossolo Bruno afetadas pela calagem. R. Bras. Ci. Solo, 24:295-300, 2000.
ASSOCIATIONS OF OFFICIAL ANALYTICAL CHEMISTS -AOAC. Official methods of analysis of the Associations of Official Analytical Chemists. 12.ed. Washington, D.C., 1975. 1024p.
BARROS, N.F.; NOVAIS, R.F.; CARMO, D.N. & NEVES, J.C.L. Classificação nutricional de sítios florestais - Descrição de uma metodologia. R. Árvore, 10:112-120, 1986.
BERGER, G. Biomassa e nutrientes em plantios de erva-mate (Ilex paraguariensis A. St. Hil.) no município de Nova Prata, RS. Santa Maria, Universidade Federal de Santa Maria, 2006. 93p. (Dissertação de Mestrado) BERTÉ, K.; RUCKER, N. & RIBANI, R.H. Yerba mate Ilex
paraguariensis A. St.-Hil. Phyt., 9:180-184, 2011.
BISSANI, C.A; MEURER, E.J. & BOHNEN, H. Solos ácidos e solos afetados por sais. In: MEURER, E.J., ed. Fundamentos de química do solo. 2.ed. Porto Alegre, Geneses, 2004. p.181-205.
CAMPOS, M.A.A. Balanço de biomassa e nutrientes em povoamentos de Ilex paraguariensis. Avaliação na safra e na safrinha. Curitiba, Universidade Federal do Paraná, 1991. 107p. (Dissertação de Mestrado)
0 40 80 160 320
0 2 4 6 8 10 12 14 16 (a)
20 0 40 80 160 320
0 20 40 80 100 120 140
(b)
20
40 80 160 320
0 10 20 30 40 50 60 70 80
(c)
20 0 1 2
20 40 60 80
100 (d)
60.7
11,1
28.2 34.8
12.8
52.4
K content
Biomass
LM TW BR
Dose of K O, kg ha2 -1
pl.
of K, %
RR
K content, g kg
-1
K content, g kg
-1
Distribution, %
R = 0.9
2 2 60
y = 179.20-0.3165***x+0.0005011**x
LM y =LM y= 12.23+0.01225***x2 R = 0.8882
y = 11.69+0.01711**x-0.00003322*x
TW 2 R = 0.9112
y = 6.820+0.01733**x-0.00003337*x R = 0.956
BR 2 2
COYM y = 72.64+0.4612***x-0.0007822***x2 R = 0.9832
BR y = 20.18+0.1909***x-0.0002471***x2 R = 0.9962
x x
x x x
x
x
x
x x
x x
x
x
Figure 2. Potassium leaf concentration (LM), twigs (TW) and thick branches (BR) (a); K concentration in commercial yerba mate (COYM) and in BR (b); plant K recovery rate (pl.RR) (c); and yield distribution and K concentration in LM, TW and BR at a rate of 298 kg ha-1 K
CARVALHO, P.H.R. Espécies arbóreas brasileiras. Brasília, Embrapa Informação Tecnológica; Colombo, Embrapa Florestas, 2003. 1039p.
CASTELLA, P.R. & BRITEZ, R.M., orgs. A floresta com araucária no Paraná: Conservação e diagnóstico dos remanescentes florestais. Brasília, Ministério do Meio Ambiente, 2004. 233p.
COMISSÃO DE QUÍMICA E FERTILIDADE DO SOLO -CQFSRS/SC. Manual de adubação e calagem para os Estados do Rio Grande do Sul e de Santa Catarina. 10.ed. Porto Alegre, SBCS - Núcleo Regional Sul/UFRGS, 2004. 400p.
DE FILIPPO, B.V. & RIBEIRO, A.C. Análise química do solo; metodologia. Viçosa, MG, Universidade Federal de Viçosa, 1997. 26p. (Boletim de Extensão, 29)
EPSTEIN, E. & BLOOM, A.J. Nutrição mineral de plantas: Princípios e perspectivas. 2.ed. Londrina, Planta, 2004. 403p.
ERNANI, P.R.; ALMEIDA, J.A. & SANTOS, F.C. Potássio. In: NOVAIS, R.F.; ALVAREZ V., V.H.; BARROS, N.F.; FONTES, R.L.F.; CANTARUTTI, R.B. & NEVES, J.C.L., eds. Fertilidade solo. Viçosa, MG, Sociedade Brasileira de Ciência Solo, 2007a. p.551-594.
ERNANI, P.R.; BAYER, C.; ALMEIDA, J.A. & CASSOL, P.C. Mobilidade vertical de cátions influenciada pelo método de aplicação de cloreto de potássio em solos com carga variável. R. Bras. Ci. Solo, 31:393-402, 2007b.
GAZETA GRUPO DE COMUNICAÇÕES. Anuário Brasileiro da Erva-mate 1999. Santa Cruz do Sul, Pallotti, 1999. 64p.
GUGLIUCCI, A. Antioxidant effects of Ilex paraguariensis: induction of decreased oxidability of human LDL in vivo. Biochem. Biophys. Res. Commun., 2:338-344, 1996. HAWKESFORD, M.; HORST, W.; KICHEY, T.; LAMBERS,
H.; SCHJOERRING, J.; MØLLER, I.S. & WHITE, P. Functions of macronutrients. In: MARSCHNER, P., ed. Mineral nutrition of higher plants. 3.ed. Oxford, Academic Press, 2012. p.135-189.
INSTITUTO AGRONÔMICO DO PARANÁ - IAPAR. Cartas climáticas básicas do Estado do Paraná. Londrina, 1994. 49p.
INSTITUTO BRASILEIRO DE GEOGRAFIA E ESTATÍSTICA - IBGE. Produção agrícola municipal: culturas temporárias e perenes. Prod. Agríc. Municipal, 39:1-101, 2012.
JACQUES, R.A.; ARRUDA, E.J.; OLIVEIRA, L.C.S.; OLIVEIRA, A.P.; DARIVA, C.; OLIVEIRA, J.V. & CARAMÃO, E.B. Influence of agronomic variables on the macronutrient and micronutrient contents and thermal behavior of mate tea leaves (Ilex paraguariensis). J. Agric. Food Chem., 55:7510-7516, 2007.
KAMINSKI, J.; MOTERLE, D.F.; RHEINHEIMER, D.S.; GATIBONI, L.C. & BRUNETTO, G. Potassium availability in a Hapludalf soil under long term fertilization. R. Bras. Ci. Solo, 34:783-791, 2010.
LOURENÇO, R.S.; MEDRADO, M.J.S. & DALZOTO, D.N. Efeito de níveis de potássio sobre a produtividade de erva-mate (Ilex paraguariensis St. Hil.) no município de Ivaí, PR. Bol. Pesq. Flor., 39:119-131, 1999.
MEJÍA, E.G.; SONG, Y.S.; HECK, C.I. & RAMÍREZ-MARES, M.V. Yerba mate tea (Ilex paraguariensis): Phenolics, antioxidant capacity and in vitro inhibition of colon cancer cell proliferation. J. Funct. Foods, 2:23-34, 2010. MONTECHIESI, R. Yerba mate, câmbios em la producción,
no em la actividad. Posadas, 2008. 62p.
NEVES, L.S.; ERNANI, P.R. & SIMONETE, M.A. Mobilidade de potássio em solos decorrente da adição de doses de cloreto de potássio. R. Bras. Ci. Solo, 33:25-32, 2009. OLIVEIRA, Y.M.M. & ROTTA, E. Área de distribuição natural
da erva-mate (Ilex paraguariensis St. Hil.). In: SEMINÁRIO SOBRE ATUALIDADES E PERSPECTIVAS FLORESTAIS. Silvicultura da erva-mate (Ilex paraguariensis St. Hil.). 1983, Curitiba. Anais... Curitiba, Embrapa/CNPF, 1985. p.17-36.
OLIVEIRA, R.H.; ROSOLEM, C.A. & TRIGUEIRO, R.M. Importância do fluxo de massa e difusão no suprimento de potássio ao algodoeiro como variável de água e potássio no solo. R. Bras. Ci. Solo, 28:439-445, 2004.
PANDOLFO, M.C.; FLOSS, P.A.; Da CROCE, D.M. & DITTRICH, R.C. Resposta da erva-mate (Ilex paraguariensis St. Hil.) à adubação mineral e orgânica em um Latossolo Vermelho aluminoférrico. Ci. Flor., 13:37-45, 2003.
PREZOTTI, L.C. Fertilização do cafeeiro. In: ZAMBOLIM, L. Tecnologias de produção de café com qualidade. Viçosa, MG, Universidade Federal de Viçosa, 2001. p.607-615. RADOMSKI, M.I.; SUGAMOSTO, M.L.; GIAROLA, N.F.B. &
CAMPIOLO, S. Avaliação dos teores de macro e micronutrientes em folhas jovens e velhas de erva-mate nativa. R. Inst. Flor., 4:453-456, 1992.
RAIJ, B.van. Fertilidade do solo e adubação. Piracicaba, Ceres, 1991. 343p.
RAKOCEVIC, M.; BORSATO, A.V.; BONA, C. & MEDRADO, M.J.S. Distribuição de estômatos em folhas de diferentes idades de erva-mate cultivada em monocultura e sub-bosque. In: CONGRESO SUDAMERICANO DE LA YERBA MATE, 5., Posadas, 2011. Actas... Posadas, INYM/ INTA/INaM, 2011. p.45-50.
REISSMANN, C.B.; KOEHLER, C.W.; ROCHA, H.O. & HILDEBRAND, E.E. Avaliação da exportação de macronutrientes pela exportação da erva-mate. In: SEMINÁRIO SOBRE ATUALIDADES E PERSPECTIVAS FLORESTAIS. Silvicultura da erva-mate (Ilex paraguariensis St. Hil). Curitiba, 1985. Anais... Curitiba, Embrapa/CNPF, 1985. p.128-139.
ROSA, G.N.G.P. Sistema de recomendação de corretivos e fertilizantes para o cultivo do coqueiro. Viçosa, MG, Universidade Federal de Viçosa, 2002. 76p. (Dissertação de Mestrado)
ROSOLEM, C.A.; GARCIA, R.A.; FOLONI, J.S.S. & CALONEGO, J.C. Lixiviação de potássio no solo de acordo com suas doses aplicadas sobre palha de milheto. R. Bras. Ci. Solo, 30:813-819, 2006.
SANTIN, D. Produtividade, teor de minerais, cafeína e teobromina em erva-mate adensada e adubada quimicamente. Curitiba, Universidade Federal do Paraná, 2008. 114p. (Dissertação de Mestrado)
SANTOS, F.C. Sistema de recomendação de corretivos e fertilizantes para a cultura da soja. Viçosa, MG, Universidade Federal de Viçosa, 2002. 64p. (Dissertação de Mestrado)
SATTERTHWAITE, F.E. An approximate distribution of estimates of variance components. Biom. Bull., 2:110-114, 1946.
TEDESCO, J.M.; GIANELLO, C.; BISSANI, C.A.; BOHNEM, H. & VOLKWEISS, S.J. Análise de solo, plantas e outros materiais. 2.ed. Porto Alegre, Universidade Federal do Rio Grande do Sul, 1995. 174p. (Boletim Técnico, 5) TEIXEIRA, L.A.J.; SPIRONELLO, A.; FURLANI, P.R. &
SIGRIST, J.M.M. Parcelamento da adubação NPK em abacaxizeiro. R. Bras. Frutic., 24:219-224, 2002. van KEULEN, H. Graphical analysis of annual crop response
to fertilizer application. Agric. Syst., 9:113-126, 1982. WERLE, R.; GARCIA, R.A. & ROSOLEM, C.A. Lixiviação de