Tolerance to preharvest sprouting and yield of wheat genotypes
from different breeding programs
Rafael Nörnberg(1), José Antonio Gonzalez da Silva(2), Henrique de Souza Luche(1), Elisane Weber Tessmann(1),
Sydney Antonio Frehner Kavalco(1), Cristiano Mathias Zimmer(1), Diego Baretta(1), Luciano Carlos da Maia(1)
and Antonio Costa de Oliveira(1)
(1)Universidade Federal de Pelotas, Faculdade de Agronomia Eliseu Maciel, Departamento de Fitotecnia, Campus Universitário,
CEP 96001‑970 Capão do Leão, RS, Brazil. E‑mail: [email protected], [email protected], [email protected], [email protected], [email protected], [email protected], [email protected], [email protected] (2)Universidade
Regional do Noroeste do Estado do Rio Grande do Sul, Departamento de Estudos Agrários, Rua do Comércio, no 3.000, Bairro Universitário,
CEP 98700‑000 Ijuí, RS, Brazil. E‑mail: [email protected]
Abstract – The objective of this work was to characterize the performance of elite wheat genotypes from different Brazilian breeding programs for traits associated with grain yield and preharvest sprouting. The study was conducted in 2010 and 2011 in the municipality of Capão do Leão, in the state of Rio Grande do Sul, Brazil, in a randomized complete block design with three replicates. Thirty-three wheat genotypes were evaluated for traits related to preharvest sprouting and grain yield. The estimate of genetic distance was used to predict potential combinations for selection of plants with high grain yield and tolerance to preharvest sprouting. The combined analysis of sprouted grains and falling number shows that the TBIO Alvorada, TBIO Mestre, Frontana, Fundacep Raízes, Fundacep Cristalino, and BRS Guamirim genotypes are tolerant to preharvest sprouting. Combinations of TBIO Alvorada and TBIO Mestre with Fundacep Cristalino show high potential for recovering superior genotypes for high grain yield and tolerance to preharvest sprouting.
Index terms: Triticum aestivum, ear sprouting, falling number, genetic divergence, parental selection.
Tolerância à germinação na pré‑colheita e produtividade de genótipos de trigo
de diferentes programas de melhoramento
Resumo – O objetivo deste trabalho foi caracterizar o desempenho de genótipos elite de trigo de diferentes programas de melhoramento do Brasil, para caracteres associados à produtividade de grãos e à germinação na pré-colheita. O estudo foi conduzido em 2010 e 2011 no Município de Capão do Leão, RS, em delineamento experimental de blocos ao acaso, com três repetições. Foram avaliados 33 genótipos de trigo quanto aos caracteres relacionados à germinação em pré-colheita e ao rendimento de grãos. A estimativa da distância genética foi utilizada para predizer combinações potenciais na seleção de plantas com alta produtividade de grãos e tolerância à germinação na pré-colheita. A análise combinada de grãos germinados e número de queda mostra que os genótipos TBIO Alvorada, TBIO Mestre, Frontana, Fundacep Raízes, Fundacep Cristalino e BRS Guamirim apresentam tolerância à germinação em pré-colheita. As combinações de TBIO Alvorada e TBIO Mestre com Fundacep Cristalino mostram alto potencial na recuperação de genótipos superiores para elevada produtividade de grãos e tolerância à germinação em pré-colheita.
Termos para indexação: Triticum aestivum, germinação na espiga, número de queda, divergência genética, seleção de parentais.
Introduction
High temperature and rainfall during the ripening and harvesting of wheat (Triticum aestivum L.) cause serious damages to grain yield and quality due to preharvest sprouting (PHS). The premature germination of seeds while still attached to the mother plant decreases flour quality, turning starch into sugars
(Kulwal et al., 2012), which makes the flour unsuitable for the baking process (Emebiri et al., 2010; Gavazza et al., 2012). In Brazil, PHS is very severe and, in bad years, the losses could reach more than US$100 million (Bassoi & Flintham, 2005).
(Emebiri et al., 2010; Martynov & Dobrotvorskaya, 2012; Zhang et al., 2014). However, selection of plants with tolerance to PHS is difficult, due to its quantitative inheritance (Fofana et al., 2009) and strong environmental influence (Bassoi et al., 2006). One of the main methods for evaluating PHS is the conventional test that simulates field conditions, in which spikes are immersed in water and kept wet for a certain period to allow the germination of sensitive genotypes. The germination index, sprouting index, and visual evaluation of sprouted seeds are also efficient in assessing tolerance to PHS. The germination index is used to measure the dormancy of isolated seeds, through the daily count of sprouted grains in ideal growing conditions of humidity and temperature in a germination chamber. The sprouting index and the visual evaluation of sprouted seeds consist of measuring seed dormancy in whole ears. For the sprouting index, the analysis is performed by simulating the wheat growing conditions, by subjecting the ears to artificial rainfall in protected environments. In the visual assessment, a grading scale from 1–9 is used to indicate the number of sprouted grains (Rasul et al., 2009). Tolerance to PHS can also be determined by: the percentage of germinated grains on the ear, obtained by counting the number of germinated grains (Kulwal et al., 2010); and the measurement of α‑amylase activity, expressed by the falling number on whole flour (Gooding et al., 2012).
The characterization of wheat cultivars in different Brazilian breeding programs for variables associated with grain yield and PHS is of paramount importance to rank the performance of elite lines. In order to identify genomic tools for the identification of genotypes tolerant to PHS, a good standardization of phenotyping methods is required. Furthermore, the measure of the genetic distances within the Brazilian gene pool enables the identification of new promising combinations for the selection of high-yielding and PHS-tolerant genotypes, aiming to change the wheat crop scenario in Brazil.
The objective of this work was to characterize the performance of elite wheat genotypes from different Brazilian breeding programs for traits associated with grain yield and preharvest sprouting.
Materials and Methods
The experiments were conducted in 2010 and 2011, in an experimental field located in the municipality
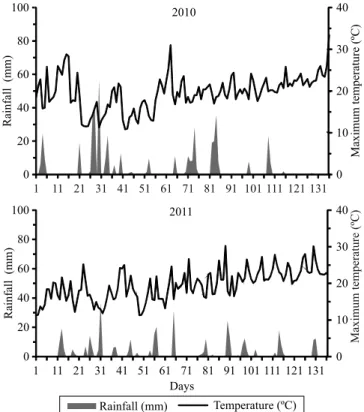
of Capão do Leão, in the state of Rio Grande do Sul, Brazil (31º52'00"S, 52º21'24"W, at an altitude of 13.24 m), where the annual rainfall was of 1,280.2 mm (Figure 1).
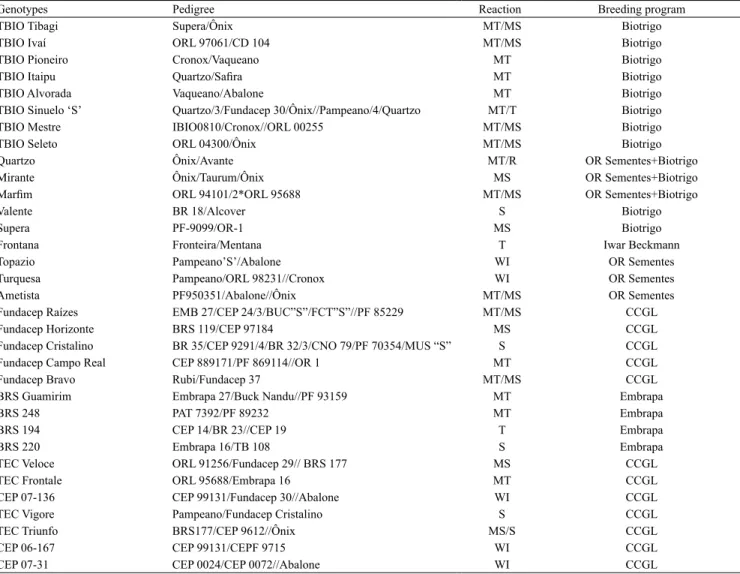
Thirty-three elite wheat genotypes were used, developed by the main breeding programs in Brazil (Table 1). The cultivar Frontana released in 1940 is considered the largest contribution of Brazilian wheat genotypes to the world, due to its resistance to leaf rust, to natural shattering, and to preharvest sprouting. The genotypes used in the present study were chosen according to the following criteria: commercially active, elite lines, and standards for tolerance (BRS 194 and Frontana) and sensitivity (BRS 220 and Valente) to preharvest sprouting in wheat.
Seeding was performed under a conventional system with a density of 300 viable seeds per square meter; the experimental unit consisted of five 5.0‑m‑length rows, spaced at 0.20 m. Two fungicide applications using Folicur (tebuconazole) were applied in both experimental years. A randomized complete block design with three replicates was used, and seeding was
performed in three distinct periods for all genotypes, obeying 10-day intervals. This was done so that the ear physiological maturity of the genotypes would coincide with the different cycles. Therefore, at harvest, all the ears were collected when the plants had lost their green color (physiological maturity), except for the culm nodes (Hanft & Wych, 1982).
In 2010 and 2011, ears were harvested and dried at room temperature for 7 days, placed in plastic bags, and frozen at -15°C, in order to maintain seed dormancy after harvest, until evaluation. For analyses of tolerance to PHS, germinated grains (GG, in percentage) and falling number (FN, in seconds) were scored. For the analysis of GG, a complete
randomized block design with three replicates was used; each replicate was composed of ten ears. The ears were immersed in distilled water for 8 hours, and later retrieved and placed on a paper towel in order to subtract the water excess. The fungicide Vitavax-Thiram (active ingredient Carboxin + Thiram: 200 + 200 g L-1) was applied to ears in the
recommended dosage. Ears were rolled up and put in a vertical position in previously-soaked germinating paper. The rolls were placed in plastic bags to avoid humidity loss and were incubated for 7 days at 20ºC±1°C in a BOD germination chamber. After 7 days of incubation, the rolls were retrieved and dried at 50ºC for 72 hours. After drying, the ears were
Table 1. Pedigree and reaction to ear sprouting of the 33 wheat (Triticum aestivum) genotypes evaluated(1).
Genotypes Pedigree Reaction Breeding program
TBIO Tibagi Supera/Ônix MT/MS Biotrigo
TBIO Ivaí ORL 97061/CD 104 MT/MS Biotrigo
TBIO Pioneiro Cronox/Vaqueano MT Biotrigo
TBIO Itaipu Quartzo/Safira MT Biotrigo
TBIO Alvorada Vaqueano/Abalone MT Biotrigo
TBIO Sinuelo ‘S’ Quartzo/3/Fundacep 30/Ônix//Pampeano/4/Quartzo MT/T Biotrigo
TBIO Mestre IBIO0810/Cronox//ORL 00255 MT/MS Biotrigo
TBIO Seleto ORL 04300/Ônix MT/MS Biotrigo
Quartzo Ônix/Avante MT/R OR Sementes+Biotrigo
Mirante Ônix/Taurum/Ônix MS OR Sementes+Biotrigo
Marfim ORL 94101/2*ORL 95688 MT/MS OR Sementes+Biotrigo
Valente BR 18/Alcover S Biotrigo
Supera PF-9099/OR-1 MS Biotrigo
Frontana Fronteira/Mentana T Iwar Beckmann
Topazio Pampeano’S’/Abalone WI OR Sementes
Turquesa Pampeano/ORL 98231//Cronox WI OR Sementes
Ametista PF950351/Abalone//Ônix MT/MS OR Sementes
Fundacep Raízes EMB 27/CEP 24/3/BUC”S”/FCT”S”//PF 85229 MT/MS CCGL
Fundacep Horizonte BRS 119/CEP 97184 MS CCGL
Fundacep Cristalino BR 35/CEP 9291/4/BR 32/3/CNO 79/PF 70354/MUS “S” S CCGL
Fundacep Campo Real CEP 889171/PF 869114//OR 1 MT CCGL
Fundacep Bravo Rubi/Fundacep 37 MT/MS CCGL
BRS Guamirim Embrapa 27/Buck Nandu//PF 93159 MT Embrapa
BRS 248 PAT 7392/PF 89232 MT Embrapa
BRS 194 CEP 14/BR 23//CEP 19 T Embrapa
BRS 220 Embrapa 16/TB 108 S Embrapa
TEC Veloce ORL 91256/Fundacep 29// BRS 177 MS CCGL
TEC Frontale ORL 95688/Embrapa 16 MT CCGL
CEP 07-136 CEP 99131/Fundacep 30//Abalone WI CCGL
TEC Vigore Pampeano/Fundacep Cristalino S CCGL
TEC Triunfo BRS177/CEP 9612//Ônix MS/S CCGL
CEP 06-167 CEP 99131/CEPF 9715 WI CCGL
CEP 07-31 CEP 0024/CEP 0072//Abalone WI CCGL
(1)Classification for sprouting in the ear according to Comissão Brasileira de Pesquisa de Trigo e Triticale. T, tolerant; MT/T, moderately tolerant to tolerant;
threshed and the numbers of germinated and total grains were counted.
For the evaluation of FN, a sample containing ears was threshed and the seeds were placed at 15% humidity, whereas the grains were grinded after 24 hours in an experimental CD1 mill (Chopin Technologies, Villeneuve‑la‑Garenne, France). Whole‑wheat flour was produced, from which 7.0 g samples were taken for the analyses. The FN test measures the effect of α‑amylase and targets the grains involved before the emission of radicles or pericarp breakage. FN was determined using the 56-81B method from AACC International (1995), in which the lower the FN value, the higher the enzyme content and activity. In both experimental years (2010 and 2011), the evaluations of FN were performed in an automatic falling number system, model FN 1500, (Perten Instruments France, Haguenau, France).
For the analyses of traits linked to yield, the following were measured: grain yield (GY, in kg ha-1); hectoliter
weight (HW, in kg hL-1); weight of a thousand grains
(WTG, in grams); number of fertile tillers (NFT, in units per meter); ear grain weight (EGW, in grams); and number of grains per ear (NGE, in units). The assessment of the NFT trait was performed in the field by samplings of 1.0 m in the middle of the three central lines of each observation unit of the plot. GY, HW, WTG, EGW, and NGE evaluations were performed in the laboratory after the plots were harvested.
For the GG and FN traits, analysis of variance was performed for detection of differences between the main effects (genotype and year) and of interactions between the main factors. Afterwards, for the eight phenotypic traits evaluated, analysis of variance and comparison of means were performed using the Scott-Knott test, at 5% probability, based on the means of the traits for both experimental years. The partitioning of the interaction of traits associated with PHS uncovered four phenotypic classes for germinated grains; however, in the following year, six classes were obtained (Table 2). Considering this difference, the following scores were adopted: a, sensitive; b–c, intermediate; and d, tolerant in 2010; and a–b, sensitive; c–d, intermediate; and e–f, tolerant in 2011. The analysis of FN clustered the genotypes in eight and six phenotypic classes in 2010 and 2011, respectively. Therefore, using the same criterion as for germinated grains, the genotypes were scored as follows: a–b,
tolerant; c–f, intermediate; and g–h, sensitive in 2010; and a–b, tolerant; c–d, intermediate; and e–f, sensitive in 2011.
The estimate of genetic dissimilarity was determined through the overall distance of Mahalanobis (D2)
between genotype pairs. From standard means, a genetic distance matrix was obtained. The relative contributions of the variables to genetic distance were obtained using the model described by Singh (1981). The Genes software (Viçosa, MG, Brazil) was used in all procedures. A dendrogram was obtained by the unweighted pair-group method with arithmetic mean (UPGMA) clustering method, using the NTSYS-pc software, version 2.1 (Rohlf, 2000). The cophenetic coefficient was calculated through the Mantel test, and cluster significance was determined by average dissimilarity (Sokal & Rohlf, 1962).
Results and Discussion
Analysis of variance showed interaction between main effects (p≤0.05) for all variables. The mean square values, based on the F test, for the experimental year were higher than the genotype effect, indicating a larger influence of the environment on the phenotype. This suggests a quantitative action on the components associated with PHS and grain yield. Although genotype contribution is important for the expression of components linked to grain yield, year and location have shown a stronger influence (Chenu et al., 2011). The strong GxE interaction for yield components, such as NFT, WTG, and NGE, indicate that more than one year of evaluation is needed for an effective characterization of performance in wheat genotypes (Valério et al., 2013). The strong environmental action on the dormancy and germination of wheat genotypes has been described, suggesting a quantitative inheritance (Bassoi et al., 2006). However, it is difficult to identify steady genotypes for PHS‑related traits when different growing conditions are compared (Rasul et al., 2012).
a higher number of classes was obtained, showing that this year favored PHS, probably because of the heavier rains at the end of the plant cycle (Figure 1). However, the analysis of GG indicated a higher stability for the TBIO Alvorada, Fundacep Horizonte, and BRS 194 genotypes, which did not differ between years.
The FN expresses the activity of the α‑amylase enzyme, in which the lower enzymatic activity in the sample is inferred from higher FN values
(Hagberg, 1960; Fofana et al., 2009). Therefore, the TBIO Pioneiro, Frontana, Fundacep Raízes, and BRS Guamirim genotypes were the ones with higher FN values. In 2010, a higher number of phenotypic classes was obtained, favored by a better harvesting condition due to reduced rainfall (Figure 1).
Variables indicative of PHS showed inconsistency when compared, i.e., genotypes with reduced germination values were not the same with higher FN values. The Frontana genotype, which is internationally recognized as a standard for tolerance to PHS, was fit when FN was analyzed. Some reports have shown low germination potential for the cultivar Frontana (Andreoli et al., 2006; Bassoi et al., 2006), reassuring its use as a control for tolerance to PHS. It is important to highlight that, although in 2011 the numbers of phenotypic classes for FN were similar among the PHS detecting variables (Table 2), twice as many phenotypic classes were obtained in 2010, facilitating the analysis of genetic variability for PHS expression.
The study of wheat populations indicated the presence of tolerant genotypes and the potential for obtaining genetic gains (Bassoi et al., 2006); however, few traits associated with tolerance to PHS have been reported. Though visual scoring (grain germination) can be relatively efficient, laboratory methods, such as FN, have shown to be more reliable in detecting the activity of enzymes linked to germination, even when seeds are not visibly germinated (Gelin et al., 2007). PHS evaluations using GG and FN are considered consistent and precise in wheat (Rasul et al., 2012). A high correlation between GG and FN has been observed (Gelin et al., 2007; Rasul et al., 2012). However, Fofana et al. (2008) found similar results to those of the present study, showing some inconsistency between variables and leaning towards the use of FN as a more reliable trait.
The expression of the α‑amylase enzyme and its occurrence at high levels in mature wheat grains have adverse consequences for processing by end users to produce value-added high quality wheat products. The accumulation of the α‑amylase enzyme is usually observed in two situations: when there is late maturity α‑amylase (LMA) activity and preharvest sprouting (Tan et al., 2010). LMA eventually affects all genotypes and affects FN, but not the percentage of GG. Therefore, differences in the associations between FN and GG may be determined by the LMA activity
Table 2. Performance per se of the evaluated wheat (Triticum aestivum) genotypes for the traits associated with preharvest sprouting in the analysis of simple effects of genotype x year(1).
Genotype Germinated grains (%) Falling number (s)
2010 2011 2010 2011
TBIO Tibagi 21Ab 24Ad 401Ac 380Ab
TBIO Ivaí 8Bd 19Ad 372Ad 377Ab
TBIO Pioneiro 32Aa 30Ac 418Ab 425Aa
TBIO Itaipu 15Ac 8Bf 372Ad 362Ac
TBIO Alvorada 8Ad 4Af 403Ac 381Ab
TBIO Sinuelo ‘S’ 10Bc 21Ad 323Af 330Ad
TBIO Mestre 23Ab 15Be 426Ab 361Bc
TBIO Seleto 22Bb 36Ab 362Ae 280Bf
Quartzo 15Ac 1Ae5 416Ab 312Be
Mirante 30Aa 28Ac 357Ae 348Ad
Marfim 25Bb 31Ac 439Ab 343Bd
Valente 23Bb 31Ac 316Af 336Ad
Supera 33Aa 19Bd 425Ab 323Be
Frontana 17Ac 16Ad 423Ab 389Bb
Topazio 9Bd 47Aa 198Bh 271Af
Turquesa 13Bc 21Ad 337Ae 342Ad
Ametista 35Aa 37Ab 398Ac 314Be
Fundacep Raízes 11Ac 11Ae 420Ab 384Bb Fundacep Horizonte 9Ad 14Ae 373Ad 337Bd Fundacep Cristalino 10Bc 27Ae 392Ac 386Ab Fundacep Campo Real 7Bd 15Ae 364Ae 332Bd
Fundacep Bravo 21Ab 9Bf 348Ae 356Ac
BRS Guamirim 8Bd 21Ad 477Aa 378Bb
BRS 248 11Bc 18Ad 342Ae 342Ad
BRS 194 6Ad 10Af 330Af 296Be
BRS 220 7Bd 21Ad 350Ae 364Ac
TEC Veloce 21Bb 33Ab 355Be 390Ab
TEC Frontale 13Bc 28Ac 298Af 256Bf
CEP 07-136 10Bc 20Ad 348Ae 318Be
TEC Vigore 20Bb 30Ac 375Ad 358Ac
TEC Triunfo 5Bd 36Ab 318Af 269Bf
CEP 06-167 6Bd 23Ad 377Ad 372Ab
CEP 07-31 4Bd 33Ab 257Ag 265Af
Mean 15B 23A 366A 341B
(1)Means followed by equal letters, lowercase in the columns and uppercase
present in some genotypes, which may be also partly attributable to the presence and expression of LMA in genotypes used in different experiments (Mares & Mrva 2008; Tan et al., 2010).
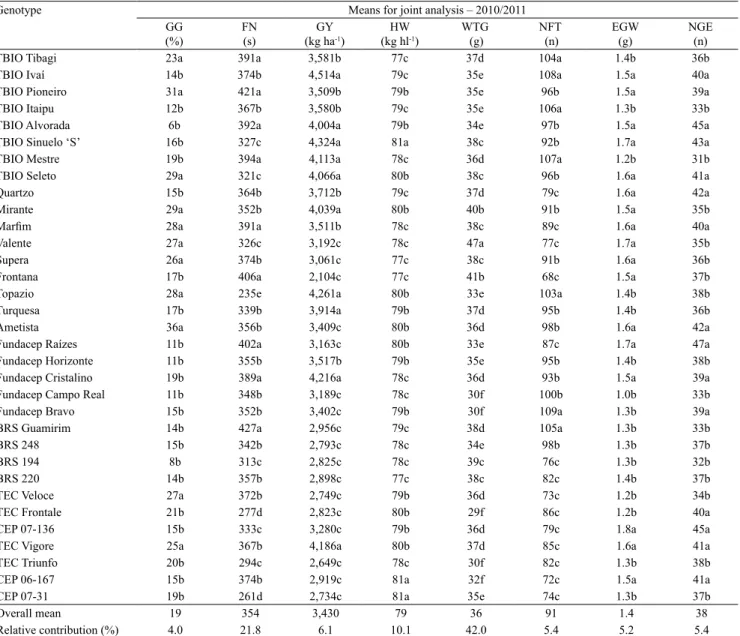
The joint analysis of wheat genotype performance for traits related to PHS and grain yield, and the combined analysis of GG and FN indicated a higher tolerance to PHS of the TBIO Alvorada, TBIO Mestre, Frontana, Fundacep Raízes, Fundacep Cristalino,
and BRS Guamirim genotypes (Table 3). Therefore, these genotypes have reduced germination values and higher FN. TBIO Alvorada, Frontana, and Fundacep Raízes also had higher tolerance to PHS in the trait specification analysis in each experimental year (Table 2). Among the cultivars with high PHS, TBIO Alvorada, TBIO Mestre, and Fundacep Cristalino had high grain yield. None of the tolerant cultivars showed high HW and high WTG. However,
Table 3. Performance per se of the evaluated wheat (Triticum aestivum) genotypes and relative contribution for total variability associated with preharvest sprouting and grain yield(1).
Genotype Means for joint analysis – 2010/2011
GG (%)
FN (s)
GY (kg ha-1)
HW (kg hl-1)
WTG (g)
NFT (n)
EGW (g)
NGE (n)
TBIO Tibagi 23a 391a 3,581b 77c 37d 104a 1.4b 36b
TBIO Ivaí 14b 374b 4,514a 79c 35e 108a 1.5a 40a
TBIO Pioneiro 31a 421a 3,509b 79b 35e 96b 1.5a 39a
TBIO Itaipu 12b 367b 3,580b 79c 35e 106a 1.3b 33b
TBIO Alvorada 6b 392a 4,004a 79b 34e 97b 1.5a 45a
TBIO Sinuelo ‘S’ 16b 327c 4,324a 81a 38c 92b 1.7a 43a
TBIO Mestre 19b 394a 4,113a 78c 36d 107a 1.2b 31b
TBIO Seleto 29a 321c 4,066a 80b 38c 96b 1.6a 41a
Quartzo 15b 364b 3,712b 79c 37d 79c 1.6a 42a
Mirante 29a 352b 4,039a 80b 40b 91b 1.5a 35b
Marfim 28a 391a 3,511b 78c 38c 89c 1.6a 40a
Valente 27a 326c 3,192c 78c 47a 77c 1.7a 35b
Supera 26a 374b 3,061c 77c 38c 91b 1.6a 36b
Frontana 17b 406a 2,104c 77c 41b 68c 1.5a 37b
Topazio 28a 235e 4,261a 80b 33e 103a 1.4b 38b
Turquesa 17b 339b 3,914a 79b 37d 95b 1.4b 36b
Ametista 36a 356b 3,409c 80b 36d 98b 1.6a 42a
Fundacep Raízes 11b 402a 3,163c 80b 33e 87c 1.7a 47a
Fundacep Horizonte 11b 355b 3,517b 79b 35e 95b 1.4b 38b
Fundacep Cristalino 19b 389a 4,216a 78c 36d 93b 1.5a 39a
Fundacep Campo Real 11b 348b 3,189c 78c 30f 100b 1.0b 33b
Fundacep Bravo 15b 352b 3,402c 79b 30f 109a 1.3b 39a
BRS Guamirim 14b 427a 2,956c 79c 38d 105a 1.3b 33b
BRS 248 15b 342b 2,793c 78c 34e 98b 1.3b 37b
BRS 194 8b 313c 2,825c 78c 39c 76c 1.3b 32b
BRS 220 14b 357b 2,898c 77c 38c 82c 1.4b 37b
TEC Veloce 27a 372b 2,749c 79b 36d 73c 1.2b 34b
TEC Frontale 21b 277d 2,823c 80b 29f 86c 1.2b 40a
CEP 07-136 15b 333c 3,280c 79b 36d 79c 1.8a 45a
TEC Vigore 25a 367b 4,186a 80b 37d 85c 1.6a 41a
TEC Triunfo 20b 294c 2,649c 78c 30f 82c 1.3b 38b
CEP 06-167 15b 374b 2,919c 81a 32f 72c 1.5a 41a
CEP 07-31 19b 261d 2,734c 81a 35e 74c 1.3b 37b
Overall mean 19 354 3,430 79 36 91 1.4 38
Relative contribution (%) 4.0 21.8 6.1 10.1 42.0 5.4 5.2 5.4
(1)Means followed by equal letters, in the columns, do not differ by the Scott-Knott test, at 5% probability. GG, germinated grains; FN, falling number; GY,
TBIO Sinuelo ‘S’, CEP 06-167, and CEP 07-31 showed high HW, whereas Valente showed the highest WTG. TBIO Mestre was the only one with tolerance to PHS, high grain yield, and high NFT. Although the ear traits, such as weight and number of grains, were superior in a large number of genotypes, only two phenotypic classes were detected, suggesting a narrow genetic variability for these variables (Table 3). However, the variables FN, GY, HW, and NFT allowed ranking of genotypes by providing at least three distinct phenotypic classes. WTG displayed the highest number of phenotypic classes for all variables. This reassures the differential relative contribution of variables on total variability with WTG, followed by FN and HW, contributing to the major differences found in the genetic distance cluster (Figure 2).
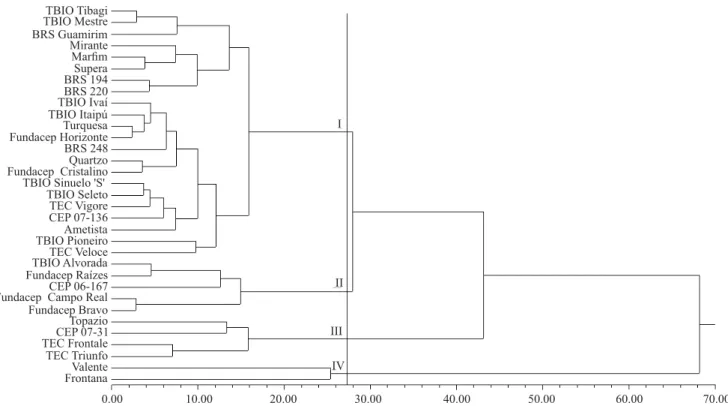
A detailed estimate of wheat genetic divergence was obtained by the analysis of genetic distance, through the overall distance of Mahalanobis, based on the traits
associated with PHS and GY (Figure 2). The analysis allowed the formation of four distinct groups. Group I was formed by the larger number of genotypes, whereas group IV by the smallest, consisting of only two individuals (Valente and Frontana). The joint analysis for tolerance to PHS (Table 3) indicated that, from the six superior genotypes, only TBIO Alvorada, TBIO Mestre, and Fundacep Cristalino had high grain yield. This shows the great potential of the combination of TBIO Mestre and Fundacep Cristalino (group I) with TBIO Alvorada (group II); these genotypes have high performance per se and are found in distinct groups (Figure 2).
Genetically distant genotypes with high performance per se are very promising to increase the genetic variability of superior recombinant genotypes (Bertan et al., 2009). The simultaneous analysis is an efficient tool to identify superior genotypes for the selection of high potential combinations for many traits. In white
Figure 2. Dendrogram depicting the analysis of 33 wheat (Triticum aestivum) genotypes obtained by the joint analysis of the 2010 and 2011 crop seasons based on eight phenotypic traits: germinated grains; falling number; grain yield; hectoliter weight; weight of a thousand grains; number of fertile tillers by linear meter; main ear grain weight; and number of grains of the main ear, obtained by the UPGMA clustering method and using the Mahalanobis distance as a measure of genetic
distance. The cophenetic correlation coefficient (r) is 0.73, and the average distance is 28.6. I, group I; II, group II; III, group
seed genotypes, these analyses were important for choosing potential parents and increasing tolerance to PHS (Malik et al., 2013).
Performance was studied for the selection of high tillering ability in wheat (Valério et al., 2009). In traits related to PHS and GY, the analysis of performance was efficient to discriminate the variability of wheat cultivars (Fofana et al., 2009; Gooding et al., 2012). The relative contribution of traits for genetic distance complements performance studies, since traits of reduced contribution would not be the ideal target because they decrease selection efficiency (Scheffer-Basso et al., 2014).
TBIO Alvorada showed superior tolerance to PHS in the analyses for each year and for both years (Tables 2 and 3), indicating a higher effectivity among the tolerant genotypes. However, not even the cultivar Frontana, which has been recognized as a control for tolerance to PHS, expresses the same yield potential when compared with current genotypes. Therefore, even if it is included in combinations for backcrosses, the quantitative expression of tolerance to PHS makes it difficult to obtain a larger genetic gain (Fofana et al., 2009). The results obtained for the best combinations can greatly contribute to Brazilian wheat breeding programs, as an important step in cultivar development with favorable alleles for grain yield combined with tolerance to PHS. Moreover, the validation of phenotyping assays will pave the way for future mapping studies of genes tolerant to PHS in the Brazilian germplasm.
Conclusions
1. The TBIO Alvorada, TBIO Mestre, Frontana, Fundacep Raízes, Fundacep Cristalino, and BRS Guamirim Brazilian wheat (Triticum aestivum) genotypes show tolerance to preharvest sprouting, through the combined analysis of sprouted grains and falling number.
2. Combinations of TBIO Alvorada and TBIO Mestre with Fundacep Cristalino show high potential of recovering superior genotypes for high grain yield and tolerance to preharvest sprouting.
Acknowledgments
To Conselho Nacional de Desenvolvimento Científico e Tecnológico (CNPq, process 407860/2012‑ 6), for financial support; and to CNPq, to Coordenação
de Aperfeiçoamento de Pessoal de Nível Superior (Capes), and to Fundação de Amparo à Pesquisa do Estado do Rio Grande do Sul (Fapergs), for scholarships awarded.
References
AACC INTERNATIONAL. Approved methods of the AACC
International. 9th ed. St. Paul: AACC International, 1995.
ANDREOLI, C.; BASSOI, M.C.; BRUNETTA, D. Genetic control of seed dormancy and preharvest sprouting in wheat.
Scientia Agricola, v.63, p.564-566, 2006. DOI: 10.1590/
S0103-90162006000600009.
BASSOI, M.C.; FLINTHAM, J. Relationship between grain colour and preharvest sprouting-resistance in wheat. Pesquisa
Agropecuária Brasileira, v.40, p.981-988, 2005. DOI: 10.1590/
S0100-204X2005001000006.
BASSOI, M.C.; FLINTHAM, J.; RIEDE, C.R. Analysis of preharvest sprouting in three Brazilian wheat populations.
Pesquisa Agropecuária Brasileira, v.41, p.583-590, 2006. DOI:
10.1590/S0100-204X2006000400006.
BERTAN, I.; CARVALHO, F.I.F. de; OLIVEIRA, A.C. de; BENIN, G.; VIEIRA, E.A.; VALÉRIO, I.P. Morphological, pedigree, and molecular distances and their association with hybrid wheat performance. Pesquisa Agropecuária Brasileira, v.44, p.155-163, 2009. DOI: 10.1590/S0100-204X2009000200007.
CHENU, K.; COOPER, M.; HAMMER, G.L.; MATHEWS, K.L.; DRECCER, M.F.; CHAPMAN, S.C. Environment characterization as an aid to wheat improvement: interpreting genotype-environment
interactions by modelling water‑deficit patterns in North‑Eastern
Australia. Journal of Experimental Botany, v.62, p.1743-1755, 2011. DOI: 10.1093/jxb/erq459.
EMEBIRI, L.C.; OLIVER, J.R.; MRVA, K.D.; MARES, D.
Association mapping of late maturity α‑amylase (LMA) activity
in a collection of synthetic hexaploid wheat. Molecular Breeding, v.26, p.39-49, 2010. DOI: 10.1007/s11032-009-9375-7.
FOFANA, B.; HUMPHREYS, D.G.; RASUL, G.; CLOUTIER, S.; BRÛLÉ-BABEL, A.; WOODS, S.; LUKOW, O.M.; SOMERS, D.J. Mapping quantitative trait loci controlling pre-harvest sprouting resistance in a red x white seeded spring wheat cross. Euphytica, v.165, p.509-521, 2009. DOI: 10.1007/s10681-008-9766-6.
FOFANA, B.; HUMPHREYS, G.; RASUL, G.; CLOUTIER, S.; SOMERS, D. Assessment of molecular diversity at QTLs for preharvest sprouting resistance in wheat using microsatellite markers. Genome, v.51, p.375-386, 2008. DOI: 10.1139/ G08-022.
GAVAZZA, M.I.A.; BASSOI, M.C.; CARVALHO, T.C. de; BESPALHOK, F.J.C.; PANOBIANCO, M. Methods for assessment of pre-harvest sprouting in wheat cultivars. Pesquisa
Agropecuária Brasileira, v.47, p.928-933, 2012. DOI: 10.1590/
S0100-204X2012000700008.
in durum wheat (Triticum turgidum L. var. durum). Cereal
Research Communications, v.35, p.53-61, 2007. DOI: 10.1556/
CRC.35.2007.1.7.
GOODING, M.J.; UPPAL, R.K.; ADDISU, M.; HARRIS, K.D.; UAUY, C.; SIMMONDS, J.R.; MURDOCH, A.J. Reduced height alleles (Rht) and Hagberg falling number of wheat. Journal
of Cereal Science, v.55, p.305-311, 2012. DOI: 10.1016/j.
jcs.2012.01.003.
HAGBERG, S. A rapid method for determining alpha-amylase activity. Cereal Chemistry, v.37, p.218-222, 1960.
HANFT, J.M.; WYCH, R.D. Visual indicators of physiological maturity of hard red spring wheat. Crop Science, v.22, p.584-587, 1982. DOI: 10.2135/cropsci1982.0011183X002200030036x.
KULWAL, P.; ISHIKAWA, G.; BENSCHER, D.; FENG, Z.; YU, L.X.; JADHAV, A.; MEHETRE, S.; SORRELLS, M.E. Association mapping for pre-harvest sprouting resistance in white winter wheat. Theoretical and Applied Genetics, v.125, p.793-805, 2012. DOI: 10.1007/s00122-012-1872-0.
KULWAL, P.L.; MIR, R.R.; KUMAR, S.; GUPTA, P.K. QTL analysis and molecular breeding for seed dormancy and pre-harvest sprouting tolerance in bread wheat. Journal of Plant Biology, v.37, p.59-74, 2010.
MALIK, R.; TIWARI, R.; ARORA, A.; KUMAR, P.; SHEORAN, S.; SHARMA, P.; SINGH, R.; TIWARI, V.; SHARMA, I. Genotypic characterization of elite Indian wheat genotypes using molecular markers and their pedigree analysis. Australian Journal of Crop
Science, v.7, p.561-567, 2013.
MARES, D.; MRVA, K. Late‑maturity α‑amylase: low falling
number in wheat in the absence of preharvest sprouting.
Journal of Cereal Science, v.47, p.6-17, 2008. DOI: 10.1016/j.
jcs.2007.01.005.
MARTYNOV, S.P.; DOBROTVORSKAYA, T.V. Resistance of bread wheat (Triticum aestivum L.) to preharvest sprouting: an association analysis. Russian Journal of Genetics, v.48, p.975-984, 2012. DOI: 10.1134/S1022795412100055.
RASUL, G.; HUMPHREYS, D.G.; BRÛLÉ-BABEL, A.; MCCARTNEY, C.; KNOX, R.E.; DEPAUW, R.M.; SOMERS, D.J. Mapping QTLs for pre-harvest sprouting traits in the spring wheat cross ‘RL4452/AC Domain’. Euphytica, v.168, p.363-378, 2009. DOI: 10.1007/s10681-009-9934-3.
RASUL, G.; HUMPHREYS, G.D.; WU, J.; BRÛLÉ-BABEL, A.; FOFANA, B.; GLOVER, K.D. Evaluation of preharvest sprouting traits in a collection of spring wheat germplasm using genotype and genotype x environment interaction model. Plant Breeding, v.131, p.244-251, 2012. DOI: 10.1111/j.1439-0523.2011.01931.x.
ROHLF, F.J. NTSYS‑pc: numerical taxonomy and multivariate analysis system. Version 2.1. Exeter Software: State University of New York, 2000. 38p.
SCHEFFER-BASSO, S.M.; FAVARETTO, A.; FELINI, V.; GOMES, C.C.; CARNEIRO, L.E.; CECCHIN, K. Genetic divergence among accessions of Axonopus jesuiticus x A.
scoparius based on morphological and agronomical traits. Anais
da Academia Brasileira de Ciências, v.86, p.475-483, 2014. DOI:
10.1590/0001-3765201420130047.
SINGH, D. The relative importance of characters affecting genetic divergence. TheIndian Journal of Genetic and Plant Breeding, v.41, p.237-245, 1981.
SOKAL, R.R.; ROHLF, F.J. The comparison of dendrograms by objective methods. Taxonomy, v.11, p.33-40, 1962. DOI: 10.2307/1217208.
TAN, M.K.; VERBYLA, A.P.; CULLIS, B.R.; MARTIN, P.; MILGATE, A.W.; OLIVER, J.R. Genetics of late maturity
α‑amylase in a doubled haploid wheat population. Crop and
Pasture Science, v.61, p.153-161, 2010. DOI: 10.1071/CP09239.
VALÉRIO, I.P.; CARVALHO, F.I.F. de; BENIN, G.; SILVEIRA, G. da; SILVA, J.A.G. da; NORNBERG, R.; HAGEMANN, T.; LUCHE, H. de S.; OLIVEIRA, A.C. de. Seeding density in wheat: the more, the merrier? Scientia Agricola, v.70, p.176-184, 2013. DOI: 10.1590/S0103-90162013000300006.
VALÉRIO, I.P.; CARVALHO, F.I.F. de; OLIVEIRA, A.C. de; BENIN, G.; SOUZA, V.Q. de; MACHADO, A. de A.; BERTAN, I.; BUSATO, C.C.; SILVEIRA, G. da; FONSECA, D.A.R. Seed density in wheat genotypes as a function of tillering potential. Scientia Agricola, v.66, p.28-39, 2009. DOI: 10.1590/ S0103-90162009000100004.
ZHANG, Y.; MIAO, X.; XIA, X.; HE, Z. Cloning of seed dormancy genes (TaSdr) associated with tolerance to pre-harvest sprouting in common wheat and development of a functional marker.
Theoretical and Applied Genetics, v.27, p.855-866, 2014. DOI:
10.1007/s00122-014-2262-6.