Vinícius Jardel Szareski(1), Ivan Ricardo Carvalho(1), Kassiana Kehl(2), Alexandre Moscarelli Levien(2),
Maicon Nardino(1), Simone Morgan Dellagostin(1), Gustavo Henrique Demari(1), Francine Lautenchleger(3),
Francisco Amaral Villela(1), Tiago Pedó(1), Velci Queiróz de Souza(4) and Tiago Zanatta Aumonde(1)
(1)Universidade Federal de Pelotas, Campus Universitário, s/no, CEP 96010-610 Capão do Leão, RS, Brazil. E-mail: [email protected],
[email protected], [email protected], [email protected], [email protected], [email protected], [email protected], [email protected] (2)Fundação Pró-Sementes, Matriz Passo Fundo, Rua Diogo de Oliveira, no 640,
CEP 99025-130 Passo Fundo, RS, Brazil. E-mail: [email protected], [email protected]
(3)Universidade Estadual de Maringá, Avenida Colombo, no 5.790, Jardim Universitário, CEP 87020-900 Maringá, PR, Brazil. E-mail:
[email protected] (4)Universidade Federal do Pampa, Rua 21 de Abril, no 80, São Gregório, CEP 96450-000 Dom Pedrito, RS,
Brazil. E-mail: [email protected]
Abstract – The objective of this work was to evaluate the adaptability and multi-trait stability of wheat (Triticum aestivum) genotypes according to the phenotypic index of seed vigor (PIV). Thirty wheat genotypes were grown in seven environments in the state of Rio Grande do Sul, Brazil, during one crop season. In each environment, a randomized complete block design with three replicates was used. The PIV was elaborated from the following traits: first germination count, germination percentage, accelerated aging, and electrical conductivity. The evaluated phenotypic index makes it possible to define macroenvironments for the production of wheat seeds with high physiological potential and to understand the implications of the genotype x environment interaction. The phenotypic index of seed vigor is effective to rank genotypes considering multi-trait selection related to the vigor of wheat seeds produced in Southern Brazil.
Index terms: Triticum aestivum, accelerated aging, AMMI, electrical conductivity, mixed models, seed quality.
Adaptabilidade e estabilidade de genótipos de trigo de
acordo com índice fenotípico de vigor de sementes
Resumo – O objetivo deste trabalho foi avaliar a adaptabilidade e a estabilidade multicaráter de genótipos de trigo (Triticum aestivum) de acordo com índice fenotípico de vigor de sementes (IFV). Trinta genótipos de trigo foram cultivados em sete ambientes, no Estado do Rio Grande do Sul, durante uma safra. Em cada ambiente, utilizou-se o delineamento de blocos ao acaso, com três repetições. O IFV foi elaborado a partir das seguintes características: primeira contagem da germinação, percentagem de germinação, envelhecimento acelerado e condutividade elétrica. O índice fenotípico avaliado possibilita definir macroambientes para a produção de sementes de trigo com alto potencial fisiológico e compreender as implicações da interação genótipo x ambiente. O índice fenotípico de vigor de sementes é efetivo para classificar os genótipos ao se considerar a seleção de múltiplas características relacionadas ao vigor de sementes de trigo produzidas na região Sul do Brasil.
Termos para indexação: Triticum aestivum, envelhecimento acelerado, AMMI, condutividade elétrica, modelos mistos, qualidade de sementes.
Introduction
Low vigor seeds may result in reduced germination speed and seedling emergence uniformity, which can affect the initial establishment of the crop and the final plant stand, significantly compromising grain yield (Peske et al., 2012). Seed quality is affected by edaphoclimatic conditions, sowing season, growing environment, genotype, pests, nutritional
management, timing, and harvest and post-harvest practices (Marcos-Filho, 2015).
genotype. In this context, the use of the phenotypic index of seed vigor (PIV) can provide an estimative of the multi-trait response of important seed quality traits, such as first count, germination, accelerated aging, and electrical conductivity, in order to obtain accurate and reliable estimates of the physiological performance of wheat seeds. The multi-trait approach has been used in passion fruit (Oliveira et al., 2008) and eucalyptus (Nunes, 2015; Santos et al., 2016); however, no works dealing with this phenotype index for wheat were found in the literature.
The additive main effects and multiplicative interaction (AMMI) analysis combines, in a single model, additive components for main effects (genotypes and environments) and multiplicative components for effects of the genotype x environment (G x E) interaction, in which the experimental measures refer to a single biological trait (Duarte & Vencovsky, 1999). The REML\Blup method estimates statistics based on the harmonic mean of genotypic values (HMGV) to stability, the relative performance of genotypic values (RPGV) to adaptability, and the harmonic mean of the relative performance of genotypic values (HMRPGV) of the stability and adaptability parameters (Resende, 2007). This biometric strategy has the advantage of revealing the randomness of the genotypic effects, but does not underestimate the effects of the G x E interaction, allowing to rank genotypes according to their performance based on genetic effects (Resende et al., 2001).
The objective of this work was to evaluate the adaptability and multi-trait stability of wheat genotypes according to the PIV.
Materials and Methods
The experiments were conducted in a randomized complete block design, organized in a factorial arrangement, with seven growing environments and 30 wheat (Triticum aestivum L.) genotypes, with three replicates. In all growing environments, sowing occurred in the second half of May 2016. The experimental units were composed of five sowing lines, spaced 0.20 m apart and with 5.0-m length. A total of 330 viable seeds per square meter was used as the standard population density, and 250 kg ha-1 N-P2O5-K2O (08-25-20) plus 50 kg ha-1 N (urea, 46% N) were applied as fertilizer during the full tillering stage.
The studied genotypes and growing environments are described in Table 1.
The physiological quality of the seeds was evaluated in the didactic laboratory for seed analysis of Universidade Federal de Pelotas, located in the state of Rio Grande do Sul, Brazil. The following attributes were determined: FC, first germination count; G, final germination; AA, accelerated aging; and EC, electrical conductivity. Seed moisture content was obtained according to the Brazilian rules for seed testing (Brasil, 2009).
Germination was assessed using three subsamples of 50 seeds per treatment; the seeds were germinated on germitest paper, moistened 2.5 times the dry substrate mass. The rolls were packed in germinators, at 20°C constant temperature, and the percentage of normal seedlings was determined eight days after the start of the test. Together with the germination test, FC was evaluated four days after sowing, and the results were also given in percentage of normal seedlings (Brasil, 2009).
To assess AA, seeds were placed on a metallic screen, fixed inside a gerbox containing 40 mL saturated saline solution (11 g NaCl per 100 mL water), according to Pedroso et al. (2010). The gerboxes containing the seeds were kept in a BOD chamber, at 41°C, for 72 hours (Marcos Filho, 1994). After this period, the seeds were subjected to the germination test (Brasil, 2009).
After the determination of seed dry matter mass, EC was evaluated using three subsamples of 50 seeds, which were packed in polyethylene containers with 75 mL deionized water and kept in a germinator at 20°C. EC was read after 24 hours (Vieira & Krzyzanowski, 1999).
The obtained PIVs were subjected to the analysis of variance, at 5% probability, for each growing environment. A joint analysis was carried out to identify the presence of interaction between growing environments and wheat genotypes, also at 5% probability. When a significant G x E interaction was observed, adaptability and phenotypic stability were analyzed according to the AMMI method (Zobel et al., 1988). In order to distinguish genotype performances, the Scott-Knott test was used. Thereafter, the method based on restricted maximum likelihood (REML) was adopted to identify the significance of the components of variance and of the genetic parameters obtained, through the chi-square (x2) test, at 5% probability (Resende, 2007). The variance components and the genetic parameters for the PIV were estimated, and the predictions of the best linear unbiased predictor (Blup) were obtained for each growing environment, which made it possible to rank the genotypes according to their predicted genetic value. This model allows the analysis of stability estimates with the HMGV and RPGV, as well as of stability and adaptability with the HMRPGV, according to Resende (2007).
Results and Discussion
The analysis of variance revealed a significant interaction among growing environments and wheat genotypes (G x E) for PIV estimates. The AMMI analysis showed that only the first axis of the main components representing the sum of squares of the interaction (EPCA1) was significant, explaining 39.6% of the existing variation. This magnitude of explanation can be considered satisfactory for a multi-trait index, which combines information from four physiological tests sensible to variations in the growing environment. The first significant axis represents the largest eigenvalues and expresses the largest fraction of data; the noise is captured in the last axis (Resende et al., 2014).
These adaptive relationships can be identified in the biplot chart obtained with the AMMI method scores. The ORS 1403, TBIO Sossego, Estrela Atria, ORS Vintecinco, and ORS 1401 genotypes had superior PIV estimates (Table 2) and showed general adaptability to the Santo Augusto, Passo Fundo, and São Gabriel environments found in the upper right quadrant (Figure 1). In contrast, the Esporão, LGPrisma, CD 1440, TBio Tibagi, and BRS 331 genotypes were located in the lower left quadrant,
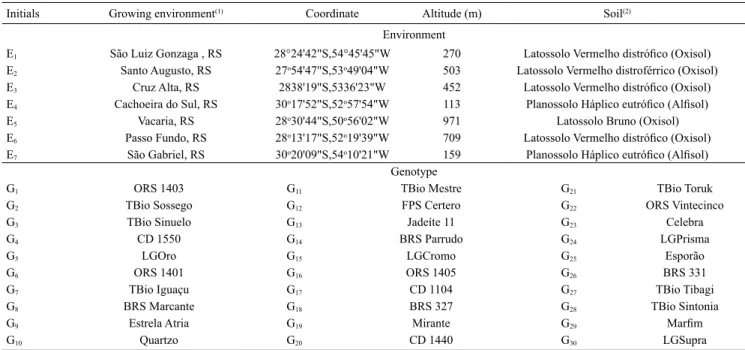
Table 1. Geographic information, altitude, soil type, genotypes used, and growing environments for the 2016 crop season.
Initials Growing environment(1) Coordinate Altitude (m) Soil(2)
Environment
E1 São Luiz Gonzaga , RS 28°24'42"S,54°45'45"W 270 Latossolo Vermelho distrófico (Oxisol)
E2 Santo Augusto, RS 27o54'47"S,53o49'04"W 503 Latossolo Vermelho distroférrico (Oxisol)
E3 Cruz Alta, RS 2838'19"S,5336'23"W 452 Latossolo Vermelho distrófico (Oxisol)
E4 Cachoeira do Sul, RS 30o17'52"S,52o57'54"W 113 Planossolo Háplico eutrófico (Alfisol)
E5 Vacaria, RS 28o30'44"S,50o56'02"W 971 Latossolo Bruno (Oxisol)
E6 Passo Fundo, RS 28o13'17"S,52o19'39"W 709 Latossolo Vermelho distrófico (Oxisol)
E7 São Gabriel, RS 30o20'09"S,54o10'21"W 159 Planossolo Háplico eutrófico (Alfisol)
Genotype
G1 ORS 1403 G11 TBio Mestre G21 TBio Toruk
G2 TBio Sossego G12 FPS Certero G22 ORS Vintecinco
G3 TBio Sinuelo G13 Jadeíte 11 G23 Celebra
G4 CD 1550 G14 BRS Parrudo G24 LGPrisma
G5 LGOro G15 LGCromo G25 Esporão
G6 ORS 1401 G16 ORS 1405 G26 BRS 331
G7 TBio Iguaçu G17 CD 1104 G27 TBio Tibagi
G8 BRS Marcante G18 BRS 327 G28 TBio Sintonia
G9 Estrela Atria G19 Mirante G29 Marfim
G10 Quartzo G20 CD 1440 G30 LGSupra
showing specific adaptation to the Cachoeira do Sul, São Luiz Gonzaga, and Vacaria environments. The Celebra and TBio Mestre genotypes were found in the
lower right quadrant and were specifically adapted to the Cruz Alta environment.
Both genotypes and environments with low scores, when located near the origin of the biplot coordinate system, contribute little to the interaction, which, in this case, is characterized as stable; the more distant from the point of origin, the lower is the stability of the trait being evaluated (Duarte & Vencovsky, 1999; Szareski et al., 2017). In this sense, Cachoeira do Sul was considered stable, revealing the smallest contribution to the G x E interaction (EPCA1, -5.75); however, this environment showed PIV estimates lower than the overall mean of the experiment (PIV=2,132). The São Luiz Gonzaga and Vacaria growing environments
Table 2. Estimates of the phenotypic index of seed vigor (PIV) obtained with the additive main effects and multiplicative interaction method for seven growing environments and 30 wheat (Triticum aestivum) genotypes, in the 2016 crop season(1).
Variable PIV EPCA1(2)
Genotype
ORS 1403 2,452.61a 9.75 TBio Sossego 2,339.25a 25.20 TBio Sinuelo 2,077.62b 3.25 CD 1550 1,993.59b -0.26 LGOro 2,337.11a -1.97 ORS 1401 2,375.72a 7.25 TBio Iguaçu 2,126.42b -5.54 BRS Marcante 2,206.89a 0.42 Estrela Atria 2,452.95a 19.70 Quartzo 2,136.59b 3.43 TBio Mestre 2,380.71a -14.59 FPS Certero 1,978.29b 15.89 Jadeíte 11 1,984.24b 4.73 BRS Parrudo 2,178.41a -3.56 LGCromo 2,582.28a -2.06 ORS 1405 1,967.26b 8.08 CD 1104 2,094.81b 6.37 BRS 327 2,097.84b 1.92 Mirante 2,026.15b -1.63 CD 1440 1,964.52b -6.43 TBio Toruk 2,084.35b 5.35 ORS Vintecinco 2,331.01a 12.92 Celebra 2,277.04a -20.20 LGPrisma 1,849.33b -7.95 Esporão 1,532.66b -10.29 BRS 331 1,744.17b -13.95 TBio Tibagi 1,632.35b -23.30 TBio Sintonia 2,113.87b -7.73
Marfim 2,475.94a 0.19
LGSupra 2,151.53b -4.99 Environment(3)
São Luiz Gonzaga, RS 1,146.93 -10.24 Santo Augusto, RS 2,330.04 24.38 Cruz Alta, RS 2,383.15 -32.56 Cachoeira do Sul, RS 1,629.38 -5.75 Vacaria, RS 1,250.61 -21.07 Passo Fundo, RS 3,211.88 12.14 São Gabriel, RS 2,968.60 33.10
(1)Means followed by equal letters do not differ by the Scott & Knott test, at
5% probability. (2)EPCA1, first axis of the main components representing
the sum of squares of the interaction. (3)RS, state of Rio Grande do Sul,
Brazil.
also had PIV estimates lower than the overall mean, being characterized as unstable, with EPCA1 values of -10.24 and -21.07, respectively (Figure 1 and Table 2). In contrast, Santo Augusto, Cruz Alta, Passo Fundo, and São Gabriel presented EPCA1 scores of 24.38, -32.56, 12.14, and 33.10, respectively (Table 2 and Figure 1). Therefore, these environments were unstable; however, because their PIV was higher than the overall mean of the experiment, they still may be specific for certain genotypes, favoring high PIV in seed production.
The genotypes considered stable, with PIV revealing the smallest contribution to the G x E interaction, were Marfim, CD 1550, BRS Marcante, Mirante, BRS 327, LGOro, and LGCromo. These genotypes, therefore, can be used in all growing environments tested. However, only Marfim, BRS Marcante, LGOro, and LGCromo were stable and revealed PIV above the overall mean of the experiment (Table 2 and Figure 1).
The PIV averages revealed two groups of genotypes according to the Scott-Knott test. The superior group comprehended 40% of the genotypes (Table 2) and was formed by: LGCromo, Marfim, Estrela Atria, ORS 1403, TBio Mestre, ORS 1401, TBio Sossego, LGOro, ORS Vintecinco, Celebra, BRS Marcante, and BRS Parrudo. The second group, in general, was formed by the following genotypes with inferior PIV values: LGSupra, Quartzo, TBio Iguaçu, TBio Sintonia, BRS 327, CD 1104, TBIO Toruk, TBIO Sinuelo, Mirante, CD 1550, Jadeíte 11, FPS Certero, CD 1440, LGPrisma, BRS 331, TBio Tibagi, and Esporão.
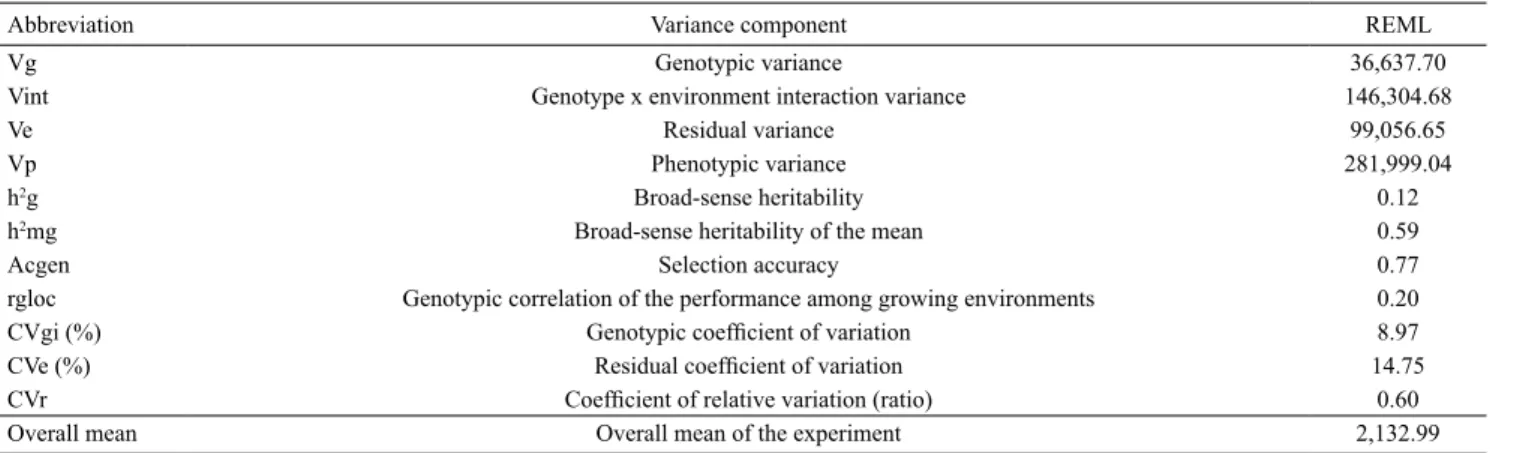
Estimates of the variance components and of the genetic parameters obtained with REML were split in percentages of their contribution to the PIV, according to Carvalho et al. (2017a), where the genotypic variance was responsible for 12.9% of the phenotypic manifestation of the PIV (Table 3) and the G x E interaction (Vint) was responsible for 51.8%. However, 64.7% of the Vint effects were due to genetic effects. It is known that the PIV values are closely related to the characteristics of the genotype; however, the environment is also determinant for the production of seeds with high physiological quality (Borges et al., 2010).
The broad-sense heritability of the mean had estimates of 0.59, which reflects a considerable genetic variability among the tested genotypes. These estimates are supported by a high accuracy (Acgen of 0.77), allowing good precision in inferences regarding the PIV. Accuracy depends on the residual and genotypic fractions of the variance in the experimental trial (Carvalho et al., 2017b), and greater accuracies allow a greater predictability of genetic value (Resende & Duarte, 2007).
The genotypic correlation between genotype performance and growing environments (rgloc) allows classifying the nature of the interaction – whether simple or complex –, and a high rgloc indicates a simple kind of interaction, which results in lower distortions in genotype classification (Pupin et al., 2015). However, the search for lower rgloc values can result in the identification of complex interactions,
Table 3. Estimates of the variance components and of the genetic parameters of maximum restricted likelihood (REML) for the phenotypic index of seed vigor (PIV) obtained for 30 wheat (Triticum aestivum) genotypes grown in seven environments, in the state of Rio Grande do Sul, Brazil, in 2016.
Abbreviation Variance component REML
Vg Genotypic variance 36,637.70
Vint Genotype x environment interaction variance 146,304.68
Ve Residual variance 99,056.65
Vp Phenotypic variance 281,999.04
h2g Broad-sense heritability 0.12
h2mg Broad-sense heritability of the mean 0.59
Acgen Selection accuracy 0.77
rgloc Genotypic correlation of the performance among growing environments 0.20 CVgi (%) Genotypic coefficient of variation 8.97 CVe (%) Residual coefficient of variation 14.75
CVr Coefficient of relative variation (ratio) 0.60
which harm the selection and ranking of the genotypes in the evaluated environments (Rosado et al., 2012). In this study, the obtained rgloc of 0.20 (Table 3) indicates an interaction of complex nature, which means that genotype selection should be performed in each growing environment.
The genotypic coefficient of variation (CVgi) quantifies the genetic fraction responsible for total variation in the PIV, with high magnitudes being desirable. The CVgi obtained here (8.97%) indicates high genetic variability among genotypes regarding the PIV. The relationship between the CVgi and the residual coefficient of variation (CVe) allows determining the coefficient of relative variation (CVr),
which indicates a favorable situation for selection when magnitudes are higher than 1.0 (Vencovsky & Barriga, 1992); this allows to infer with high accuracy and precision (Resende & Duarte, 2007). It should be noted that the CVr of 0.60 obtained in the present work was low (Table 3).
The Blup method predicted the PIV values of the genotypes in each environment (Table 4), revealing overall superiority of the LGCromo, Marfim, ORS 1403, Estrela Atria, ORS 1401, TBio Mestre, TBio Sossego, LGOro, ORS Vintecinco, and Celebra genotypes in all growing environments. In the São Luiz Gonzaga environment, ORS 1401, Celebra, TBio Toruk, TBio Tibagi, LGCromo, BRS Marcante,
Table 4. Ranking predicted by the best linear unbiased predictor (Blup) for the phenotypic index of seed vigor (PIV) obtained for 30 wheat (Triticum aestivum) genotypes grown in seven environments, in the state of Rio Grande do Sul, Brazil, in 2016.
Ranking(1) Genotype Growing environment(2)
E1 E2 E3 E4 E5 E6 E7
1 LGCromo ORS 1401 Estrela Atria TBio Mestre LGCromo Marfim LGCromo TBio Sossego
2 Marfim Celebra LGCromo Celebra TBio Sinuelo BRS Marcante TBio Sinuelo Estrela Atria
3 ORS 1403 TBio Toruk ORS 1401 LGCromo ORS 1403 BRS Parrudo ORS Vintecinco ORS 1403
4 Estrela Atria TBio Tibagi ORS 1403 Marfim CD 1440 TBio Tibagi TBio Sossego ORS Vintecinco
5 ORS 1401 LGCromo ORS Vintecinco LGOro BRS Marcante Celebra BRS 327 ORS 1401
6 TBio Mestre BRS Marcante Marfim TBio Sintonia Marfim BRS 327 Estrela Atria Marfim
7 TBio Sossego Marfim FPS Certero LGPrisma ORS 1401 LGSupra LGSupra CD 1104
8 LGOro TBio Sossego LGOro TBio Iguaçu LGOro CD 1104 TBio Toruk Quartzo
9 ORS Vintecinco ORS 1405 TBio Sossego ORS Vintecinco Estrela Atria ORS 1403 LGOro TBio Toruk
10 Celebra BRS Parrudo TBio Sinuelo LGSupra TBio Sossego Mirante TBio Sintonia ORS 1405
11 BRS Marcante LGPrisma BRS Marcante ORS 1401 TBio Mestre Quartzo TBio Mestre FPS Certero
12 BRS Parrudo Jadeíte 11 TBio Mestre BRS 331 CD 1104 LGCromo ORS 1403 BRS 327
13 LGSupra ORS 1403 LGSupra ORS 1403 TBio Iguaçu LGOro Celebra BRS Marcante
14 BRS 327 Estrela Atria Jadeíte 11 BRS Parrudo Quartzo TBio Mestre FPS Certero CD 1550
15 Quartzo BRS 327 BRS Parrudo Estrela Atria Mirante CD 1550 TBio Iguaçu BRS Parrudo
16 TBio Iguaçu LGOro BRS 327 BRS 327 TBio Sintonia Jadeíte 11 Jadeíte 11 TBio Iguaçu
17 TBio Sintonia TBio Sintonia Celebra TBio Toruk Celebra CD 1440 ORS 1405 LGOro
18 CD 1104 FPS Certero CD 1104 CD 1440 CD 1550 TBio Sintonia Quartzo Mirante
19 TBio Sinuelo Quartzo CD 1550 CD 1550 BRS Parrudo FPS Certero BRS Parrudo TBio Sintonia
20 TBio Toruk Mirante TBio Toruk Quartzo Jadeíte 11 TBio Iguaçu Mirante TBio Mestre
21 Mirante TBio Mestre LGPrisma TBio Tibagi ORS Vintecinco ORS 1401 CD 1104 CD 1440
22 CD 1550 CD 1550 ORS 1405 BRS Marcante LGSupra BRS 331 Marfim LGCromo
23 Jadeíte 11 LGSupra Quartzo Mirante TBio Tibagi TBio Toruk ORS 1401 Jadeíte 11
24 FPS Certero TBio Sinuelo TBio Iguaçu ORS 1405 LGPrisma ORS Vintecinco Esporão LGSupra
25 CD 1440 TBio Iguaçu Mirante Esporão BRS 331 Estrela Atria CD 1550 LGPrisma
26 ORS 1405 BRS 331 TBio Sintonia TBio Sossego TBio Toruk TBio Sinuelo CD 1440 Celebra
27 LGPrisma Esporão CD 1440 CD 1104 BRS 327 ORS 1405 BRS Marcante BRS 331
28 BRS 331 ORS Vintecinco BRS 331 TBio Sinuelo ORS 1405 Esporão LGPrisma TBio Sinuelo
29 TBio Tibagi CD 1440 Esporão Jadeíte 11 Esporão TBio Sossego BRS 331 TBio Tibagi
30 Esporão CD 1104 TBio Tibagi FPS Certero FPS Certero LGPrisma TBio Tibagi Esporão
(1)Genotype ranking based on the predicted genetic value. (2)Environments in the state of Rio Grande do Sul: E1, São Luiz Gonzaga; E2, Santo Augusto; E3, Cruz Alta; E4,
Marfim, TBio Sossego, ORS 1405, and BRS Parrudo had superior PIV estimates. In the Santo Augusto environment, Estrela Atria, LGCromo, ORS 1401, ORS 1403, ORS Vintecinco, Marfim, FPS Certero, LGOro, TBio Sossego, and TBio Sinuelo were superior. In the Cruz Alta environment, the TBio Mestre, Celebra, LGCromo, Marfim, LGOro, TBio Sintonia, LGPrisma, TBio Iguaçu, ORS Vintecinco, and LGSupra genotypes stood out. In the Cachoeira do Sul environment, LGCromo, TBIO Sinuelo, ORS 1403, CD 1440, BRS Marcante, Marfim, ORS 1401, LGOro, Estrela Atria, and TBio Sossego were superior. In the Vacaria environment, Marfim, BRS Marcante, BRS Parrudo, TBio Tibagi, Celebra, BRS 327, LGSupra,
CD 1104, ORS 1403, and Mirante were highlighted. In the Passo Fundo environment, the LGCromo, TBio Sinuelo, ORS Vintecinco, TBio Sossego, BRS 327, Estrela Atria, LGSupra, TBio Toruk, LGOro, and TBio Sintonia genotypes stood out. Finally, in the São Gabriel environment, TBio Sossego, Estrela Atria, ORS 1403, ORS Vintecinco, ORS 1401, Marfim, CD 1104, Quartzo, TBIO Toruk, and ORS 1405 were superior.
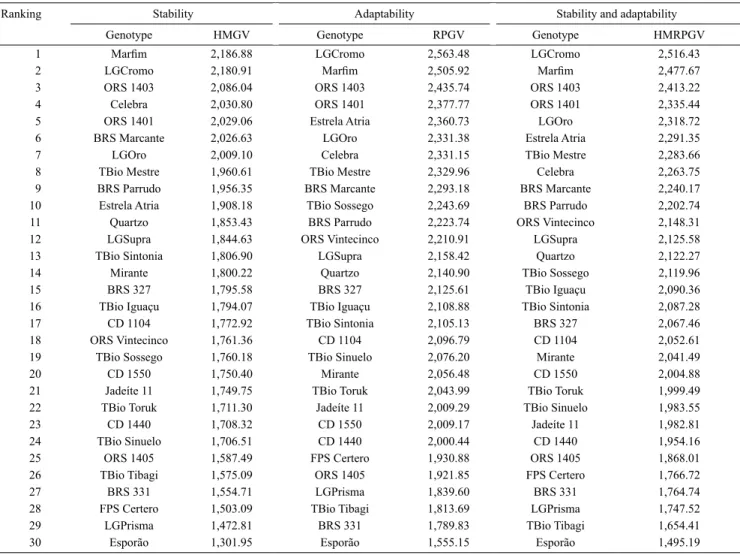
The HMGV refers to the phenotypic stability (Table 5) of the PIV values. This method adjusts the predicted genetic values penalizing them according to the instability of the cultivated genotypes in the evaluated environments (Borges et al., 2010). The highest stability
Table 5. Stability (HMGV), adaptability (RPGV), and stability and adaptability of genotypic values (HMRPGV) for the phenotypic index of seed vigor (PIV) obtained for the 30 wheat (Triticum aestivum) genotypes grown in seven environments, in the state of Rio Grande do Sul, Brazil, in the 2016 crop season.
Ranking Stability Adaptability Stability and adaptability Genotype HMGV Genotype RPGV Genotype HMRPGV
1 Marfim 2,186.88 LGCromo 2,563.48 LGCromo 2,516.43
for the PIV, according to this method, was obtained, in descending order, with the Marfim, LGCromo, ORS 1403, Celebra, and ORS 140 genotypes. The HMGV method is based on the phenotypic measures used to predict the genetic value of the genotypes, taking into account the harmonic means and deviations in each environment.
The adaptability method of the genotypic values (RPGV) can capitalize the response of genotypes to improvements in the growing environment and is suited to identify the specific adaptability of each genotype (Resende, 2007). In the present study, the LGCromo, Marfim, ORS 1403, ORS 1401, and Estrela Atria genotypes showed greater adaptability.
The HMRPGV is based on the genetic values predicted with the Blup method. It brings together the stability and adaptability estimates, providing the ranking of the best genotypes (Borges et al., 2010). This method indicated the superiority of the LGCromo, Marfim, ORS 1403, ORS 1401, and LGOro genotypes, which were widely adapted and stable (Table 5).
Genotype ranking was similar with the methods HMVG, RPGV, and HMRPGV. In all three of them, LGCromo, Marfim, LGOro, BRS Marcante, ORS 1401, Estrela Atria, and ORS 1403 were the most stable genotypes for the PIV in the Cachoeira do Sul environment. The prediction of the PIV via Blup made it possible to infer, in general terms, as to the superiority of the LGCromo, Marfim, ORS 1403, Estrela Atria, ORS 1401, TBio Mestre, TBio Sossego, LGOro, ORS Vintecinco, and Celebra genotypes. The REML/ Blup method, however, does not group environments, providing results that must be interpreted directly as genetic values, already penalized or capitalized by adaptability and stability estimates (Verardi et al., 2009; Silva et al., 2011). Therefore, the combination of a phenotypic method (AMMI) and a genotypic method (RELM/Blup) can provide reliable estimates for PIV adaptability and stability parameters.
Conclusions
1. The phenotypic index of vigor (PIV) makes it possible to define macroenvironments for the production of wheat (Triticum aestivum) seeds with high physiological potential and to understand the implications of the genotype x environment interaction.
2. The PIV is effective to rank genotypes considering multi-trait selection related to the vigor of wheat seeds produced in Southern Brazil.
References
BORGES, V.; SOARES, A.A.; REIS, M.S.; RESENDE, M.D.V.; CORNÉLIO, V.M.O.; LEITE, N.A.; VIEIRA, A.R. Desempenho genotípico de linhagens de arroz de terras altas utilizando metodologia de modelos mistos. Bragantia, v.69, p.833-841, 2010. DOI: 10.1590/S0006-87052010000400008.
BRASIL. Ministério da Agricultura, Pecuária e Abastecimento.
Regras para análise de sementes. Brasília, 2009. 395p.
CARVALHO, I.R.; NARDINO, M.; DEMARI, G.H.; PELEGRIN, A.J. de; FERRARI, M.; SZARESKI, V.J.; OLIVEIRA, V.S. de; BARBOSA, M.H.; SOUZA, V.Q. de; OLIVEIRA, A.C. de; MAIA, L.C. da. Components of variance and inter-relation of important traits to maize (Zea mays) breeding. Australian Journal of Crop Science, v.11, p.982-988, 2017a. DOI: 10.21475/ ajcs.17.11.08.pne474.
CARVALHO, I.R.; PELEGRIN, A.J. de; SZARESKI, V.J.; FERRARI, M.; ROSA, T.C. da; MARTINS, T.S.; SANTOS, N.L. dos; NARDINO, M.; SOUZA, V.Q. de; OLIVEIRA, A.C. de; MAIA, L.C. da. Diallel and prediction (REML/BLUP) for yield components in intervarietal maize hybrids. Genetics and Molecular Research, v.16, p.1-12, 2017b. DOI: 10.4238/ gmr16039734.
CRUZ, C.D.; CARNEIRO, P.C.S.; REGAZZI, A.J. Modelos biométricos aplicados ao melhoramento genético. 3.ed. Viçosa: UFV, 2014. v.2, 668p.
DUARTE, J.B.; VENCOVSKY, R. Interação genótipos x ambientes: uma introdução à análise “AMMI”. Ribeirão Preto: Sociedade Brasileira de Genética, 1999. 60p.
MARCOS FILHO, J. Teste de envelhecimento acelerado. In: VIEIRA, R.D.; CARVALHO, N. M. de (Ed.). Testes de vigor em sementes. Jaboticabal: FUNEP, 1994. p.133-154.
MARCOS-FILHO, J. Fisiologia de sementes de plantas cultivadas. 2.ed. Londrina: ABRATES, 2015. 660p.
NUNES, A.C.P. Qualidade da madeira, critérios de seleção e interação genótipos x ambientes de clones de Eucalyptus no Rio Grande do Sul. 2015. 121p. Dissertação (Magister Scientiae) – Universidade Federal de Viçosa, Viçosa.
OLIVEIRA, E.J. de.; SANTOS, V. da S.; LIMA, D.S. de.; MACHADO, M.D.; LUCENA, R.S.; MOTTA, T.B.N.; CASTELLEN, M. da S. Seleção em progênies de maracujazeiro-amarelo com base em índices multivariados. Pesquisa Agropecuária Brasileira, v.43, p.1543-1549, 2008. DOI: 10.1590/ S0100-204X2008001100013.
PESKE, S.T.; VILLELA, F.M.; MENEGHELLO, G.E. (Ed.).
Sementes: fundamentos científicos e tecnológicos. 3.ed. Pelotas: UFPel, 2012. 573p.
PUPIN, S.; SANTOS, A.V. de A. dos; ZARUMA, D.U.G.; MIRANDA, A.C.; SILVA, P.H.M. da; MARINO, C.L.; SEBBENN, A.M.; MORAES, M.L.T. de. Produtividade, estabilidade e adaptabilidade em progênies de polinização aberta
de Eucalyptus urophylla S.T. Blake. Scientia Forestalis, v.43,
p.127-134, 2015.
RAMALHO, M.A.P.; FERREIRA, D.F.; OLIVEIRA, A.C.
Experimentação em genética e melhoramento de plantas. Lavras: UFLA, 2000. 326p.
RESENDE, M.D.V. de. SELEGEN-REML/BLUP: sistema estatístico e seleção genética computadorizada via modelos lineares mistos. Colombo: Embrapa Florestas, 2007. 359p. RESENDE, M.D.V. de.; FURLANI-JÚNIOR, E.; MORAES, M.L.T. de.; FAZUOLI, L.C. Estimativas de parâmetros genéticos e predição de valores genotípicos no melhoramento do cafeeiro pelo procedimento REML/BLUP. Bragantia, v.60, p.185-193, 2001. DOI: 10.1590/S0006-87052001000300005.
RESENDE, M.D.V. de.; SILVA, F.F. e.; AZEVEDO, C.F.
Estatística matemática, biométrica e computacional: modelos mistos, multivariados, categóricos e generalizados (REML/BLUP), inferência bayesiana, regressão aleatória, seleção genômica, QTL-GWAS, estatística espacial e temporal, competição, sobrevivência. Viçosa: Ed. da UFV, 2014. 881p. RESENDE, M.D.V. de; DUARTE, J.B. Precisão e controle de qualidade em experimentos de avaliação de cultivares. Pesquisa Agropecuária Tropical, v.37, p.182-194, 2007.
ROSADO, A.M.; ROSADO, T.B.; ALVES, A.A.; LAVIOLA, B.G.; BHERING, L.L. Seleção simultânea de clones de eucalipto de acordo com produtividade, estabilidade e adaptabilidade. Pesquisa Agropecuária Brasileira, v.47, p.964-971, 2012. DOI: 10.1590/S0100-204X2012000700013.
SANTOS, G.A.; NUNES, A.C.P.; RESENDE, M.D.V.; SILVA, L.D.; HIGA, A.; ASSIS, T.F. Genetic control and genotype-by-environment interaction of wood weight in Eucalyptus clones
in the state of Rio Grande do Sul, Brazil. Revista Árvore, v.40, p.867-876, 2016. DOI: 10.1590/0100-67622016000500010. SANTOS, H.G. dos.; JACOMINE, P.K.T.; ANJOS, L.H.C. dos.; OLIVEIRA, V.A. de.; LUMBRERAS, J.F.; COELHO, M.R.; ALMEIDA, J.A. de.; CUNHA, T.J.F.; OLIVEIRA, J.B. de.
Sistema brasileiro de classificação de solos. 3.ed. Brasília: Embrapa, 2013. 353p.
SILVA, R.R.; BENIN, G.; SILVA, G.O. da.; MARCHIORO, V.S.; ALMEIDA, J.L. de.; MATEI, G. Adaptabilidade e estabilidade de cultivares de trigo em diferentes épocas de semeadura, no Paraná.
Pesquisa Agropecuária Brasileira, v.46, p.1439-1447, 2011. DOI: 10.1590/S0100-204X2011001100004.
STRECK, E.V.; KÄMPF, N.; DALMOLIN, R.S.D.; KLAMT, E.; NASCIMENTO, P.C. do; SCHNEIDER, P.; GIASSON, E.; PINTO, L.F.S. Solos do Rio Grande do Sul. 2.ed. rev. e ampl. Porto Alegre: UFRGS: Emater/RS-Ascar, 2008. 222p.
SZARESKI, V.J.; CARVALHO, I.R.; KEHL, K.; LEVIEN, A.M.; NARDINO, M.; DEMARI, G.H.; LAUTENCHLEGER, F.; SOUZA, V.Q. de; PEDÓ, T.; AUMONDE, T.Z. Univariate, multivariate techniques and mixed models applied to the adaptability and stability of wheat in the Rio Grande do Sul State.
Genetics and Molecular Research, v.16, p.1-13, 2017. DOI: 10.4238/gmr16039735.
VENCOVSKY, R.; BARRIGA, P. Genética biométrica no fitomelhoramento. Ribeirão Preto: Sociedade Brasileira de Genética, 1992. 496p.
VERARDI, C.K.; RESENDE, M.D.V. de; COSTA, R.B. da; GONÇALVES, P. de S. Adaptabilidade e estabilidade da produção de borracha e seleção em progênies de seringueira. Pesquisa Agropecuária Brasileira, v.44, p.1277-1282, 2009. DOI: 10.1590/ S0100-204X2009001000010.
VIEIRA, R.D.; KRZYZANOWSKI, F.C. Teste de condutividade elétrica. In: KRZYZANOWSKI, F.C.; VIEIRA, R.D.; FRANÇA-NETO, J.B.F. (Ed.). Vigor de sementes: conceitos e testes. Londrina: ABRATES, 1999. p.1-26.
ZOBEL, R.W.; WRIGHT, M.J.; GAUCH JR., H.G. Statistical analysis of a yield trial. Agronomy Journal, v.80, p.388-393, 1988. DOI: 10.2134/agronj1988.00021962008000030002x.