ISSN: 1809-4430 (on-line)
_________________________
1 UFMT/Sinop – MT, Brasil. 2 UNESP/Botucatu – SP, Brasil.
*Corresponding author. E-mail: [email protected]
PROTOTYPE FOR SOIL MECHANICAL RESISTANCE MEASUREMENT WITH CHISEL PLOW AUTOMATED CONTROL
Doi:http://dx.doi.org/10.1590/1809-4430-Eng.Agric.v36n4p 646-655/2016
THIAGO M. MACHADO1*, KLÉBER P. LANÇAS2
ABSTRACT: In Brazil, there are several available models and systems to measure soil compaction; however, the data generated by such equipment have to be processed and interpreted, making the process expensive. Our study aimed to evaluate a prototype of instrumented rods to identify soil compacted layers and control chiseling depth, and compared it to a conventional system at a fixed depth of 0.35 m. In order to compare them, we assessed the following parameters: hourly fuel consumption, operational fuel consumption, drawbar power, average power, average speed, slipping, tractor effective field capacity and response time. Our results showed that mechanical chiseling at variable depths reduced in 26% the operational fuel consumption and increased in 14% the effective field capacity. Furthermore, the prototype of chisel plow automated control generated maps displaying spatial variability of soil mechanical resistance with resolution, sampling density and high operating capacity.
KEY WORDS: precision agriculture, soil compaction, chiseling.
INTRODUCTION
Soil compaction problem affects most of Brazilian agricultural areas. Several factors may affect soil aggregation such as use of excessive loads and machine traffic, unsuitable tires for the applied amount of load and inflation pressures higher than the recommended, machine traffic on soil at inappropriate water contents and other problems MACHADO & LANÇAS (2014).
Researches on compaction interference in agricultural productivity are numerous, regarding soil physical properties and root distribution and growth (CAVALLINI et al, 2010; SECCO et al, 2009; Silva et al, 2009; REICHERT et al, 2009; GUBIANI et al, 2013). Soil compaction can also influence agricultural machinery and implement performances, promoting an expansion in potency demand for traction (DRESCHER et al, 2011; MENTGES et al., 2010).
To diagnose compaction, penetrometers or penetrographs are used, however, requiring considerable time to obtain data as reported by ADAMCHUK & MOLIN (2006).
Certain research areas have been seeking for alternatives to improve soil potential use and consequently increasing crop yields. For instance, crop and soil mapping to aid in applying inputs at variable rates, and sectorial management using precision agriculture tools (MACHADO, 2013).
One of the basic precision agriculture practices is to define soil property spatial variability within a farming area to make decisions that can maximize crop profitability and reduce negative environmental impacts, according to DHILLON et al. (2010).
The objective of our research was to evaluate a prototype of instrumented rods able to detect soil resistance to penetration at three different layers, at real-time, sending command to the rippers to decompress soil whether necessary, as well as collecting data for mapping of soil layers with management purposes.
MATERIAL AND METHODS
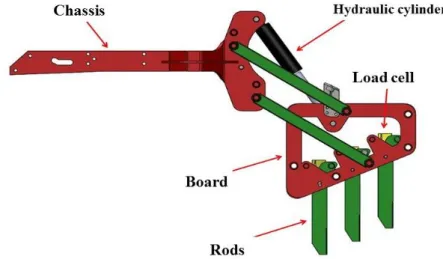
The development of prototype instrumented rods for soil resistance reading and ripper control (Figure 1) was carried out in partnership with Stara Company, the construction details were described according to MACHADO & LANÇAS (2014).
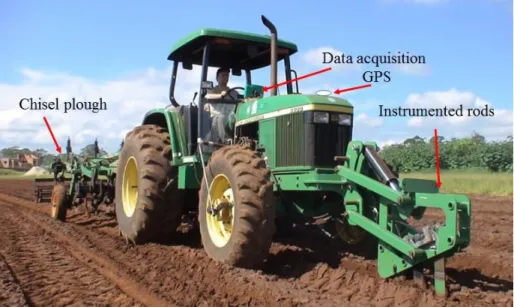
The prototype was comprised of rods with load cell, data acquisition system with a programmable logic controller (PLC), global positioning system (GPS) and chisel hydraulic control system (oil flow controller) (Figure 2). According to TAYLOR (1966), while performing soil shear measurements, values above two MPa were taken as deterrent to root growth. The oil-flow control system was automatically activated to lower or raise the ripper tool depending on impediment layer depth. The front hydraulic actuation (linear actuator) (Figure 1) was carried out manually by means of a tractor control lever, in which it was possible to control rod working depth. We used a ripper tool of Stara brand, Fox model, with five rods spaced in 0.3 m consisting of two 1.4-m leveling rolls and straw cutting discs, comprising a total weight of 2500 kg and equipped with depth control wheels, hydraulically driven. The variable depth control system was comprised of a height position sensor from the brand Elobau®, model 424A1712001. We used for this purpose a Stara data collector (PLC) of Topper model that has storing and commanding functions to the oil flow controller (Hydac®, HBF model) with the function of raising and lowering the ripper tool, which was set to penetrate 5 cm deeper than the compacted layer.
FIGURE 2. Prototype control system for chisel depth, consisting of a soil shear strength reading system, GPS, PLC and chisel plow.
The electronic system was composed of a Novatel GPS, 701GG model, operating in a 5 Hz frequency and L1-CA band with an EDIF correction plus a Stara data collector, Topper model (Figure 2).
GPS data, in NMEA (GGA) format files, were incorporated into the soil pressure data by the rods, being measured by the load cells (MPa). Stored data consisted of altitude, longitude, latitude, rod depth and pressure in the soil. Files in SHP, DBF and SHX format were generated and downloaded to a flashdrive. We solely collected data in areas where pressure surpassed 2 MPa.
This automated system was assembled on a John Deere 6600 tractor (4x2 FWD), as shown in Figure 2. The tractor has a 6-cylinder engine with a maximum power output of 89 kW. Metal ballasts of 3924 and 3825 N were provided on the front and rear axles, and 75% of liquid ballast on both tires. The diagonal tires are classified as 18.4-26 (front) and 23.1-30 (rear), with 26 and 24 psi inflation pressure. The tractor load distribution was 40% on the front and 60% on the rear, reaching
a total weight of 64,696 N. The ratio between weight and power was of 55 kg cv-1, and hydraulic
system flow of 66 L min-1 at 2400 rpm.
The experiment was conducted at an Experimental Farm of the São Paulo State University "Julio de Mesquita Filho", Faculty of Agricultural Sciences, in Botucatu city, state of São Paulo, Brazil. The geographical location of the center area is 22º 50' 18" south latitude, 48º 25' 22" west longitude and an altitude of 791 m. The experimental soil was classified according to the Brazilian System of Soil Classification (EMBRAPA, 2013) as dystroferric Red Nitisol (an Ultisol according to the U. S. Soil Taxonomy).
Equipment calibration followed recommendations of MACHADO & LANÇAS (2014). Next, we tested the system in the field, checking the performance of 4 treatments arranged in a completely randomized block design with three replications, in totaling 12 plots. Each plot was set on a leveled
ground covering an area of 400 m2 (5 x 80 m). We carried out the experiment using an A1 gear with
a motor rotation of 1500 rpm, providing a work speed of 1.62 km h-1, which is recommended for
FD – Fixed depth 0.35 m 1.62 H - Tractor with instrumented rod immersed at work position and chisel
plow in transport position - 1.62
HS - Tractor without immersion of the instrumented rods at work
position and chisel plow in transport position - 1.62
The area was previously subsoiled at 0.40 m depth by a Jumbo Matic subsoiler (Jan brand) and a New Holland 7040 tractor at 132 kW rated power. It was used a ballast weighing 88290 N, being 60% applied on rear axle and 40% on front one. Diagonal tires were classified as 18.4-26 (front tires) and 24.5-32 (rear tires) with 24 psi inflation pressure in both of them. Then we used a Silver 1000 compactor roller coupled at 3 parts of 9810N for area homogenization and compression induction. After the compactor roller passing, penetration resistance measurements were made with a manual electronic penetrometer (Falker PenetroLOG - PLG1020) at a maximum depth of 0.60 m, being controlled by sonar-type sensor, avoiding trespass standard speed. The measurement can be aborted. The penetrometer rod has a cone-shaped tip, which is compliant with the B standard of ASABE (2009), with a 30° angle 12.83 mm diameter. Ten random points were sampled by portion; they were georeferenced by a GPS system (Garmin, GPSmap 62s) with 0.5 Hz frequency. Data were downloaded on laptop and viewed through the penetroLOG software. Then the data were interpolated by Kriging method through Stoolbox at the depths of 0.10, 0.20 and 0.30 m. The data collected by the instrumented rods were stored in a data logger to which was inserted a flashdrive for downloading in DBF format. It was singly recorded coordinates of points where penetration resistance was not higher than 2 MPa.
To evaluate ripper response time, we used a completely randomized design with three replications. For that, we induced compression onto 5x10-m plots using a tractor, as described above. Tractor passed on these plots for 2, 4 and 6 times, performing three treatments. Between each treatment, a land strip was left without receiving traffic of tractors as a stabilization area, which was also subsoiled to 0.40 m.
While travelling with the previously calibrated instrumented rods using tractor gear A1 at 1500 rpm, system response time was measured using a stopwatch and measuring the time spent on chisel plow rising and lowering mechanism.
RESULTS AND DISCUSSION
During instrumented rod calibration, system functionality was verified. Preliminary, results showed good linear correlation considering the averages at all depths between penetrometer and instrumented rods, obtaining a correlation coefficient of 0.90 by calibration, according to the methodology proposed by MACHADO & LANÇAS (2014).
TABLE 2. Water content in the soil (kg kg-1).
Depth (m) Treatments Average (kg kg-1)
VD FD H HS
0.00 – 0.10 14.21 17.52 16.35 16.52 16.15 B
0.10 – 0.20 21.79 23.63 20.63 21.32 21.84 AB
0.20 – 0.30 22.55 25.28 23.65 22.55 23.50 A
Average 19.60 ab 19.90 ab 19.63 ab 20.50 a
Means followed by the same letter in the column do not differ at each other, at 5% probability by Tukey test.
TABLE 3.Granulometric analysis of the field soil.
Depth (m) Silt Sand Clay
g kg -1
0.00-0.10 190 a 140 a 670 a
0.10-0.20 208 ab 160 a 632 ab
0.20-0.30 191 a 139 ab 669 a
Means followed by the same letter in the column do not differ at each other, at 5% probability by Tukey test.
After prototype calibration, we assessed energy outputs and system response time. The mean speed and operational capacity were respectively 13% and 14% higher when comparing VD with FD. Consequently, tire slipping was reduced in 59.01% and operational fuel consumption in 26%, with significant differences (Table 4).
By reducing slippage, there was an increase in effective field capacity since there has been a lower energy release, reducing the number of tractor wheel spin in a same location, what helped to increase speed and decrease fuel consumption.
Another favorable factor when working with varied depths is reduction of power demand, which in a traditional system of fixed depth is increasingly consumed as equipment reaches an unnecessary depth. According to MACHADO et al. (2015), it happens due to shortage of information and available time by employees to develop a detailed analysis of the activity. The same authors reported that the using variable depths the larger the area worked, the greater the fuel-consumption reductions and operational time spent.
Our results (Table 4) are close to those obtained by GORUCU et al. (2001), who registered a fuel consumption economy of 28.4% when subsoiling at depths between 0.25 to 0.45 m compared to a fixed system at 0.45 m.
TABLE 4. The analyzed variables according to each treatment: Slipping (S), in %; mean speed
(MS), in km h-1; effective field capacity (EFC), in ha h-1; average force on the drawbar
(AFD), in N; average power on the drawbar (APD) in kW; hourly fuel consumptio n
(HFC), in L h-1; and fuel operational consumption (FOC) in L ha-1.
Treatments S
(%)
MS (km h-1)
EFC (ha h-1)
AFD (N)
APD (kW)
HFC (L h-1)
FOC (L ha-1)
VD 2.66 b 1.50 a 0.32 ab 4137 b 1.75 b 5.18 b 16.04 b
FD 6.49 a 1.32 b 0.28 b 21660 a 8.25 a 6.26 a 21.70 a
H 2.13 b 1.50 a 0.32 ab 3116 b 1.33 b 4.85 bc 14.98 b
HS 1.69 b 1.57 a 0.33 a 2420 b 1.05 b 4.48 c 13.55 b
of 20% in fuel consumption and 120% in strength by increasing work depth from 0.23 m to 0.35 m. Estimating energy expenditure of a subsoiler at varying depths, MACHADO et al. (2015) concluded that the deeper the hardening layer, the higher the energy expenditure ratio.
Analyzing the results of Table 4, we found that H and HS had no significant difference for
any of the analyzed variables. Therefore, there is no statistical difference between the instrumented
rod system and the one without rods with chisel plow in transport position, demonstrating that the use of instrumented rods had a good result regarding its performance, requiring low energy expenditure. One of the advantages of working at varying depths would be reduction of soil mobility and, consequently, less erosion according to a few authors (MACHADO et al, 2015; GORUCU et al, 2001).
Data gathered by the acquisition system enabled storing values above 2 MPa of soil mechanical resistance. The map in Figure 3 shows the location where the prototype went into operation, generating points, this Figure also demonstrate the CI map generated by penetrometer data for all treatments.
From Figure 3 to 5 are shown maps related to IC at the depth ranges of 0 to 0.10 m, 0.10 to 0.20 m and 0.20 to 0.30 m. It is noted that values greater than 2 MPa, in Figures 3 and 4, were found in areas where the instrumented rods mapped compression zones. Data from mapped locations, which are above compaction limits, remain stored generating a data history that can be used to assess compaction dynamics for each equipment. These data may be used to delineate management zones and whether associated to other variables such as electrical conductivity, crop yield, organic matter content, soil pH and others, consists of an alternative working method in modern agriculture.
FIGURE 3. Map of treatments being the cone index (CI) with data provided by penetrometer at a
FIGURE 4. Cone index map with data provided by penetrometer at a depth ranging from 0.10 to 0.20 m, and points generated by instrumented rods only at locations with resistance values greater than 2 MPa.
In Figure 5, the automated system did not identify layers with values of resistance to penetration higher than 2 MPa, thus tractor path was not delineated. The same way, data collected
by penetrometer also did not registered layers with values greater than 2MPa.
FIGURE 5. Cone index at a depth ranging from 0.20 to 0.30 m.
SB (subsoiled area) 1.22 1.54 1.74
2P – (2 passing) 2.24 1.75 1.88
4P – (4 passing) 2.44 2.32 1.95
6P – (6 passing) 2.62 2.23 2.45
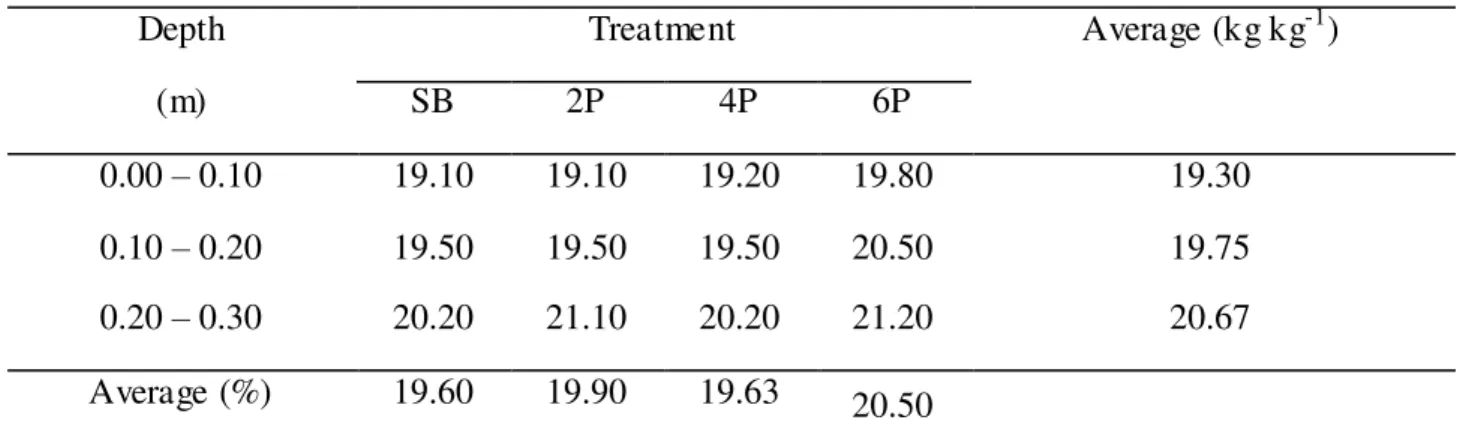
TABLE 6. Soil water content (kg kg-1).
Depth Treatment Average (kg kg-1)
(m) SB 2P 4P 6P
0.00 – 0.10 19.10 19.10 19.20 19.80 19.30
0.10 – 0.20 19.50 19.50 19.50 20.50 19.75
0.20 – 0.30 20.20 21.10 20.20 21.20 20.67
Average (%) 19.60 19.90 19.63 20.50
During the evaluations of system response times, we observed that ripper-lowering at depths of 0.15 and 0.25 m were most rapid, being respectively 33% and 12.5% faster than lifting ones, as shown in Tables 7 and 8.
TABLE 7.Time spent during chisel plow lifting.
Time spent to move up until transport position (s)
Depth 0.15 m Depth 0.25 m Depth 0.35 m
3 5 8
TABLE 8.Time spent during chisel plow lowering.
Time spent to move down until transport position (s)
Depth 0.15 m Depth 0.25 m Depth 0.35 m
2 5 7
CONCLUSIONS
The prototype and the other automated systems were functional and allowed soil mechanical resistance measurement, storing the data and generating pathway maps over areas with compression levels above 2 MPa.
REFERENCES
ADAMCHUK, V. I.; HEMMAT, A.; MOUAZEN, A. M. Soil compaction sensor systems-current
developments. St. Joseph: ASABE, 2008. 10 p.
ASABE - AMERICAN SOCIETY OF AGRICULTURAL AND BIOLOGICAL ENGINNERS. ASABE EP542: Procedured for using and repoting data obtainer with the soil cone penetrometer. St. Joseph, 2009. 3 p.
ADAMCHUK, V. I.; MOLIN, J. P. Hastes instrumentadas para mensuração da resistência mecânica
do solo. Engenharia Agrícola, Jaboticabal, v. 26, n.1, p.161-169, 2006. Disponível em: <http:
www.sbea.org.br>. Acesso em: 4 jan. 2014.
CAVALLINI, M .C.; ANDREOTTI, M.; OLIVEIRA, L. L.; PARIZ, C. M.; CARVALHO, M. P. Relações entre produtividade de Brachiaria brizantha e atributos físicos de um Latossolo do
cerrado. Revista Brasileira de Ciência do Solo, Viçosa, MG, v. 34, n.1, p.1007-1015, 2010.
DHILLON, R. S.; ADAMCHUK, V. I.; HOLLAND, K. H.; HEMPLEMAN, C. H. Development of
anintegrated on-the-go sensing system for soil properties. St Joseph: ASABE, 2010. 7 p. DRESCHER, M. S.; ELTZ, F. L. F.; DENARDIN, J. E.; FAGANELLO, A. Persistência do efeito
de intervenções mecânicas para a descompactação de solos sob plantio direto. Revista Brasileira
de Ciência do Solo, Viçosa, MG, v.35, p.713-1722, 2011.
EMBRAPA - EMPRESA BRASILEIRA DE PESQUISA AGROPECUARIA. Centro Nacional de
Pesquisa de Solos. Sistema brasileiro de classificação de solos. Rio de Janeiro: CNPS, 2013. 353
p.
GORUCU, S.; KHALILIAN, A.; HAN, Y. J.; DODD, R. B.; WOLAK, F. J.; KESKIN, M. Variable depth tillage based on geo-referenced soil compaction data in coastal plain region of South
Carolina. ASAE, St. Joseph, v.1, p. 1-11, 2001.
GUBIANI, P.I.; REICHERT, J.M.; REINERT, D.J. Indicadores hídrico-mecânicos de compactação
do solo e crescimento de plantas. Revista Brasileira de Ciência do Solo, Viçosa, MG, v.37, p.
1-10, 2013.
KICHLER, C. M.; FULTON, P. R. J.; RAPER, L.; ZECH, W. C.; MCDONALD, T. P.;
BRODBECK, C. J. Spatially monitoring tractor performance to evaluate energy requirements of variable depth tillage and implement selection. In: ASABE ANNUAL INTERNATIONAL
MEETING, Minneapolis, 2007. Proceedings... St. Joseph: ASABE, 2007. (Paper Number:
071028).
MACHADO, T. M.; LANÇAS, K. P. Calibração das hastes instrumentadas do protótipo medidor de
resistência ao rompimento do solo. Energia na Agricultura, Botucatu, v. 29, p.14-21, 2014.
Disponível em: <http://energia.fca.unesp.br/index.php/energia/article/view/982>. Acesso em: 4 julho. 2014.
MACHADO, T. M.; LANÇAS, K. P.; FIORESE, D. A.; FERNANDES, B. B.; TESTA, J. V. P.
Estimativa de gasto energético da operação de subsolagem em profundidades variáveis. Revista
Brasileira Engenharia Agrícola e Ambiental, Campina Grande, v.19, n.11, p.1121–1125, 2015. Disponível em: <http://www.scielo.br/pdf/rbeaa/v19n11/1415-4366-rbeaa-19-11-1121.pdf>. doi: http://dx.doi.org/10.1590/1807-1929/agriambi.v19n11p1121-1125
MACHADO, T. M. Hastes instrumentadas com controle automatizado do escarificador
atuando em profundidades variáveis. 2013. 96 f. Tese (Doutorado em Agronomia) – Faculdade de Ciências Agronômicas, Universidade Estadual Paulista, Botucatu, 2013.
MENTGES, M. I.; REICHERT, J. M.; ROSA, D. P.; VIEIRA, D. A.; ROSA, V. T.; REINERT, D. J. Propriedades físico-hidricas do solo e demanda energética de haste escarificadora em Argissolo
de grãos de trigo, soja e milho em dois Latossolos compactados e escarificados. Ciência Rural, Santa Maria, v. 39, p. 58-64, 2009.
SILVA, V. R. da; REICHERT, J. M.; REINERT, D. J.; BORTOLUZZI, E. C. Soil water dynamics
related to the degree of compaction of two Brazilian oxisols under no tillage. Revista Brasileira de
Ciência do Solo, Viçosa, MG, v. 33, p. 1097-1104, 2009.
TAYLOR, H.M., ROBERSON, G.M.; PARKER, Jr. J.J. Soil Strength-root penetration relations for