Lorenna Alves Mattos , Edson Perito Amorim , Vanusia Batista de Oliveira Amorim , Kelly de Oliveira Cohen , Carlos Alberto da Silva Ledo(2) e Sebastião de Oliveira e Silva(2)
(1)Universidade Estadual de Feira de Santana, Avenida Transnordestina, Cep 44036–900 Feira de Santana, BA, Brazil. E‑mail: lorennamattos@yahoo.com.br. (2)Embrapa Mandioca e Fruticultura Tropical, Rua Embrapa, s/no, Cep 44380‑000 Cruz das Almas, BA, Brazil. E‑mail: edson@cnpmf.embrapa.br, vanusia@cnpmf.embrapa.br, ledo@cnpmf.embrapa.br, ssilva@cnpmf.embrapa.br (3)Embrapa Cerrados, BR 020, Km 18, Cep 73310‑970 Planaltina, DF, Brazil. E‑mail: kelly.cohen@cpac.embrapa.br
Abstract – The objective of the present work was to characterize banana accessions from the Germplasm Bank at Embrapa Mandioca e Fruticultura Tropical (Brazil), using agronomical, physical and physicochemical characteristics of fruit and simple sequence repeats (SSR) markers. Twenty-six accessions were analyzed, in which high genetic variability was found, especially for the agronomical characters number of fruit and weight of bunch. Accessions with high contents of carotenoids (diploid 'Jaran'), polyphenols (triploid 'Caipira' and tetraploid 'Teparod') and vitamin C (diploid 'Tuugia' and an unknown triploid AAA) in the fruit were identified. Thirteen microsatellite primers revealed an average of 7.23 alleles, which showed high variability. A dendrogram was prepared using the Gower algorithm for the distance matrices obtained from the agronomical, physical and physicolchemical analysis of fruit and SSR markers. Adopting the average genetic divergence as the cut-off point, three clusters were found: G1, formed by the diploids 'Jaran', 028003-01 and M-48; G2, by the diploids 'Malbut' and 'Ido 110'; and G3, by 21 tri-and tetraploid accessions, including one diploid, 'Tuugia'. The triploids with the B genome 'Thap Maeo', 'Walha', 'Pacha Nadan' and 'Champa Madras' were grouped in G2. Results from this work can be used for breeding hybrids with good agronomical traits and fruit quality.
Index terms: Musa, functional properties, fruit quality, hybrids, yield.
Caracterização agronômica e molecular de germoplasma de bananeira
Resumo – O objetivo deste trabalho foi caracterizar acessos de bananeira do Banco de Germoplasma da Embrapa Mandioca e Fruticultura Tropical, por meio de características agronômicas, físicas e físico-químicas dos frutos e por marcadores “Simple sequence repeats” (SSR). Foram analisados 26 acessos, nos quais observou-se ampla variabilidade genética, em especial para número de frutos e peso de cacho. Foram identificados acessos com altos teores de carotenoides (diploide 'Jaran'), polifenóis (tetraploide 'Teparod') e vitamina C (diploide 'Tuugia' e um triploide AAA desconhecido). Os 13 iniciadores microssatélites testados apresentaram uma média de 7,23 alelos, que apresentaram alta variabilidade. Com uso do algoritmo de Gower, foi elaborado um dendrograma com as matrizes de distância obtidas por meio das análises agronômicas, físicas e físico-químicas dos frutos e análises moleculares. Com a divergência genética média usada como ponto de corte, foram identificados três agrupamentos: G1, formado pelos diploides 'Jaran', 028003-01 e M-48; G2, pelos diploides 'Malbut' e 'Ido 110'; e G3, pelos 21 acessos tri- e tetraploides, incluindo-se um diploide 'Tuugia'. Os triploides com genoma B 'Thap Maeo', 'Walha', 'Pacha Nadan' e 'Champa Madras' agruparam-se no G2. Os resultados obtidos podem ser utilizados no melhoramento genético, para o desenvolvimento de híbridos com boas características agronômicas e qualidade de frutos.
Termos para indexação: Musa, propriedades funcionais, qualidade de frutos, híbridos, produtividade.
Introduction
Banana production is usually based on tri- and tetraploid cultivars; however, diploid genotypes are important sources of alleles for resistance or tolerance to biotic and abiotic factors. Banana breeding programs have generated promising tetraploid hybrids from
crosses between triploids and improved wild diploids with important agronomic traits, including reduced height, disease and pest resistance and fruit quality (Silva et al., 2002).
is important for the selection of progenitors, in order to explore heterosis and develop better cultivars.
Many molecular markers, especially those associated with PCR (polymerase chain reaction) based methods, including RFLP (restriction fragment
lenght polymorphism), RAPD (random amplified
polymorphic DNA) and microsatellites or SSR (simple sequence repeats), have been broadly used to estimate genetic variability and phylogenetic studies in banana (Creste et al., 2004; Amorim et al., 2008; Amorim et al., 2009a, 2009b). Of these, microsatellite technique has shown higher potential use in banana because it permits the detection of greater polymorphism and of co-dominant inheritance, and offers high reproducibility and easy interpretation.
The objective of the present work was to characterize banana accessions from the Germplasm Bank at Embrapa Mandioca e Fruticultura Tropical using agronomical, physical and physicochemical characters of fruit and simple sequence repeats (SSR) markers.
Materials and Methods
Twenty-six accessions, from the Banana Germplasm Bank (BGB) at Embrapa Mandioca e Fruticultura Tropical, originated by tissue culture, including improved and wild diploids, triploids and tetraploids, were used (Table 2). Five plants per accession were evaluated in a complete randomized block design with a 3x2 m spacing. The plants were irrigated by aspersion, and the management was carried out according to technical recommendations for all genotypes (Alves &
Oliveira, 1999). The soil was classified as a Latossolo Amarelo distrófico (Xanthic Haplustox). The climate type in Cruz das Almas is AW (Köppen classification),
with an annual mean temperature of 24.5°C and rainfall of about 1,500 mm.
Based on Silva et al. (2002), the agronomical traits
evaluated were: plant height (PH, m); pseudostem diameter (PD, cm); number of suckers during flowering
(NS); number of leaves during harvest (NL); stalk length (SL, cm); stalk diameter (SD, mm); stalk weight
(SW, kg); number of hands per bunch (NH); number of
fruits (NF); and weight of bunch (WB, kg).
Yellow‑Sigatoka was assayed under field conditions. Data was taken during the flowering period, following
the methodology proposed by Stover (1972), according to the following grade scale: 0, without symptoms; 1,
1 to 10% of leaf blade with symptoms; 2, from 11 to 30% of leaf blade with symptoms; 3, from 31 to 50% of leaf blade with symptoms; 4, from 51 to 70% of leaf blade with symptoms; 5, more than 70% of leaf blade with symptoms.
The physical characters of fruit evaluated were: length; diameter; fruit weight; pulp weight; peel
thickness; pulp diameter and pulp firmness. All
analyses were done in triplicate.
Pulp samples from three fruits of each genotype, made up of a central piece and both extremities, were taken out for the physicochemical analyses. Pieces were shredded in a blender, adding water in a 1:2 ratio (pulp:water). The following variables were measured:
soluble solids content (SS, ºBrix); pH and titratable acidity (TA), according to the Association of Official
Analytical Chemists (1997); vitamin C (VIT, mg 100g-1),
according to Terada et al. (1979); total carotenoids (CTN, µg g-1), according to Rodriguez-Amaya (1999);
and total flavonoids (FLA, mg 100 g-1), as described
by Rijke et al. (2006). Polyphenol extraction (PLF, mg 100 g-1) was done using a solution of 50% methanol and
70% acetone and quantification was performed with a
spectrophotometer using the Folin-Ciocauteau reagent, according to the methodology proposed by Obanda & Owuor (1997). All analyses were done in triplicate.
For the molecular characterization, carried out at the Laboratorio de Virologia e Biologia Molecular of Embrapa Mandioca e Fruticultura Tropical, 13 microsatellite primer pairs were used: three belonging to the Ma series developed by Crouch et al. (1998), four from the AGMI series (Lagoda
et al., 1998), five from the MaOCEN series (Creste
et al., 2004), and a Mb 1-100 primer described by Oriero et al. (2006) (Table 1). Genomic DNA was extracted from young leaves using the CTAB method (Doyle & Doyle 1990).
Microsatellite amplifying reactions were completed
in a final volume of 13 μL containing: KCl 50 mmol L-1,
Tris‑HCl 10 mmol L-1 (pH 8.3), MgCl
2 2.5 mmol L-1,
100 μmol L-1 of each dNTPs (dATP, dTTP, dGTP,
dCTP), 0.2 μmol L-1 of each primer, 50 ng of genomic
DNA, and one unit of Taq DNA polymerase (Pharmacia Biotech, Carnaxide, Portugal).
Amplifications were carried out in the 9700 Perkin
s at 55ºC, reducing one degree at each cycle, 1 min at 72ºC, totalizing 10 cycles, followed by 25 cycles of 40 s at 94ºC, 40 s at 45ºC and 60 s at 72ºC. Bands were separated in ultrapure 1000 agarose gel (Invitrogen Carlsbad, USA) at 3%, under standard conditions, and
the amplification products were stained with ethidium
bromide for allele visualization.
Fruit data were analyzed for variance, and the averages grouped by the Scott-Knott (1974) test at 5% of probability. The dissimilarity averages were calculated using the average Euclidian distance. The component analyses were done using the Singh (1981) criteria. All analyses were carried out using the Genes software package (Cruz & Schuster, 2004).
For SSR analyses, the amplified fragments were
evaluated as absent (0) or present (1). Genetic similarity was calculated according to Nei & Li (1979).
A combined analysis using the matrices of the agronomical, physical and physicochemical data of fruit and the molecular (SSR) data was carried out using the Gower (1971) algorithm:
in which:Wijk is the distribution of the k-ith variable
for the total distance between individuals j and I; dijk corresponds to the weight given to the ijk-ith
comparison, with 1 for the valid comparisons and 0 for the invalid ones.
This index was obtained by combining the binary data from the molecular markers and the quantitative data from the morphological characters, giving an estimation of a single similarity index varying from 0 to 1.
The Gower distance matrix was used to cluster the 26 accessions by UPGMA (unweighted pair-group method averages), using the NTSYS-pc software (Rohlf, 2000).
Results and Discussion
The averages for all agronomical characters showed
significant differences, except for the number of suckers during harvest (NS) (Table 2). The coefficient
of variation varied from 9.12 (PD) to 57.08% (NF), similarly to those observed by Amorim et al. (2009a) for the same variables.
Plant height (PH) varied from 1.44 m for 'Walha'
to 3.54 m for 'Ambrosia', with an average of 2.79 m (Table 2). Four clusters were formed with 028003-01
and 'Walha', classified in the last group with the lowest
values by the Scott-Knott (1974) test.
There was great variability for plant height, which is a positive fact for breeding, since this make it possible to identify diploid progenitors for crosses aiming at the development of short hybrids.
The mean pseudostem diameter was 17.76 cm, with averages varying between 9.67cm for the diploid 'Idu-110' and 24.56 cm for the tetraploid 'Calipso' (Table 2). This trait is related to vigor and resistance to pseudostem breakage. Genotypes with thicker pseudostems are less susceptible to toppling over (Silva et al., 2002).
The highest value observed for live leaves during harvest was 9.20 for the Tropical and Maravilha cultivars, and the smallest for the Towoolle, with
2 leaves. Fruit filling is directly correlated with
number of live leaves during harvest. According to Soto Ballestero (1992), cultivars from the Cavendish subgroup generally need at least eight active leaves per plant for good fruit development.
The shortest mean stalk length was observed in 'Tuugia', with the highest value for 'Champa Madras'. There was a direct relationship between stalk diameter and stalk weight, which had the highest values in 'Ambrosia' and 'Calipso' (Table 2), and the smallest in 'Tuugia'.
The mean number of hands and fruit per bunch was 6 and 83, respectively (Table 2). The highest numbers of fruit were found in 'Thap Maeo', 'Ambrosia', 'Jaran' and 'Calipso'. These two traits are important in banana genetic studies, since the hand constitutes the market unit, and the increase in the number of hands can increase bunch weight, a trait that expresses genotype yield (Silva, 2002).
Five clusters were formed for resistance to yellow
Sigatoka during flowering. Most genotypes were
resistant, except 'Jaran' and 'Malbut' (Table 2). All the physical and chemical characters of fruit, except
titratable acidity, showed significant differences (Table 3). The variation coefficients varied from 0.86% for flavonols to 31.24% for fruit weight.
The mean fruit length was 13.31 cm, with averages varying from 6.78 cm for 'Jaran' to 18.7 for 'Calipso',
forming five groups. In general, tetraploids had higher
averages than triploids or diploids. Similar behavior was observed for the diameter and average weight
of fruit and for pulp weight and diameter, which
formed five, four, four and six groups, respectively.
The average peel thickness was 0.24 cm, varying from 0.13 for the diploid 'Idu-110' to 0.47 for the triploid 'Bakar'. Through the Scott-Knott (1974) test, three groups were formed (Table 3). The same
behavior occurred for pulp firmness (PF), with
averages varying from 0.67 Lb ('M-48') to 1.2 Lb ('Terapod').
The average for soluble solids was 19.48 ºBrix, varying from 14.60 ºBrix for 'Towoolle' to 25.70 ºBrix for 'Teparod'. Three groups were formed by the Scott-Knott clustering test. These results are in agreement with Soto Ballestero (1992).
The average of total carotenoid content, among the 26 accessions, was 3.19 µg g-1, varying from 0.98 µg
g-1 ('Tropical') to 8.23 µg g-1 ('Jaran') (Table 3). These
results agree with reported data by other authors (Englberger et al., 2003; Amorim et al., 2009b).
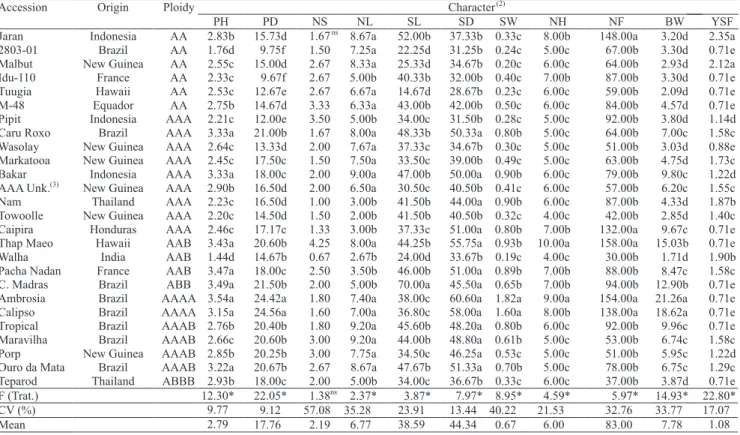
Table 2. Averages of the agronomical characters evaluated in 26 banana accessions from the Embrapa Mandioca e Fruticultura Tropical Germplasm Bank(1).
(1)Averages followed by the equal letters, in the columns, belong to the same group by the Scott-Knott (1974) test, at 5% probability. (2)PH, plant height (cm); PD, pseudostem diameter (cm); NS, number of suckers during flowering; NL, number of leaves during harvest; SL, stalk length (cm); SD, stalk diameter (mm);
SW, stalk weight (kg); NH, number of hands; NF, number of fruits; BW, bunch weight (kg); YSF, yellow Sigatoka during flowering. (3)Unknown triploid.
Total flavonoids had an average of 2.25 mg
100 g-1, varying from 0.85 mg 100 g-1, ('Maravilha')
to 6.64 mg 100 g-1 ('Teparod'), indicating broad
variation in these accessions (Table 3). Among the diploids, the average was 2.67 mg 100 g-1, and M-48
(4.68 mg 100 g-1) stood out. For the triploids, it varied
from 1.09 to 4.02 mg 100 g-1; and for the tetraploids,
the average was 1.95 mg 100g-1, with 'Teparod'
(6.64 mg 100 g-1) standing out, corroborating Lako
et al. (2007), who reported variation from 2 mg 100 g-1 to 10 mg 100 g-1 of flavonoids in different
Musa genotypes.
The average total polyphenol content was 45.31 mg 100 g-1,varying from 12.84 mg 100 g-1
for the Towolle triploid to 257.80 mg 100 g-1 for
'Teparod' (Table 3).
The highest vitamin C content was found in 'Teparod' and in the unknown AAA triploid. Results reported in the present work are in agreement with those of Amorim et al. (2007).
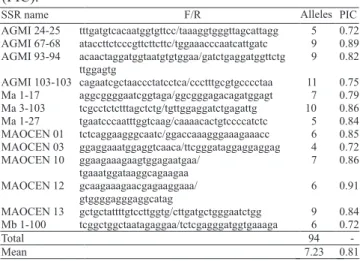
Regarding molecular analysis, 94 alleles were found, with an average of 7.23 alleles per primer. The
largest number of alleles was identified for primer
AGMI 103-103 (11), and the smallest for MAOCEN 01 (Table 1). The average number of alleles per SSR locus is similar to other reports for banana (Amorim et al., 2008; Amorim et al., 2009a).
The polymorphism information content (PIC) varied from 0.72, for AGMI 24-25, MAOCEN 03 and Mb 1-100 primers, to 0.91 for the MAOCEN 12 primer, with an average of 0.81. The correlation between the number of alleles and the PIC value was high (r = 0.76, p ≤ 0.005), indicating that the primers with larger number of alleles had greater discriminatory power.
Re-sampling indicated that 85 alleles were enough for a precise estimation of the genetic divergence between the accessions. Correlation between the matrix considering 80 alleles and the matrix with 94 alleles was 0.98, with deviated squares (SQd) of 0.27
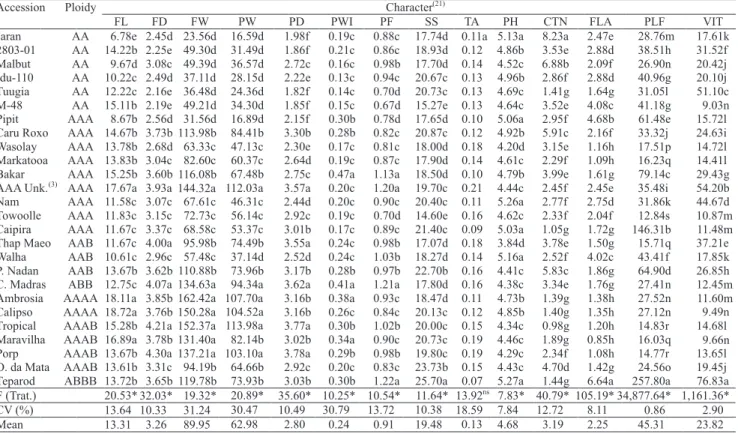
Table 3. Average of physical and physicachemicol fruit characters, evaluated for the 26 banana accessions from the Embrapa Mandioca e Fruticultura Tropical Germplasm Bank(1).
and stress value (E) of 0.0475. According to Kruskal (1964), a value of E≤ 0.05 is indicative of excellent precision of the estimates. Similar results have been reported by other authors for banana (Creste et al., 2004; Amorim et al., 2008).
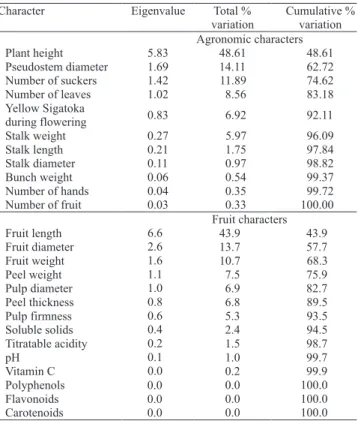
Principal component analysis using eleven agronomical variables is presented in Table 4. The
first three components explained 74.62% of the
total variation. Four clusters were formed (Figure 1
A). However, more divergent accessions can be
observed, such as 17 ('Pacha Nadan'), 18 ('Champa Madras') and 3 ('Malbut').
Considering the fruit variables, the first three
principal components explained 68.3% of the total variation between the 26 accessions (Table 4). Four groups were formed, with 13 ('Nam'), 17 ('Pacha Nadan'), 24 ('Porp') and 26 ('Teparod') being the most divergent (Figure 1 B). No coincidence was observed between the clusters considering the agronomical and fruit variables, except for 'Pacha Nadan'.
The estimates of the relative contribution of each variable, for expressing genetic diversity using Singh´s (1981) criteria, indicated that for the agronomic variables, the number of fruit contributed with 83.80% of the variation (Table 5), while fruit weight and pulp weight contributed with 59.42% and 30.32% of the variation, respectively, to the fruit variables (Table 5).
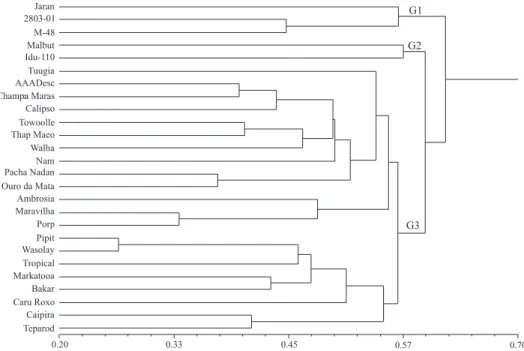
Considering the distance matrices for the agronomic, fruit and molecular (SSR) data, a dendrogram was constructed using the Gower (1971) algorithm (Figure 2). The cophenetic value was high (r = 0.88, p<0.0001, 10.000 permutations) and adequate, since rt 0.56 is considered ideal, reflecting
Table 4. Principal component analyses for agronomic and fruit characters in 26 banana accessions from the Embrapa Mandioca e Fruticultura Tropical Germplasm Bank.
a good fit with genetic similarity (Vaz Patto et al.,
2004).
Adopting the average genetic divergence (0.57) as the cut-off point, three groups were formed: G1, formed by the diploids 'Jaran', 028003-01 and M-48; G2, formed by the diploids 'Malbut' and 'Ido 110'; and G3, formed by 21 tri-and tetraploid, including one diploid 'Tuugia' accession. The triploids with the B genome, 'Thap Maeo', 'Walha', 'Pacha Nadan' and 'Champa Madras' were grouped in G2. The results from this work can be used as sources for banana genetic breeding, for the development of tri- and tetraploid hybrids with good agronomic traits.
The most divergent accessions 'Porp' (tetraploid AAAB) and 'Jaran' (diploid AA) also showed divergent concentrations of functional compounds
(carotenoids, flavonoids, polyphenols and vitamin
C) (Table 3). These accessions can be intercrossed to develop segregating populations for genetic mapping and to identify genes associated with these compounds. Furthermore, other parental combinations can be set up for the development of hybrids with promising agronomic traits and potential use as functional foods.
S.j: contribution of the x variable for the Euclidian distance among i and i’genotypes.
Table 5. Relative importance (S.j.) of agronomic and fruit characters for the study of genetic diversity, in 26 banana accessions from the Embrapa Mandioca e Fruticultura Tropical Germplasm Bank.
Conclusions
1. There is genetic variability for most agronomic and fruit characters in the 26 banana accessions studied.
2. The number and weight of fruit and pulp weight account for most of the variation found.
3. The Gower algorithm is efficient in quantifying the
genetic variability between the 26 banana accessions.
Acknowledgements
To Fundação de Amparo à Pesquisa do Estado da Bahia (Fapesb), for the scholarship granted.
References
ALVES, E.J.; OLIVEIRA, M.A. Práticas culturais. In: Alves, E. (Org.). A cultura da banana: aspectos técnicos, socioeconômicos e agroindustriais. 2.ed. Brasília: Embrapa-SPI: Embrapa-CNPMF, 1999. p.335-352.
AMORIM, E.P; LESSA, L.S.; LEDO, C.A.S.; AMORIM, V.B. de O.; REIS, R.V. dos ; SANTOS-seREJO, J.A. dos; SILVA, S.O. Caracterização agronômica e molecular de genótipos diplóides melhorados de bananeira. Revista Brasileira de Fruticultura, v.31, p.154-161, 2009a.
AMORIM, E.P.; RAMOS, N.P.; UNGARO, M.R.G.; KIIHL,
T.A.M. Divergência genética em genótipos de girassol. Ciência e Agrotecnologia, v.31, n.6, p.1637-1644, 2007.
AMORIM, E.P.; COHEN, K.O.; AMORIM, V.B.O.; SANTOS‑ SEREJO, J.A.; SILVA, S.O.; VILARINHOS, A.D.; MONTE, D.C.;
PAES, N.S.; REIS, R.V. The genetic diversity of carotenoid-rich bananas measured by diversity arrays technology (DArT). Genetics and Molecular Biology, 2009b.
AMORIM, E.P.; REIS, R.V.; AMORIM, V.B.O.; SANTOS-SEREJO, J.A.; SILVA, S.O. Variabilidade genética estimada entre diplóides de banana por meio de marcadores microssatélites. Pesquisa Agropecuária Brasileira, v.43, p.1045-1052, 2008.
Association of Official Analytical Chemists. official methods of
analysis of Association of Official Analytical Chemists. 16 ed. Arlington, 1997.
CRESTE, S.; NETO, A.T.; VENCOVSKY, R.; SILVA, S.O.; FIGUEIRA, A. Genetic diversity of Musa diploid and triploid
accessions from the Brazilian banana breeding program estimated by microsatellite markers. Genetic Resources and Crop Evolution, v.51, n.7, p.723-733, 2004.
CROUCH, H.K.; CROUCH, J.H.; JARRET, R.L.; CREGAN, P.B.;
ORTIZ, R. Segregation at microsatellite loci in haploid and diploid gametes of Musa. Crop Science, v.38, p.211-217, 1998.
CRUZ, C.D.; SCHUSTER, I. GQMOL: aplicativo computacional
para análise de dados moleculares e de suas associações com caracteres quantitativos. Versão 2.1. Viçosa: UFV, 2004.
CRUZ, C.D.; REGAZZI, A.J. Modelos biométricos aplicados ao melhoramento genético. 2. ed. Viçosa: UFV, 1997.
DOYLE, J.J.; DOYLE, J.L. Isolation of plant DNA from fresh tissue. Focus, v.12, n.1, p.13-15, 1990.
ENGLBERGER, L.; AALBERSBERG, W.; RAVI, P.; BONNIN,
E.; MARKS, G.C.; FITZGERALD, M.H.; ELYMORE, J. Further
analyses on Micronesian banana, taro, breadfruit and other foods for provitamin A carotenoids and minerals. Journal of Food Composition and Analysis, v.16, n.2, p.219-236, 2003.
FAO. Food and Agriculture Organization of the United Nations. Disponível em: <www.faostat.fao.org/site/340/default.aspx>. Acesso em: 21 jan. 2009.
GOWER, J.C. A general coefficient of similarity and some of its
properties. Biometrics, v.27, p.857-874, 1971.
KRUSKAL J.B. Multidimensional scaling by optimizing
goodness of fit to a nonmetric hypothesis. Psychometrika. v.29,
p.1-27, 1964.
LAGODA, P.J.L.; NOYER, J.L.; DAMBIER, D.; BAURENS, F.C.; GRAPIN, A.; LANAUD, C. Sequence tagged microsatellite site (STMS) markers in the Musaceae. Molecular Ecology, v.7, p.659-663, 1998.
LAKO, J.; TRENERRY, V.C.; WAHLQVIST, M.;
WATTANAPENPAIBOON, N.; SOTHEESWARAN, S.;
PREMIER, R. Phytochemical flavonols, carotenoids and the
antioxidant properties of a wide selection of Fijian fruit, vegetables and other readily available foods. Food Chemistry, v.101, p.1727-1741, 2007.
NEI, M.; LI, W.H. Mathematical model for studying genetic
variation in terms of restriction endonucleases. Procedures of the National Academic Science, v.76, p.5269-5273, 1979.
OBANDA, M.; OWUOR, P.O. Flavanol composisition and caffeine content of green leaf as quality potencial indicators of Kenyan black teas. Jornal of the Science of Food and Agriculture. v.74, p.209-215, 1997.
ORIERO, C.E.; ODUNOLA, O.A.; LOKKO, Y.; INGELBRECHT,
I. Analysis of B-genome derived simple sequence repeat (SSR) markers in Musa spp. African Journal of Biotechnology, v.5, p.126-128, 2006.
RIJKE, E.; OUT, P.; NIESSEN, W.M.A.; ARIESE, F.; GOOIJER, C.; BRINKMAN, U.A.T. Analytical separation and detection
methods for flavonoids. Journal of Chromatography, v.112,
n.1-2, p.31-63, 2006.
RODRIGUEZ-AMAYA, D.B. A guide to carotenoid analysis in foods. Washington: ILSI, 1999, 64p.
ROHLF, F.J. NTSYS pc: numerical taxonomy and multivariate
analysis system. New York: Exeter Software, 2000.
SCOTT, A.J.; KNOTT, M.A. A cluster analysis method for grouping means in the analysis of variance. Biometrics, v.30, n.3, p.507-512, 1974.
SILVA, S.O.; ALVES, E.J.; LIMA, M.B.; SILVEIRA, J.R.S.
Bananeira. In: BRUCKNER, C.H. Melhoramento de Fruteiras
SINGH, D. The relative importance of characters affecting genetic
divergence. The Indian Journal of Genetics and Plant Breeding, v.41, n.1, p.237-245, 1981.
SOTO BALLESTERO, M. Bananos: cultivo y comercialización. 2. ed. San José: LIL, 1992. 674p.
STOVER, R.H. Banana, plantain, and abaca diseases. Kew:
Commonwhealth Mycological Institute, 1972. 316p.
TERADA, M.; WATANABE, Y.; KUNITOMA, M.; HAYASHI,
E. Differential rapid analysis of ascorbic acid and ascorbic
acid 2-sulfate by dinitrophenilhydrazine method. Analytical Biochemistry, v.4, n.2, p.604-608, 1979.
VAZ PATTO, M.C.; SATOVIC, Z.; PÊGO, S.; FEVEREIRO, P. Assessing the genetic diversity of Portuguese maize germplasm using microsatellite markers. Euphytica, v.137, n.1, p.63-72, 2004.
VIJAYAKUMAR, S.; PRESANNAKUMAR, G.; VIJAYAKUMAR,
N.R. Antioxidant activity of banana flavonoids. Fitoterapia, v.79,
p.279-282, 2008.