http://dx.doi.org/10.1590/1806-9061-2016-0447
Parameters of Broilers
Author(s)
Ahmad HI
Khalique AI
Naveed SI
Zia MWI
Rasool ZII
Zahid UIII
Moeed AIV
I Department of Animal Nutrition, Faculty
of Animal Production and Technology, University ofVeterinary and Animal Sciences, Lahore 54000, Punjab, Pakistan
II Kemin Industries, EMENA, Belgium
III Zagro Asia Ltd, Woodlands Terrace,
Singapore
IV Institute of Molecular Immunology,
Technical University Munich, Germany
Mail Address
Corresponding author e-mail address Dr. Muhammad Waseem Zia, Ph.D. Scholar Department of Animal Nutrition, University
of Veterinary and Animal Sciences, Lahore 54000, Pakistan.
Tel: +92 3006745751 Email: [email protected]
Keywords
Broiler, growth parameters, poultry byproduct meal, fat oxidation, antioxidant slaughter traits.
Submitted: 11/December/2016 Approved: 05/May/2017
ABSTRACT
This study was conducted to investigate the effect of a commercial antioxidant (CAO; Rendox Plus®) treatment in stabilizing the poultry
byproduct meal (PBPM) and then the subsequent effect of the treated PBPM on growth of broilers. Five batches A, B, C, D and E of PBPM were treated with CAO at 0, 250, 500, 750 and 1000 mL/ton, respectively and stored for 42 days. Oxidative stability of PBPM was estimated on day 0 and then weekly using Peroxide Value and Thiobarbituric Acid tests. PBPMs treated with 750 &1000 mL/ton presented the least oxidation and were selected to be included in broiler diets. A total of 240 one-day-old non-sexed Hubbard broilers were randomly divided into two flocks of 120 birds each. Each flock was further divided into four groups with three replicates of 10 birds each. The selected PBPMs (D and E) were added at 4%, 5%, 6% and 7% in the starter and grower diets. The experiment lasted for 35 days. The PBPM treated with 1000 mLCAO/ton exhibited the lowest (p<0.05) oxidation level compared to other treated PBPMs. PBPMs with up to 7% CAO inclusion rate did not influence (p>0.05) broiler feed intake, weight gain, feed conversion ratio, final body weight, carcass traits, or mortality rate. It was concluded that CAO was effective in stabilizing PBPM, and up to 7% (70 g/kg) of CAO-treated PBPM can be safely included in broiler diets without any harmful effect on their performance.
INTRODUCTION
The cost of feed ingredients is increasing day by day due to their shortage. Among feed ingredients, protein- and energy-rich ingredients of poultry feeds are the most expensive. Protein is supplied both from vegetable and animal sources, such as oilseed meals, legumes, abattoir waste, poultry byproduct meal (PBPM), and fish processing byproducts. Plants are still the main chief source of different poultry feed nutrients, but the accelerated pace of livestock growth cannot be maintained at the current crop production volume worldwide. Therefore, exploring and utilizing feed resources that have high protein value for poultry and cannot be consumed by humans is necessary.
In this regard, the use of unconventional poultry feed sources may be a solution. Unconventional feed ingredients include synthetic single-cell proteins, different animal processing byproducts, such as poultry byproduct meal (PBPM), and insects (fly larvae). Since 1950, PBPM is known as a rich protein and fat source (Kirkland & Fuller, 1971). Poultry byproduct meal is also called poultry byproducts, poultry offal meal, poultry meal, poultry offal, poultry viscera meal, poultry slaughterhouse waste, chicken offal, chicken byproduct meal, hen meal and spent heal meal (Heuze et al., 2015).
re-sizing (Miller, 1996). The material is dried, fat and protein are separated by heating at 140ºC (Ockerman & Hansen, 1988), resulting in PBPM after skimming off the fat (AAFCO, 2004). Its inclusion in feeds not only reduces feed cost but also the environment burden of its disposal (FAO, 2011). It is used in poultry diets as an alternative protein source to replace soybean (Erturk & Celik, 2004) and fish meal (Raja et al., 2001). The inclusion of animal by products in poultry diet significantly affects the bird performance (Caires et al.,
2010; Silva et al., 2014; Edney et al., 2014). It can be added in poultry feeds up to 6%, according to Sahraei
et al. (2012), and inclusion levels ranging from 7.5% (Hosseinzadeh et al., 2010) to 12% (Christmas et al.,
1996) have been reported. PBPM has an adequate profile of available essential amino acids and is rich in calcium, phosphorus, and vitamin B12 (NRC, 1994). It has low methionine content, but it is remarkably rich in choline (Wang, 1997).
The global production of PBPM is expected to double by 2050 (Boushy & Poel, 2000). Therefore, categorizing PBPM as a major feed ingredient (Alex, 2006) may open new dimensions in the animal feed industry in the future. Unfortunately, heat, pressure, mechanical grinding, and mixing during rendering of poultry waste accelerate the process of fat oxidation: which is oxidative degradation of lipids (Wang et al.,
1997). Lipid peroxidation is the oxidative degradation of lipids. It is the process in which free radicals “steal” electrons from the lipids in cell membranes, resulting in cell damage.
Deterioration due to oxidation of unsaturated fats reduces the quality of PBPM. Therefore, the main obstacle for the use of PBPM in animal feeds is its limited shelf life due to spoilage during storage. Oxidized PBPM not only affects its nutritive value (Pesti et al.,
2002), but also broiler health (Dibner, 1996), impairing growth performance, reducing hematocrit values and increase intestinal linings loughing. Oxidized PBPM also produces antigenic stimulation, which result in lymphocyte proliferation. Rancidity reduces PBPM essential fatty acid contents in just six weeks (Kirkland & Fuller, 1971).
Antioxidants are the best choice to delay the onset of oxidation by preventing the formation of free radicals. Free radicals oxidize fats, and antioxidants stop the reaction by donating the hydrogen atoms (Sies, 1997). The objective of the use antioxidants is to enhance the oxidative stability for a reasonable length of time. Antioxidants are used to ensure the
the animal industry (Dozier et al., 2003). Antioxidants are either primary or secondary. Primary antioxidants, such as ascorbic acid, butylated hydroxytoluene (BHT), butylated hydroxyanisole (BHA), tertiary-butyl hydroquinone (TBHQ), are peroxide stabilizers, whereas secondary antioxidants (lecithins) delay the initiation
of the autoxidation process (Frankel et al., 1994).
Antioxidants inhibit oxidation by scavenging free radicals at various steps of oxidation. The antioxidants are used to slow down the process of oxidation and to delay the induction point for preserving the quality of PBPM.
Rendox Plus® is a commercial antioxidant composed
of butylated hydroxyanisole (BHA), butylated hydroxytoluene (BHT), citric acid, ethoxyquin, propylgallate, propionic acid, and a carrier material. Among antioxidants, the efficacy of CAO has been reported as remarkably high due to the synergistic effect between antioxidants and metal chelators (citric acid)(Guzman et al., 2009). Therefore, the objective of the present study was planned to evaluate the antioxidant capability of CAO in stabilizing rendered PBPM, and then to test the subsequent effect of this treated PBPM on growth performance of broilers.
MATERIALS AND METHODS
Ethical approval
The experimental protocol was approved by The Institutional Animal Ethics Committee.
This study was conducted at the University of Veterinary and Animal Sciences (UVAS), Ravi Campus, Pattoki, Pakistan.
The study was designed in two phases. In the first phase, different batches of un-oxidized PBPMs were treated with a commercial liquid antioxidant (Rendox
Plus®), and their oxidation status was evaluated by
laboratory analysis. In the second phase, the treated PBPMs were included in broiler diets at different levels.
Phase I: Experimental material and Anti-oxidant Treatment
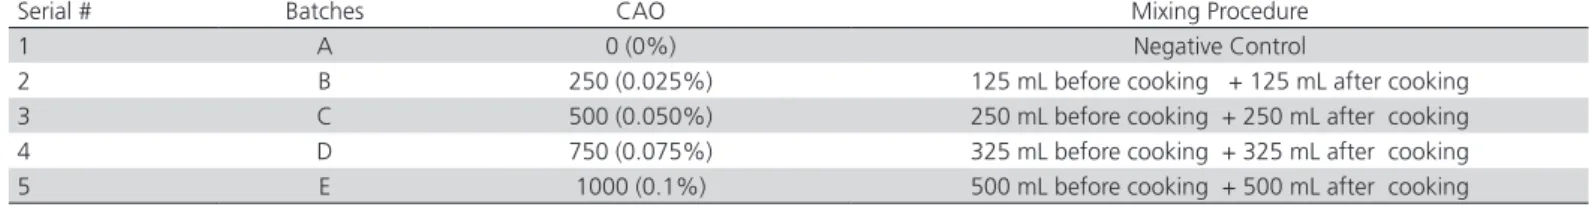
batches and their treatments are presented in Table 1. As during cooking the PBPMs were heated to≈ 130ºC, only half of the total dose was mixed before cooking to prevent the loss of antioxidant. The reason for applying half the dose before cooking was to avoid PBPM oxidation during cooking. According to manufacturer, this method would increase the efficacy of the evaluated CA. Each batch of PBPM was duly identified, and was stored in triplicate under normal storage conditions (25oC) for 42 days. The oxidative
stability of the experimental PBPM batches was evaluated by determining their peroxide values (POV) and thiobarbituric acid values (TBAV) on day 0, and then fortnightly during 42-day storage period.
Laboratory Analysis
The oxidative stability of PBPM batches were analyzed for POV and TBAV on days 0, 14, 28 and 42 of storage according to IUPAC (1992) at the Animal Nutrition Diagnostic Laboratory, Department of Animal Nutrition, UVAS (Ravi Campus), Pattoki, Pakistan.
Peroxides are the primary products of fat and oil oxidation. Peroxide value was calculated as S × M × 1000/weight of the sample in grams, where S = mL of Na2S2O3, and M = 0.01, the concentration of theNa2S2O3, solution, according to Horwitz et al.(2002), and expressed in mEq of peroxide/kg of oil. POV (mEq/ kg) = volume of sodium thiosalphate × molarity of thiosulfate x 1000/ sample weight.
Aldehydes are secondary products of fat oxidation. The thiobarbituricacid (TBA) test measures malonaldehyde (MDA) formation, and it is a colorimetric method (measures color intensity), in which the absorbance of a red chromogen (color) formed between TBAV and MDA is measured at 530 nm (Rhee, 1978; Pokorny et al.,1989).Color intensity is correlated with the degree of rancidity. The test involves primarily a reaction of TBA with malonic dialdehyde by heating in the presence of a strong acid to give a red coloration. The TBA analysis can be performed directly by heating the sample with TBA, followed by extraction of the colored complex on a portion of the steam distillate of lipids obtained by aqueous or acid
extraction from the samples. The result is expressed as TBA value (mg), which is calculated according to the formula:
TBA value=50 (absorbance of test solution – absorbance of reagent blank)/mass of test portion
Microbial Analysis
Microbiological analysis was performed at the Diagnostic Laboratory, University of Veterinary and Animal Sciences (City Campus), Lahore, Pakistan, to evaluate coliforms and total viable count in every batch of PBPM.
Phase II: Experimental animals, manage-ment, and experimental design
The biological trial of the second phase of this study was conducted at Poultry Research and Training Centre (PRTC), UVAS (Ravi Campus) Pattoki.
Two PBPMs batches (D and E) treated with the CAO (750mL/ton & 1000mL/ton, respectively) that presented the least oxidation (rancidity) in the laboratory analyses were chosen to be added to broiler diets at inclusion levels of 4, 5, 6, and 7%to evaluate their influence on broiler performance.
A total of 240 Hubbard non-sexed broilers were obtained from a local supplier and housed in an environmentally-controlled shed on floor pens (1m2) covered with rice-husk litter at 10 birds/pen.
Pens were equipped with automatic nipple drinkers and removable trough feeders. According to the requirement of the birds, the temperature in the first week was maintained at 95°F and dropped to 5°F in every week. The light was provided for 24 hours. The birds were allowed free access to feed and fresh water during the entire experiment. The birds were vaccinated against Newcastle + Infectious bronchitis (1 day of age); infectious bursal disease (7 and 14 days of age) and Newcastle disease (21 days of age) as per the standard vaccination schedule. The birds were kept under the same management conditions.
A number of 240 birds were distributed according to a completely randomized design in a 2 x 4 factorial arrangement, consisting of two PBPM batches and
Table 1 – Levels of CAO (Rendox Plus®) incorporated in poultry byproduct meal
Serial # Batches CAO Mixing Procedure
1 A 0 (0%) Negative Control
2 B 250 (0.025%) 125 mL before cooking + 125 mL after cooking 3 C 500 (0.050%) 250 mL before cooking + 250 mL after cooking 4 D 750 (0.075%) 325 mL before cooking + 325 mL after cooking 5 E 1000 (0.1%) 500 mL before cooking + 500 mL after cooking
four dietary inclusion levels (4%, 5%, 6%, & 7%) of each PBPM, totaling eight treatments (experimental diets) with three replicates of 10 birds each.
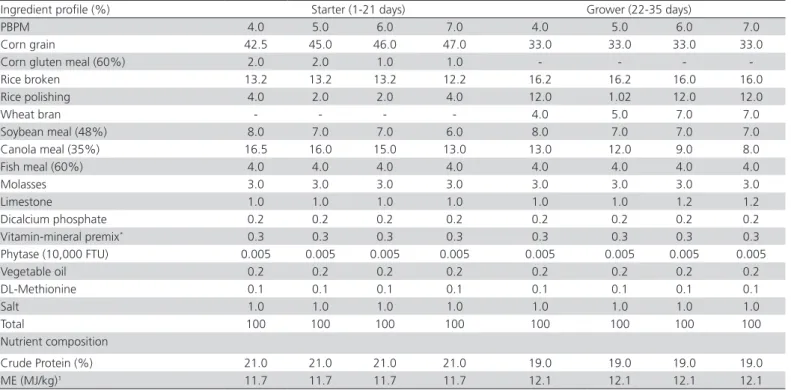
The experimental diets were formulated to meet the birds’ nutrient requirements according to the NRC (1994). The starter and grower diets were fed from 1 to 21 and 22 to 35 days of age, respectively. The starter diets contained 21% crude protein (CP) and 11.7 MJ/ kg metabolizable energy (ME), and the grower diets contained 19% CP and 12.1 MJ ME/kg. The inclusion levels of the feed ingredients in the experimental starter and broiler grower diets are given in Table 4. The laboratory analyses were conducted at Animal Nutrition Diagnostic Laboratory, Department of Animal Nutrition, UVAS (Ravi Campus), Pattoki, Pakistan.
The following performance parameters were measured: feed intake, body weight gain, mortality rate, and feed conversion ratio (FCR).
Feed intake was calculated as feed offer minus feed refused (Verma et al., 2004). Birds were individually weighed at the beginning of the experiment, and then weekly until the end of trial to determine average body weight gain. Feed conversion ratio was calculated according to the formula: FCR = feed intake (g)/ weight gain (g), and was calculated weekly. Average initial body weight of the individual experimental birds was noted at the start of the experiment and then weighed weekly. Final body weights were recorded at the end of the experiment. Mortality was daily checked, and the weight of dead birds was recorded for the correction of weekly FCR.
At the end of the experiment, when birds were 35 days of age, two birds per pen (six birds per treatment, totaling 48 birds) were randomly selected, feed-fasted
for eight hours, and sacrificed for the evaluation of the following carcass traits: final live body weight, carcass weight, thymus weight, liver weight, heart weight, spleen weight, bursa weight, and dressing percentage.
Statistical analysis
Data were analyzed by two-way analysis of variance (ANOVA) applying a completely randomized design in a 2 x 4 factorial arrangement using General Linear Model procedures (Steel et al., 1997). The differences among treatment means were compared using Duncan’s Multiple Range (DMR) test (Duncan, 1955) using SAS 9.1 (2002-03) portable software. The significance level of p<0.05 was adopted. Results are expressed as means and their standard errors (Means ± SE).
RESULTS
During the first phase of the study, lipid hydroperoxides, considered as the measure of oxidation, were quantified using to peroxide value (POV) and thiobarbituric acid value (TBAV). The analyzed POV and TBAV determined on storage days 0, 14, 28 and 42 of the PBPMs experimental batches of A, B, C, D and E, treated with the CAO at 0, 250, 500, 750 and 1000 mL/ton, respectively, are given in Table 2,and were significantly different (p<0.05) among batches. The lowest POV (0.83 and 0.82 mEq/kg) was observed in batches D and E treated with CAOat750 and 1000 mL/ ton. TBAV was used as an indicator of the presence of secondary lipid oxidation products, i.e. malonaldehyde (MDA), responsible for the development of rancid taste during storage, and was determined on storage days 0, 14, 28, and 42. TBAV results are presented in Table 2. The highest TBAV value (3.20 mg MDA/kg)
Table 2 – POV and TBA values of treated PBPM during storage period of 42 days
Batches CAO (mL/ton) Analytical test Storage period
0 days 14 days 28 days 42 days
A 0
(untreated control)
POV* 0.90 ± 0.00a 1.06 ± 0.03a 1.16 ± 0.00a 5.39 ± 0.01a
TBA** 0.52 ± 0.00a 0.58 ± 0.00a 0.66 ± 0.00a 3.20± 0.05a
B 250 POV 0.88 ± 0.00
b 0.94 ± 0.00b 0.98 ± 0.00b 1.12 ± 0.00b
TBA 0.50 ± 0.00b 0.54 ± 0.00b 0.55 ± 0.00b 0.63 ± 0.00b
C 500 POV 0.86 ± 0.00
c 0.91 ± 0.00b 0.93 ± 0.00c 1.07 ± 0.01c
TBA 0.47 ± 0.00c 0.51 ± 0.00c 0.54 ± 0.00c 0.63 ± 0.00c
D 750 POV 0.83 ± 0.00
d 0.90 ± 0.00b 0.92 ± 0.00c 1.03 ± 0.00d
TBA 0.46 ± 0.00c 0.51 ± 0.00c 0.52 ± 0.00c 0.58 ± 0.00bc
E 1000 POV 0.82 ± 0.00
d 0.84 ± 0.00c 0.87 ± 0.00d 0.95 ± 0.00e
TBA 0.40 ± 0.00d 0.47 ± 0.00d 0.49 ± 0.00d 0.50 ± 0.00c
Means with different superscripts within a row are significantly different at p<0.05; CAO: commercial antioxidant POV: peroxide value; TBA: thiobarbituric acid
was determined in the control batch A (not treated with CAO) on storage day 42, indicating it was rancid, and therefore, was not suitable for incorporation in the broiler diet. Batches D and E, treated with CAO at 750 and 1000 mL/ton, respectively, exhibited better fat stability in terms of TBAV (0.46 and 0.40mg MDA/kg, respectively). Considering these results, PBPM batches D and E were selected for inclusion in the broiler diets to study their influence on broiler performance.
The selected PBPM batches (D and E) were included in the broiler starter and grower diets at 4%, 5%, 6% and 7%. Live performance results are presented in Table 5, showing that feed intake, body weight gain, and FCR were not influenced (p>0.05) by PBPM batches treated with 750 or 1000mL/ton of CAO, nor by their inclusion levels.
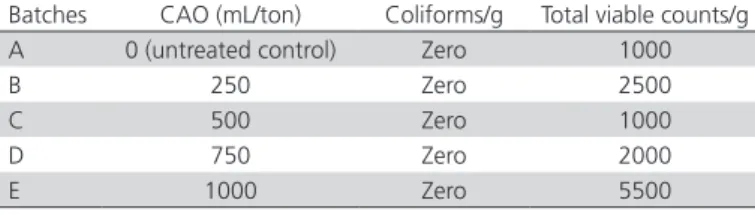
Microbiological analysis of PBPM are presented in Table 3. All PBPM batches were free from coliforms and total viable microbial count showed no relationship with CAO treatment levels.
Table 3 – Coliform and Total Viable counts of PBM Batches
Batches CAO (mL/ton) Coliforms/g Total viable counts/g A 0 (untreated control) Zero 1000
B 250 Zero 2500
C 500 Zero 1000
D 750 Zero 2000
E 1000 Zero 5500
Analyses in duplicate were carried out at University Diagnostic Lab. (UDL), UVAS, Lahore, Pakistan; CAO: commercial antioxidant
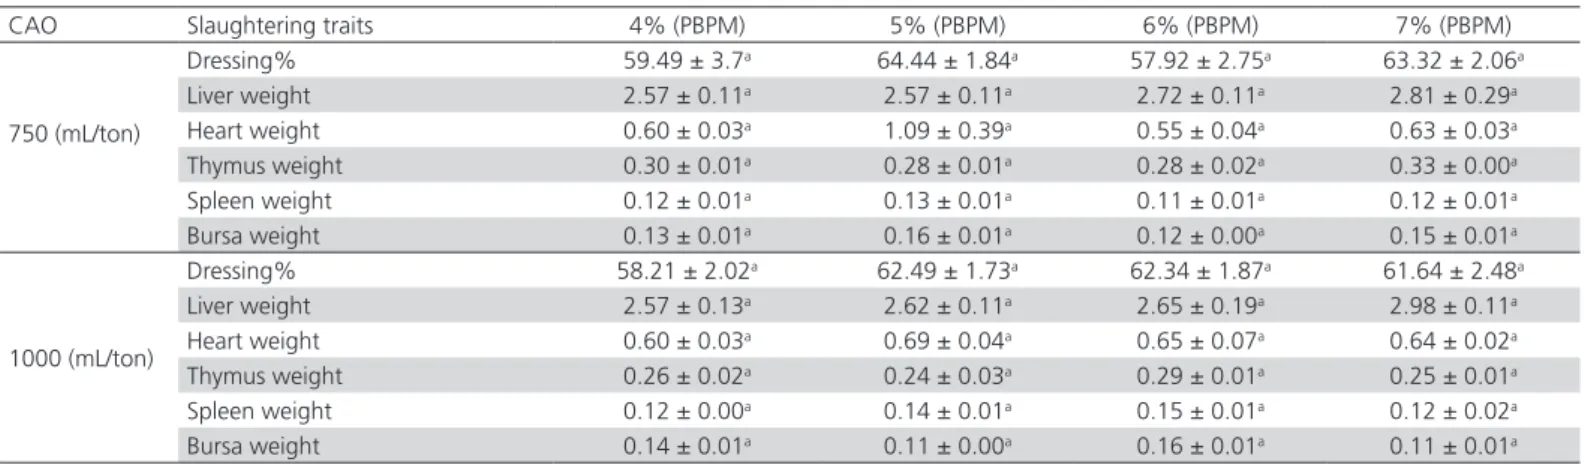
Carcass results are presented in Table 6. Again, there was no effect (p>0.05) of PBPM batch or their inclusion levels in the experimental broiler diets on the evaluated carcass traits.
DISCUSSION
Peroxide values (Table 2) indicated that the control batch, with no antioxidant inclusion, was clearly rancid, and that the dietary inclusion of the evaluated CAO at 750 and 1000mL/ton of poultry byproduct meal (PBPM) successfully delayed fat oxidation, stabilizing the fat present in PBPM. However, significant lower POV on storage days 14, 28, and 42 were determined with CAO addition at 1000mL/ton compared with 750 mL/ton. Fortnightly mean TBAV from day 0 to day 42 showed that the lipids in the CAO-treated PBPM batches were stabilized relative to the control (untreated) batch. On storage day 42, higher POV and TBAV (5.39 ± 0.01 mEq/kg and 3.20 ± 0.05mg MDA/ kg, respectively) were observed in the control batch (A) relative to the other batches B, C, D and E, and the
lowest values (p<0.05) in batch E treated with 1000 mL CAO/ton (POV= 0.95 ± 0.00mEq/kg and TBAV= 0.50 ± 0.00mg MDA/kg). Similar findings have been reported by Pereira et al. (1975), who indicated that the fat oxidation accelerated at high temperatures can be controlled by the addition of the same CAO evaluated in the present study. Mustafa et al. (2002) also found that antioxidants effectively stabilized fat in broiler diets. The POV of unsaturated fats increases with storage time, and their shelf life can be increased with the addition of antioxidants. The results of the present study are consistent with those described by other researchers, who showed that the POV of PBPM increased with increasing storage times (El-Shater et
al., 2012) and, in the present study, least increase
was observed in the PBPM treated at the maximum antioxidant level (1000 mL/ton). Guzman (2009) also observed lipid stabilization in soybean oil and poultry fat treated with different synthetic antioxidants. Ramzan (1998) reported that the TBAV of broiler feeds increased with storage time. The findings of the current study support the results of Ozer & Sarcoban (2010) that the application of an antioxidant decreased the TBAV of mechanically-deboned chicken patties to permissible limits. In the untreated PBPM batch (A), the determined TBAV was higher (3.20 mg MDA/kg) on day 42than the safety limits recommended by the Egyptian Standards (ES, 2005), which states that TBAV of ≥ 0.9 mg MDA/kg of a product at any given time is sufficient to consider it rancid. Therefore, the PBPM not treated with CAO was definitely rancid on day 42, and therefore, unsafe to be included in broiler diets. Although lower POV and TBAV were determined in all treated batches (B, C, D and E) compared with control batch A, significantly (p<0.05) lower POV and TBAV values were recorded in “batch E” at the maximum inclusion level (1000mL/ton) of CAO, reflecting the least oxidation and maximum shelf life, followed by batch D, treated with 750mL CAO/ton.
The microbiological analyses of the evaluated PBPM (Table 3) showed low (<10,000 cfu/g) microbiological load. These results are coherent with the findings of Karlovsky et al. (2016), who claimed that in rendered feed grade products, no irradiation is required for decreasing the bacterial load. This explains the lower microbiological load in our study samples. In the present study, PBPM batches were passed through
rendering process at 130oC which decreased the
being processed through rendering, thus establishes the anti-microbial efficacy of rendering process. Piette
et al. (2000) claimed that rendering temperature of
80oC will destroy most pathogens to the limit that
consider being safe, thus establishes anti-microbial efficacy of rendering process. Further evidence can be drawn from the statement of Ewen & Pusztai (1999) who reported no incidence of toxi-infection related to rendered chicken fat.
The results in Table 5 show that the evaluated dietary PBPM inclusion levels (4%, 5%, 6%, or 7%) and CAO treatment levels (750 & 1000 mL/ton) had no significant effect (p>0.05) on weekly feed intake, body weight gain, or FCR. However, numerically, the highest body weight gain (2027.19 ± 57.77 g) was observed
in the birds fed the diet with 7% PBPM treated with CAO at 1000 mL/ton (batch E). These findings are in
accordance with those of Sahraei et al. (2012), who
added PBPM at 3%, 6% and 9% in broiler diets and did not observe any significant (p>0.05) differences
in broiler performance among treatments. Samli et
al.(2006)did not observe any significant (p>0.05) effects of the addition of PBPM up to 10% in layer diets. However, Pesti et al. (1986) fed PBPM to broilers and concluded that PBPM did not influence their performance compared with a diet based on corn and soybean meal. The inclusion of 9% and 10% PBPM in broiler diets did not have any adverse effects on live performance (Mohammadi et al., 2011; Jafari et al.,
2011). Hosseinzadeh et al. (2010) incorporated up
Table 4 – Ingredient composition and nutrient analysis of the experimental diets
Ingredient profile (%) Starter (1-21 days) Grower (22-35 days)
PBPM 4.0 5.0 6.0 7.0 4.0 5.0 6.0 7.0
Corn grain 42.5 45.0 46.0 47.0 33.0 33.0 33.0 33.0
Corn gluten meal (60%) 2.0 2.0 1.0 1.0 - - -
-Rice broken 13.2 13.2 13.2 12.2 16.2 16.2 16.0 16.0
Rice polishing 4.0 2.0 2.0 4.0 12.0 1.02 12.0 12.0
Wheat bran - - - - 4.0 5.0 7.0 7.0
Soybean meal (48%) 8.0 7.0 7.0 6.0 8.0 7.0 7.0 7.0
Canola meal (35%) 16.5 16.0 15.0 13.0 13.0 12.0 9.0 8.0
Fish meal (60%) 4.0 4.0 4.0 4.0 4.0 4.0 4.0 4.0
Molasses 3.0 3.0 3.0 3.0 3.0 3.0 3.0 3.0
Limestone 1.0 1.0 1.0 1.0 1.0 1.0 1.2 1.2
Dicalcium phosphate 0.2 0.2 0.2 0.2 0.2 0.2 0.2 0.2
Vitamin-mineral premix* 0.3 0.3 0.3 0.3 0.3 0.3 0.3 0.3
Phytase (10,000 FTU) 0.005 0.005 0.005 0.005 0.005 0.005 0.005 0.005
Vegetable oil 0.2 0.2 0.2 0.2 0.2 0.2 0.2 0.2
DL-Methionine 0.1 0.1 0.1 0.1 0.1 0.1 0.1 0.1
Salt 1.0 1.0 1.0 1.0 1.0 1.0 1.0 1.0
Total 100 100 100 100 100 100 100 100
Nutrient composition
Crude Protein (%) 21.0 21.0 21.0 21.0 19.0 19.0 19.0 19.0
ME (MJ/kg)1 11.7 11.7 11.7 11.7 12.1 12.1 12.1 12.1
*vitamin-mineral provided per kg of feed: Vitamin A, 6500 KIU; Vitamin D3, 1800 U; Vitamin E, 16000 mg; Vitamin K3, 1200 mg; Vitamin B1, 1200 mg; Vitamin B2, 3000 mg; Vitamin B6, 2600 mg; Vitamin B12, 10 mg; niacin, 20000 mg; d-pantothenic acid, 7000 mg; folic acid, 500 mg; d-biotin, 70 mg; choline chloride, 500 mg; Fe, 80 mg; Cu, 4000 mg; Zn, 40000 mg; Mn, 50000 mg; I, 600 mg, Co, 130 mg
1Metabolizable energy contents were estimated according to NRC (1994)
Table 5 – Effect of dietary PBPM and CAO inclusion levels on different growth parameters of 35-d-old broilers.
CAO GP 4% (PBPM) 5% (PBPM) 6% (PBPM) 7% (PBPM)
750 mL/ton
FI (g) 3753.42 ± 01.74a 3652.25± 93.65a 3620.57± 35.20a 3713.74 ± 55.75a
BWG (g) 1940.03 ± 35.12a 1995.32 ± 54.52a 1996.05 ± 54.47a 1958.56 ± 29.77a
FCR 1.87 ± 0.02a 1.86 ± 0.03a 1.86 ± 0.03a 1.86 ± 0.03a
M (%) 0.10 ± 0.055a 0.03 ± 0.033a 0.0 ± 0.0a 0.0 ± 0.0a
1000 mL/ton
FI (g) 3614.52 ± 32.66a 3744.48± 73.68a 3855.29±301.27a 3530.56 ± 73.62a
BWG (g) 1955.95 ± 36.61a 1956.95 ± 57.11a 1981.03 ± 49.05a 2027.19 ± 57.77a
FCR 1.83 ± 0.02a 1.87 ± 0.01a 1.87 ± 0.03a 1.86 ± 0.02a
M (%) 0.03 ± 0.033a 0.03 ± 0.033a 0.06 ± 0.046a 0.03 ± 0.033a
to 7.5% PBPM in the diet of Hy-line laying hens and claimed that laying performance were not affected.
Moreover, Mutucumarana et al. (2010) included 10%
PBPM in quail diets and did not report any detrimental effects on performance. On the other hand, Senkoylu
et al. (2005) reported that the dietary inclusion of 4% PBPM did not affect the feed intake of laying hens, but FCR was increased as PBPM in the diet increased
incorporated. Damron et al. (2001) incorporated
PBPM at 2.5%, 5%, 7.5%, and 10% in the diets of white leghorn hens and observed no effect on layer performance with10% PBPM compared the control group, with no PBPM, but no significant (p>0.05) feed intake differences among treatment groups. However, contrary to our results, Ertürk et al. (2004) found reduced feed intake in Japanese quails fed diets containing PBPM compared with those fed a control diet. This effect may be due to the high fat levels of PBPM, which tends to increase dietary energy density, consequently reducing feed intake (Bolu et al., 2008).
There was no effect of the dietary inclusion of increasing PBPM levels on broiler mortality (p>0.05). These results indicate that PBPM and CAO did not cause any undesirable effects.
Carcass results presented in Table 6 show that PBPM
and CAO did not influence (p>0.05) the evaluated
carcass traits, again indicating that dietary PBPM and CAO inclusion did not produce any undesirable effects on broiler carcasses. The dressing percentage was not significantly different (p>0.05) among treatments. Maximum dressing percentage was observed in the broilers fed 5% PBPM treated with 750mL CAO/ton, but was not statistically different from those obtained with the other treatments. The weights of the liver, heart, thymus, spleen, and bursa were not affected (p>0.05) by the evaluated PBPM and CAO levels. The highest numerical liver weight was observed in
broilers fed 7% PBPM treated with 1000mL CAO/ton, whereas the highest numerical heart weight in those fed 5% PBPM treated with 750mL CAO/ton. Despite the lack of statistical difference among treatments, the maximum thymus weight was observed in the group receiving 7% PBPM treated with 750mL of CAO/ton. Bursa weight was not significantly different among the treatments, by the heavier bursas were measured in the two groups receiving 6% PBPM treated with 1000mL of CAO/ton and 5% PBPM treated with 750mL of CAO/ton. These findings are consistent with the results Sahraei et al. (2012), who included that the PBPM in the diet of120 Ross broilers at levels 0%, 3%, 6%, 9% and did not find any significant (p>0.05) differences in carcass weight at 46 days of age.
Based on findings, under the conditions of this study, the poultry byproduct meal treated with 1000 mL/ton of evaluated commercial antioxidant product presented minimum antioxidant status. Its inclusion in the feed produced in substitution of soybean meal produced similar broiler live and carcass performance as that obtained when only soybean meal was added. Therefore, PBPM treated with 1000 mL/ton can be added up 70 g/kg in broiler diets.
ACKNOWLEDGMENT
The authors thank the administration at the Department of Poultry Production and the Department of Animal Nutrition, UVAS (Ravi Campus), Lahore, Pakistan, for facilitating this study, and Kemin Industries, EMENA, Belgium for providing the product and technical services.
REFERENCES
AAFCO. American Association of Feed Control Officials. Official Publication. Champaign; 2004.
Table 6 – Effect of dietary PBPM and CAO inclusion levels on dressing percentage and organ weights (g) of 35-d-old broilers
CAO Slaughtering traits 4% (PBPM) 5% (PBPM) 6% (PBPM) 7% (PBPM)
750 (mL/ton)
Dressing% 59.49 ± 3.7a 64.44 ± 1.84a 57.92 ± 2.75a 63.32 ± 2.06a
Liver weight 2.57 ± 0.11a 2.57 ± 0.11a 2.72 ± 0.11a 2.81 ± 0.29a
Heart weight 0.60 ± 0.03a 1.09 ± 0.39a 0.55 ± 0.04a 0.63 ± 0.03a
Thymus weight 0.30 ± 0.01a 0.28 ± 0.01a 0.28 ± 0.02a 0.33 ± 0.00a
Spleen weight 0.12 ± 0.01a 0.13 ± 0.01a 0.11 ± 0.01a 0.12 ± 0.01a
Bursa weight 0.13 ± 0.01a 0.16 ± 0.01a 0.12 ± 0.00a 0.15 ± 0.01a
1000 (mL/ton)
Dressing% 58.21 ± 2.02a 62.49 ± 1.73a 62.34 ± 1.87a 61.64 ± 2.48a
Liver weight 2.57 ± 0.13a 2.62 ± 0.11a 2.65 ± 0.19a 2.98 ± 0.11a
Heart weight 0.60 ± 0.03a 0.69 ± 0.04a 0.65 ± 0.07a 0.64 ± 0.02a
Thymus weight 0.26 ± 0.02a 0.24 ± 0.03a 0.29 ± 0.01a 0.25 ± 0.01a
Spleen weight 0.12 ± 0.00a 0.14 ± 0.01a 0.15 ± 0.01a 0.12 ± 0.02a
Bursa weight 0.14 ± 0.01a 0.11 ± 0.00a 0.16 ± 0.01a 0.11 ± 0.01a
Alex, C. Maximizing production efficiency by a better understanding of the 4th limiting amino acid in broiler formulation. Mississippi: Department of Poultry Science, Mississippi State University; 2006.
Bolu SA, Adakeja A. Effects of poultry offal meal and soybean meal mixtures on the performance and carcass quality of broiler chicks. African Journal of Food, Agriculture and Nutrition Development 2008;8(4):28–37.
Boushy EL, Van Der Poel AFB. Handbook of poultry feed from waste: processing and use. 2nd ed. Dordrecht: Kluwer Academic Publishers;
2000.
Caires C, Fernandes E, Fagundes N, Carvalho A, Maciel M, Oliveira B. The use of animal byproducts in broiler feeds: use of animal co-products in broilers diets. Brazilian Journal of Poultry Science 2010;12(1):41–46.
Christmas RB, Damron BL, Ouart MD. The performance of commercial broilers when fed various levels of rendered whole-hen meal. Poultry Science Journal 1996;75(4):536–539.
Damron BL, Ouart MD, Christmas RB. Rendered whole-bird layer mortality as an ingredient in layer diets. Journal of Applied Poultry Research 2001;10(4):371–375.
Dibner JJ, Atwell CA, Kitchell ML, Shermer WD, Ivey, FJ. Feeding of oxidized fats to broilers and swine: effects on enterocyte turnover, hepatocyte proliferation and the gut associated lymphoid tissue. Animal Feed Science and Technology 1996;62(1):1–13.
Dozier WA, Dale N, Dove CR. Nutrient composition of feed-grade and pet-food-grade poultry byproduct meal. Journal Applied Poultry Research 2003;12(4):526–530.
Duncan DB. Multiple range and multiple F-tests. Biometrics 1955;11:1–42.
El-shater MA, Hanan, Seadqwy G, Mohamed M. Studies on fat in some chicken products with trial to prevent its oxidation. New York Science Journal 2012;5(10):56–63.
Ertürk MM, Celik S. Substitution of poultry byproduct meal in diets of breeder Japanese quail (coturnix coturnix Japonica):1- Effects on performance parameters. Journal of Faculty of Agriculture, Akdeniz University 2004;17(1):59–66.
ES - Egyptian Organization For Standardization. Egyptian standard products of meat poultry treated with heat. Arab Republic of Egypt; 2005. p. 3493.
Ewen SWB, Pusztai A. Effects of diets containing genetically modified potatoes expressing Galanthus nivalis lectin on rat small intestine. Lancet 1999;354:1353–1354.
FAO. Food and Agriculture Organization of the United Nations. Rome; 2011.
Frankel EN, Huang SW, Kanner J, German JB. Interfacial phenomena in the evaluation of antioxidants: Bulk oils versus emulsions. Journal of Agriculture and Food Chemistry 1994;42(5):1054–1059.
Guzman RD, Haiying T, Steven S, Simon KY. Synergistic effects of antioxidants on the oxidative stability of soybean oil- and poultry fat-based biodiesel. Journal of American Oil Chemistry Society 2009;86:459.
Heuze V, Tran G, Chapoutot P, Noblet J, Renaudeau D, Lessire M, et al. Poultry by product meal., a programme by INRA, CIRAD, AFZ and FAO [cited 2015 Oct 2]. Rome: Feedipedia; 2015. Available from: http:// www.feedipedia.org/node/214.
Horwitz EW. Peroxide value of oils and fats. In: Official Methods of Analysis of AOAC International. 17th ed. Gaithersberg: AOAC International;
2002.
Hosseinzadeh M, Ebrahimnezhad Y, Janmohammad H, Ahmadzadeh A, Sarikhan M. Poultry byproduct meal influence on performance and egg quality traits of layers. International Journal of Agriculture Biology 2010;12(4):547–550.
IUPAC - International Union of Pure and Applied Chemistry. Standard methods for the analysis of oils, fats and derivatives {IUPAC Standard Method 2.501]. Oxford: Pergamon; 1992.
Jafari M, Yahya E, Hussein J, Kambiz N, Mahboob N. Evaluation of protein and energy quality of poultry byproduct meal using poultry assays. African Journal of Agriculture Research 2011;6(6):1407–1412.
Karlovsky P, Suman M, Berthiller F, Meester JD, Eisenbrand G, Perrin I, et al. Impact of food processing and detoxification treatments on mycotoxin contamination. Mycotoxin Research 2016;32(4):179–205.
Kirkland WM, Fuller HL. The effect of ethoxyquin on the chemical and nutritional changes of poultry byproduct meal and poultry offal fat during storage. Poultry Science Journal 1971;50(1):137–143.
Miller T. Utilizing rendered products: pet food. In: FrancoDA, Swanson W, editors. The original oecyclers. The animal protein producers industry, the fats & proteins. Alexandria: Research Foundation and The National Renderers Association; 1996.
Mohammadi M, Lavvaf A, Hajian E, Jaberzadeh V. The effect of different levels of poultry byproduct meal on carcass quality in broiler. Animal Veterinary Sciences 2011;1(11):697–699.
Mustafa G, Ahmed F, Yousaf I, Hyder AU. Comparative efficacy of different antioxidants on fat stability in broiler rations: TBA values. Pakistan Veterinary Journal 2002;22(2).
Mutucumarana RK, Samarasinghel K, Ranjith GWHAA, Wijeratne AW, Wickramanayake DD. Poultry offal meal as a substitute to dietary soybean meal for Japanese quails (coturnix coturnix Japonica): Assessing the maximum inclusion level and the effect of supplemental enzymes. Tropical Agricultural Research 2010;21:293–307.
NRC – National Research Council. Subcommittee on poultry nutrition, national research. 9th ed. Wasghinton: National Academy Press; 1994.
Ockerman HW, Hansen CL. Animal by product processing. Weinheim: VCH Verlagsgesellschaft; 1988.
Ozer O, Sarcoban C. The effect of butylated hydroxyinsol, ascorbic acid, and
α- tocopherol on sole quality characteristics of mechanically deboned chicken patty during freeze storage. Czech Journal of food Sciences 2010;28(2):150–160.
Pereira AS. Composition and stability of poultry fats [dissertation]. West Lafayette: Purdue University; 1975.
Pesti GM, Bakalli RI, Qiao M, Sterling KG. A comparison of eight grades of fat as broiler feed ingredients. Poultry Science Journal 2002;81(3):382– 390.
Pesti GM, Faust LO, Fuller HL, Dale NM, Benoff FH. Nutritive value of poultry byproduct meal, metabolizable energy values as influenced by method of determination and level of substitution. Poultry Science 1986;65:2258–2267.
Piette G, Hundt M, Jacques L, Lapointe M. Influence of extraction temperature on amounts and quality of rendered chicken fat recovered from ground or homogenized skin. Poultry Science 2001;80(4):496– 500.
Raja KM, Reddy PS, Reddy PVVS. Influence of poultry byproduct meal on the productive performance of layers. Indian Journal of Poultry Science 2001;36(3):297–299.
Ramzan M. Effect of different levels of Endox and fat on the quality of stored feed and performance of broiler chicks [thesis]. Faisalabad: Department Animal Nutrition; 1998.
Rhee KS. Minimization of further lipid peroxidation in the distillation 2-thiobarbituric acid test of fish and meat. Journal of Food Science 1978;43:1776–1778.
Sahraei M, Lootfollahian H, Ghanbari A. Effect of poultry byproduct meal on performance parameters, serum uric acid concentration and carcass characteristics. Iranian Journal of Applied Animal Science 2012;2(1):73–77.
Samli HE, Senkoylu N, Ozduven ML, Akyurek H, Agma A. Effects of poultry byproduct meal on laying performance, egg quality and storage stability. Pakistan Journal of Nutrition 2006;5(1):6–9.
SAS. SAS/STATE user’s guide: statistics. Version 9.1. Cary; 2002-2003.
Senkoylu HE, SamLi H, Akyurek, Agma A, Yasar S. Performance and egg characteristics of laying hens fed diets incorporated with poultry by product and feather meals. Journal of Applied Poultry Research 2005;14(3):542–547.
Sies H. Oxidative stress: oxidants and antioxidants. Experimental physiology 1997;82(2):291–295.
Silva EP, Rabello CBV, Lima MB, Ludke JV, Arruda EMF, Albino LFT. Poultry offal meal in broiler chicken feed. Scientia Agricola 2014;71(3):171– 257.
Steel RGD, Torri JH, Dicky DA. Principles and procedures of statistics, a biochemical approach. 3rd ed. New York: McGraw Hill Book; 1997.
Verma J, Johri TS, Swain BK, Ameena S. Effect of graded levels of aflatoxin, ochratoxin and their combinations on the performance and immune response of broilers. British Poultry Science 2004;45:512–518.