Universitade de Lisboa Faculdade de Medicina de Lisboa
Functional Magnetic Resonance Imaging study of Working
Memory in Obstructive Sleep Apnea Patients before and after
Treatment with Continuous Positive Airway Pressure
Olga Prilipko
Ph.D
Medicine Neurology
15 March 2011 Universidade de Lisboa Faculdade de Medicina de Lisboa
Functional Magnetic Resonance Imaging study of Working Memory
in Obstructive Sleep Apnea Patients before and after Treatment
with Continuous Positive Airway Pressure
Olga Prilipko
Thesis supervised by Prof. Teresa Paiva Prof. Christian Guilleminault
Medicine Neurology
Todas as afirmações efectuadas no presente documento são da exclusiva responsabilidade do seu autor, não cabendo qualquer responsabilidade à Faculdade de Medicina de Lisboa pelos conteúdos nele apresentados.
A impressão desta dissertação foi aprovada pelo Conselho Cientifico da Faculdade de Medicina de Lisboa em reunião de 15 Março 2011.
Acknowledgements:
A doctoral degree is a long-term undertaking of discovery of a given field of science, of its limits, and ultimately, of one’s own potential. As this work comes to completion I would like to express my deep gratitude to my mentors, colleagues, friends and family, who accompanied me along this journey.
First of all, I would like to thank Prof. Teresa Paiva for accepting me as a doctoral student and for her trust, patience and kindness during my work.
My deepest gratitude goes to Prof. Christian Guilleminault for offering me the opportunity to work on the fascinating field of Sleep at the Stanford Sleep Clinic with him, for our stimulating scientific discussions during the long commutes between San Francisco and Palo Alto, for his patience, kindness and understanding during the difficult moments and for his inextinguishable enthusiasm and love of his field and of the Human.
My heartfelt thanks go to Prof.Clete Kushida, Eileen Leary and Debee Nichols for their support and expert help at all stages of the project.
I was very fortunate to meet several wonderful people who worked on the project with me at various stages of its development and who became dear friends. My thoughts go to Nelly Huynh, who accompanied me through the biggest part of my work with her constant good mood, amazing organization and true friendship (late night scans and midnight chocolates at La Cupa will stay in my memory). I am very grateful to Ana Rita Peralta for her help, friendship, and priceless assistance with the Portuguese language as well as for the unforgettable time I was fortunate to spend with her and her family. I thank Visasiri Tantrakul for her kindness, patience and help with my work during her 2-year stay. I thank Jee Huyn Kim for her help, support and stimulating discussions at Stanford and Seoul. I am also indebted to Dr. Sophie Schwartz for her advice, expertise and friendly scientific discussions.
I would like to thank several colleagues at Stanford University who made things possible through their selfless support and advice. Prof. Gary Glover, whose invaluable help with fMRI and experiment design was crucial for the realization of this project. I thank Dr
Moriah Thomason Cairo for her precious advice and help on the experiment design as well as Dr Fumiko Hoeft and Dr Paul Mazaika for their assistance with data processing.
Finally, my constant thoughts go to my family. To the loving memory of my parents, Valentina and Leonid Prilipko, who have always believed in me and supported me. To my dear husband, Chris, who knows how to keep my feet on the ground and my heart singing.
Table of Contents
1. Obstructive Sleep Apnea (OSA)... 3
1.1 Introduction... 3
1.2 OSA and cognitive function ... 3
1.3 Continuous Positive Airway Pressure (CPAP)... 5
2. Neuroimagery... 6
2.2 Functional Magnetic Resonance Imaging (fMRI)... 6
Part 1... 10
Task Positive and Default Mode Networks during a Parametric Working Memory Task in Obstructive Sleep Apnea Patients and Healthy Controls... 10
Methods... 12
Subjects... 12
Polysomnography (PSG) ... 12
Experimental Procedure and n-Back Task ... 12
fMRI Data Acquisition ... 13
fMRI Data Analysis... 13
Results... 15
Clinical Measure and Behavioral Performance ... 15
fMRI ... 15
Part 2 ...30
The Effects of CPAP treatment on Task Positive and Default Mode Networks in Obstructive Sleep Apnea Patients...30
Methods...31
Subjects ...31
Polysomnography (PSG)...32
Experimental Proedure and n-Back Task...32
fMRI Data Acquisition...32
fMRI Data Analysis ...33
Results...34
Clinical Measure and Behavioral Performance...34
fMRI ...35 Discussion...38 Conclusions...56 References ...58
1. Obstructive Sleep Apnea (OSA)
1.1 Introduction
Obstructive sleep apnea syndrome (OSAS) refers to a breathing disorder during sleep
characterized by repeated episodes of upper airway obstruction resulting in cessation (apnea) or reduction (hypopnea) in airflow during sleep. OSAS results in recurrent hypoxic episodes during sleep, fragmented sleep, cardiovascular comorbidities, neurocognitive impairment during the day, and excessive daytime sleepiness.1-6 It is a frequent but insufficiently
recognized disorder that involves at least 2% to 4% of subjects between 30 to 60 years old
and up to 15% of the elderly population, with a 2:1 men/women ratio in Caucasians.7
The scope of this work focuses on the role of OSA in associated cognitive impairment, the investigation of neural correlates of cognitive deficits and their evolution in response to treatment.
1.2 OSA and cognitive function
It is now well recognized that OSAS is associated with cognitive impairment. Whereas there is no impact on general intelligence and verbal ability and there are inconsistent findings in
respect to impact on memory, visual and motor skills8, a consistent negative impact of OSA
is found in the literature in the realm of executive function and the ability to sustain attention for extended periods of time (vigilance) 8-10.
“Executive function” is generally defined as a high-level cognitive function that allows us to organize our thoughts in a goal-directed way, plan and perform the sequence of necessary
actions while inhibiting irrelevant information and inappropriate behaviors. Executive abilities are believed to be supported essentially by the frontal lobes11.
The domains of executive function that were most often impaired across studies of OSA
patients are working memory, phonological fluency, cognitive flexibility and planning12, 13.
In an attempt to link the physiological consequences of OSA to its behavioral and cognitive effects Beebe and Gozal have proposed a theoretical model, that attributes executive
dysfunction to disruption of normal functioning of the prefrontal cortex (PFC), secondary to adverse cellular and biochemical events triggered by sleep disruption, intermittent hypoxia
and hypercarbia in the context of OSA14.
PFC has been established as the neurological correlate of executive function with different regions of PFC linked to different aspects of executive function, such as behavioral inhibition (orbital cortex) and working memory (DLPFC) and it is also the region primarily affected in aging subjects, schizophrenic patients and in healthy subjects after total sleep deprivation, all
of whom manifest a certain degree of executive function impairment 15-22. The high
sensitivity of this brain region to the effects of sleep deprivation was well demonstrated by
several studies done on healthy volunteers 20, 23. However, even if the PFC is recognized as
the primary brain region supporting executive function, neuroimaging studies have revealed that an efficient interplay of activation and deactivation of a network of regions is necessary for optimal behavioral performance (see below). Therefore, executive dysfunction can arise not only from lesions to the PFC, but also other regions of this network, or even from a less efficient functional connectivity within it.
1.2.1 Working memory and n-back task
Working memory (WM) represents an aspect of “executive function” and is defined as an online information processing system that enables the maintenance and manipulation of information in the service of higher-order tasks, such as reasoning, planning and problem-solving24.
WM is commonly the most studied aspect of executive function in neuroimaging and
behavioral literature, often using the n-back task that requires subjects to compare the current stimulus with the one presented n-stimuli back.
The n-back paradigm requires a continuous monitoring of sequentially presented stimuli, and subjects must answer whether the current stimulus matches the stimulus occurring n positions back in the sequence. The task combines maintenance as well as active manipulation, i.e., executive processes, because of the necessity to continuously encode, update, and discard the information held in WM with the presentation of each new stimulus. The value of n is
regarded as proportional to memory load25.
Load manipulation yields information in respect to the cognitive capacity and limit thereof in the studied population. This is particularly important in situations where cognitive deficit is mild and could be masked by a ceiling effect of an easy cognitive task. It is worth mentioning that most studies in OSA patients that used an n-back task, have used 2-back as their maximal task load, which possibly did not allow to examine the limit-of-capacity domain of WM in these patients.
1.3 Continuous Positive Airway Pressure (CPAP)
Historically, the first treatments of OSA were surgical, consisting in the beginning of tracheostomy, uvulopalatopharyngoplasty (UPPP), followed in later years by maxillo-mandibular advancement. In 1981 Collin Sullivan proposed a new non-surgical treatment of OSA, which quickly became the gold standard treatment option for the majority of OSA patients.
Positive air-pressure of nasal CPAP, acting as a pneumatic splint for the nasopharangeal airway allows normalization of sleep by preventing airway collapse secondary to sleep-induced decrease of muscle tonus of pharyngeal walls and base of the tongue.
It is well established that CPAP treatment significantly improves daytime sleepiness, quality of life and several aspects of cognitive function in OSA patients. However, it now appears
that even the most optimally treated and compliant patients with OSA may not experience a
complete reversal of daytime symptoms and functional abnormalities26. Moreover, some
aspects of cognitive impairment, such as executive function, seem to be less reversible than others. This observation led to the hypothesis that OSA patients sustain permanent cellular damage, possibly due to repetitive hypoxic injury, which is supported by recent results of volumetric studies.
Most studies assessing the efficacy of CPAP on cognition have been conducted using behavioral measures as their outcome. However, little could be inferred about the
neurological substrate of the observed deficits until behavioral performance was coupled with neuroimagery.
2. Neuroimagery
A number of neuroimaging studies have been conducted in OSA patients in order to uncover the particularities of brain metabolism (Positron Emission Tomography studies) and brain
structure (spectroscopy, Voxel Based Morphometry studies)27.
In the current work we are going to focus on Functional Magnetic Resonance Imaging (fMRI) studies that allow the investigation of neural correlates of the behavioral performance during a given cognitive task with a high spatial and temporal resolution.
2.2 Functional Magnetic Resonance Imaging (fMRI)
BOLD (Blood Oxygenation Level Dependent) fMRI is a relatively new imaging technique that enables non-invasive investigation of brain function by detecting changes in the magnetic susceptibility of blood28.
Neural processes related to a given cognitive task require an increase in neuronal metabolism with increased demand for energy consumption. Vascular response to this demand in the
brain has the particularity of a disproportional increase of local cerebral blood flow in respect to the metabolic demand, leading to a local shift in the relationship of oxygenated to
deoxygenated hemoglobin towards an increase of oxygenated hemoglobin. BOLD fMRI is based on the detection of changes in magnetic signal related to changes in deoxyhemoglobin concentration in the small vessels supplying the brain region involved in a given cognitive task. Therefore, whereas BOLD fMRI represents a non-invasive and safe technique for investigation of neuronal processes, it is important to account for the fact that it does so indirectly, by looking at vascular changes related to neuronal changes, and is thus susceptible to conditions that can introduce vascular confounds.
fMRI studies of WM in healthy volunteers have established a network of brain regions activated during WM tasks, consistent mostly of fronto-parietal regions and referred to as Task Positive Network (TPN). More recently, research has started to focus on a network of regions that exhibits a progressive deactivation during performance of cognitive tasks, the Task-Induced Deactivation Network. The Task-Induced Deactivation Network has been shown to consist of the same brain regions as the functionally connected resting state Default Mode Network (DMN), which is anti-correlated with the TPN and plays a crucial role for optimal behavioral performance. Since Task-Induced Deactivation Network and the DMN consist of the same brain regions and represent the same functional entity, in this work we shall refer to task-induced deactivation regions as the DMN.
To date, 3 neuroimaging studies have examined aspects of executive function in OSA patients, with varying results. Patterns of reduced or increased brain activation have been reported in association with decreased or comparable behavioral performance relative to that
of healthy controls.29-32 However, most of the interest has been directed at the network of
brain regions known to be consistently activated during sustained attention and performance of cognitive tasks and referred to as the task positive network (TPN), which comprise a set of frontal and parietal cortical regions.33, 34
In particular, the dorsolateral prefrontal cortex (DLPFC) is known to be a key region for performance of executive function tasks but is also the region primarily affected in aging subjects, schizophrenic patients, and in healthy subjects after total sleep deprivation, all of
this brain region to the effects of sleep deprivation was well demonstrated by several studies
done on healthy volunteers,20, 23 making the DLPFC a region of special interest in
cognition-related research in OSA patients.
However, there is increasing evidence that examination of activation in TPN alone does not yield a comprehensive view of cerebral response to cognitive demand. Contrary to TPN, it has been demonstrated that a set of brain regions referred to as the default mode network (DMN), comprising medial prefrontal, posterior cingulate, anterior temporal and lateral parietal cortices, exhibits tonic activation at rest and responds with progressive deactivation
as the brain engages into a goal-directed activity.35, 36 There is growing evidence that DMN
plays a key role in enabling optimal cognitive functioning and that DMN dysfunction, as well as DMN versus TPN anti-correlation imbalance, are associated with cognitive performance
impairment.37 Several studies demonstrate that both networks and their reciprocal
relationship contribute to the behavioral deficits observed in several pathological conditions as well as normal aging.
In OSAS patients, repetitive hypoxia and repetitive disruption of sleep associated with sleep disordered breathing have been considered as potential factors in induction of cognitive deficit; however, given their simultaneous occurrence, teasing apart the degree to which each of those factors influences cognition as well as what aspects of cognition are preferentially influenced by which OSAS factor is a challenge. Obesity is known to be associated with OSA, and the complex syndrome involving both abdominal obesity and OSA may lead to the metabolic syndrome (MetS), which comprises insulin resistance, central obesity, HTN,
glucose intolerance, and dyslipidemia.38, 39 Several components of MetS are also associated
with cognitive dysfunction. In particular, there is increasing evidence that obesity as expressed by the body mass index (BMI) is associated with cognitive impairment and is a
risk factor for developing dementia.40-42 Since sleep fragmentation, intermittent hypoxia, and
obesity are all factors commonly associated with OSA, it is likely that each of those factors has an impact on cognitive function of OSA patients and that their association may have a synergistic effect.
related (TPN) and deactivation related (DMN) networks and examine the independent contributions of sleep fragmentation (SF), intermittent hypoxia (IH), and BMI on brain activation of untreated patients with OSAS during the performance of a parametric working memory (WM) task in respect to both TPN and DMN.
Part 1
Task Positive and Default Mode Networks during a Parametric
Working Memory Task in Obstructive Sleep Apnea Patients
and Healthy Controls
Part 1
Task Positive and Default Mode Networks during a Parametric Working
Memory Task in Obstructive Sleep Apnea Patients and Healthy Controls
The aims of the first part of this study were: (a) to examine the behavioral performance and the underlying brain activation and deactivation patterns in TPN- and DMN-related regions of a sample of untreated OSA patients on a parametric WM n-back task including a limit-of-capacity 3-back level with functional magnetic resonance imaging (fMRI); (b) to compare these patterns to findings in a matched group of healthy controls (HC); and (c) to examine the possible correlations between SF, IH, and BMI and brain activation in TPN and DMN. Based on results of previous literature, we hypothesized that:
a) OSA patients will have larger areas of activation in the TPN than HC (spatial recruitment) in order to compensate for a possibly impaired function of the TPN, which would be manifested by higher BOLD signal in HC than in OSA patients in the TPN regions.
b) OSA patients will have larger areas of deactivation in the DMN (compensatory spatial recruitment) as compared to HC in order to compensate for possibly
ineffective deactivation of DMN, which would be manifested by higher BOLD signal in OSA patients than in HC in the DMN regions.
Methods
Subjects
Seventeen men diagnosed with moderate to severe OSAS were recruited from the Stanford Sleep Clinic and surrounding area via advertisement. All participants were right-handed nonsmokers and were screened for current or previous neurological and psychiatric disorder as determined by history, clinical evaluation, and Hamilton Depression Scale score. All participants reported regular sleep schedules with ≥6 h of sleep per night as determined by sleep habits questionnaires. Seven age-matched subjects without history of sleep disorders were recruited from the community as HC; and absence of sleep pathology, including sleep disordered breathing (SDB), was confirmed by an overnight polysomnography (PSG: AHI <5) (Table 1).
The study was approved by the Stanford Institutional Review Board, and all subjects signed informed consent.
Polysomnography (PSG)
Overnight PSGs were performed in all subjects. The following variables were systematically monitored: EEG, electro-oculogram, electrocardiogram, chin and leg myogram, nasal air flow with nasal cannula, abdominal and thoracic respiratory movements with piezo-electrical belts, and pulse oximetry. Studies were scored by independent technicians and reviewed by a qualified sleep medicine physician according to the AASM scoring criteria.
Experimental Procedure and n-Back Task
All subjects were instructed to abstain from ingestion of any caffeinated beverages ≥9 h prior to scanning.
During the fMRI session, participants performed 2 sessions of visuospatial n-back task that was generated with E-Prime 1.0 software and visually projected on a mirror in front of the
subject’s eyes. They performed two 9 min 40 sec sessions of a block-designed parametric n-back task with 4 levels of difficulty (0-n-back, 1-n-back, 2-n-back, and 3-n-back). Each session comprised 2 blocks of each WM condition (1-, 2-, and 3-back) of 63 sec duration, separated by 5 blocks of the baseline condition (0-back) of 25.2 sec duration each (0-1-0-2-0-3-0-1-0-2-0-3). During the task, a white dot flashed for 200 ms in 6 pseudo-random locations on a black screen. Fifty percent of stimuli were matches.
Subjects were instructed to respond with their right hand (index finger for matches and middle finger for mismatch) whether the dot appeared on the left or on the right side of the screen in the 0-back condition, or whether each given dot appeared in the same or different location as the dot n-dots before for the 1-, 2-, and 3-back conditions, respectively. Subjects’ responses during the n-back sessions and their response times (RT) in the scan were recorded via a custom-made response box in E-Prime Data Aid software.
fMRI Data Acquisition
Functional MRI data was acquired on a 3.0T GE (Milwaukee, WI) whole-body scanner with a custom quadrature bird-cage head coil. Head movement was minimized with foam padding. Thirty oblique axial slices were taken parallel to the anterior/ posterior commissure plane (AC-PC) with 4-mm slice thickness, 1-mm interslice gap. High resolution T2 weighted fast spin echo structural images were acquired for anatomical reference. A T2*-sensitive gradient
echo spiral in/out pulse sequence43 was used for functional imaging (TR = 2000 ms, TE = 30
msec, flip angle = 70, FOV = 24 cm, matrix = 64 x 64). An automated high-order shimming
procedure based on spiral acquisitions was used to reduce B0 heterogeneity.44 A high
resolution T1 volume scan (124 slices, 1.2-mm thickness) was collected for every subject using an IR-prep FSPGR sequence for T1 contrast.
fMRI Data Analysis
Functional MRI data were preprocessed and analyzed using Statistical Parametric Mapping software (Welcome Department of Cognitive Neurology, London) and custom MATLAB
routines (MathWorks Natick, MA). The preprocessing steps consisted of realignment of all images to the first image, normalization to MNI template, and spatial smoothing with a Gaussian filter of 6 mm full-width-half-maximum.
To test for the effect of each task load, we used a standard general linear approach with 4 regressors for the 3 task load and baseline conditions, modeled as a boxcar function convolved with the canonical HRF. The 6 motion parameters from the realignment were added as 6 regressors of no interest. Statistical analysis at the single-subject level treated each
voxel according to a general linear model.45 Individual contrast images were created by
computing each WM task load versus the 0-back load baseline (1 > 0, 2 > 0, 3 > 0). OSA and HC groups were then compared for each WM task load by entering individual contrast images in a 2-sample t-test. For each of the 3 main contrasts, we also used an ANOVA and performed an exclusive masking procedure to reveal any voxel significantly activated in one group but not in the other group (Fig. 1).
In order to minimize the type I error, a cluster threshold method was used,46 requiring that
any given voxel be significantly activated at P level of 0.001 and be a part of a cluster of ≥10 contiguous significantly activated voxels.
To test for correlation of a general task load effect with clinical measures, we performed a second analysis on the patient dataset using a multiple regression approach. We first designed a parametric model where all task blocks were modelled as one single regressor, with 2 additional regressors modeling a linear modulation of the task-related activity by load level (1-, 2-, and 3-back), a quadratic modulation of the task-related activity by load level, and 7 regressors of no interest (behavioral performance per task block and 6 motion correction parameters). Contrast images generated by the linear load regressor from each subject
entered the multiple regression group analysis with AHI, time spent under 90% SpO2
(minutes), and BMI as covariates. These analyses were performed on the data from the OSA patients only.
Results
Clinical Measure and Behavioral Performance
For 17 OSA patients, the mean AHI was 39.7 (±22.8), the mean Epworth score was 7.3 (±4),
and the mean BMI was 27.8 (±4) kg/m2. Mean minimal nocturnal oxygen saturation was
87.8% (±8.9%). Details of sleep quality and sleep stages are reported in Table 1.
During scanning subjects’ accuracy decreased and response time increased with increasing n-back load. There was no difference in RT between OSA patients and HC on any level of the task load. OSA patients performed significantly worse than HC on the 3-back (79% versus 89% correct, P = 0.005), but there was no significant difference in performance for the other levels of task load (Table 2). Significant negative correlation between BMI and behavioral performance was found at the 3-back level (r = −0.7).
In order to exclude an influence of sleepiness on brain activation and performance, we examined a possible relationship between RT during the 0-back epochs throughout both sessions of the n-back task with task duration. There was no correlation between RT and task duration for either session.
fMRI
Working Memory Load
Comparing activity during each WM load versus baseline revealed 2 distinct networks. Significant activations were found in several brain regions previously described to be involved in WM processing in other fMRI studies using n-back tasks. Those included bilateral SMA, bilateral DLPFC, anterior cingulate cortex (ACC), and parietal cortex bilaterally.
On the other hand, significant deactivations with increasing load were found in the medial PFC, posterior cingulate cortex, bilateral insular and hippocampal cortex (DMN).
Both activation and deactivation networks showed a progressively marked pattern with increasing task load (Fig. 3).
Comparison between OSA Patients and Healthy Controls
For the 1-back versus baseline comparison, significantly higher activation was found in HC than in OSA patients in bilateral parahippocampal regions, right insula, bilateral claustrum, left precentral gyrus (BA 4), and right precuneus (BA 7) (Fig. 2A, Table 3). Significantly higher activation was found in the left temporo-occipital area (BA19) in OSA patients than in HC.
For the 2-back versus baseline comparison, HC had higher activation than OSA patients in right precentral (BA 44) and left middle frontal gyrus (BA 10), whereas OSA patients had higher activation in bilateral temporal (BA 37) and left occipital (BA 17) regions (Fig. 2B, Table 2).
In the 3-back versus baseline comparison, HC had higher activation than OSA patients in right precentral gyrus (BA 44), whereas OSA patients had higher activations in the left middle frontal (BA 8) region (Fig. 2C, Table 2).
Using exclusive masking of WM activated regions in OSA patients by activation in HC, we found a higher number of activated regions in OSA group at both 2- and 3- versus 0-back loads, with maximal effect at the highest difficulty level (3- vs 0-back) in TPN-related regions (Fig. 3A). DMN pattern showed a different pattern with higher number of
deactivated regions in OSA patients as compared to HC in the 1 and 2- vs 0-back comparison and a recruitment of a different set of deactivated regions in HC at the 3- vs 0-back
comparison, consisting of bilateral occipital (cuneus) and temporal regions (BA 21)(Fig. 3B)
At the 3-back level, OSA patients still showed more widespread DMN recruitment in the bilateral insulas, anterior and posterior midline and posterior parahippocampal regions as compared to HC.
Multiple Regression Analysis
Multiple regression analysis yielded significant positive correlation between AHI and brain activation across WM task loads in the left and right frontal regions (L BA 6, 10, R BA 10) (Fig. 2A, Table 4).
We found a positive correlation between brain activation across WM task loads and sleep
time spent under 90% SpO2 in bilateral inferior frontal lobe regions (BA 47), right medial
frontal gyrus (BA 11), right anterior and bilateral posterior cingulate (R BA 24, L BA 23, 29), left subcallosal gyrus (BA 25), left precentral region (BA 6), bilateral temporal poles (BA 38), right parahippocampal gyrus (BA 34), bilateral occipital regions (L BA 18, R BA 31), and left cerebellar regions (culmen). Negative correlation was found in the bilateral frontal (L BA 6, R BA 8) and left parietal lobes (BA 2, 7) (Fig. 2B, Table 4).
Significant negative correlations have been found for BMI in left frontal cortex (BA 10), right temporal (BA 42), left claustrum, bilateral occipital (BA 18, 19), and cerebellar regions. There was no positive correlation between BMI and brain activation across the WM task loads.
Discussion
Recent research on task positive and default mode networks in the human brain indicates that dysfunction of both those networks, as well as the imbalance of the antagonistic relationship between them, can lead to behavioral impairment and are in fact observed in several
conditions associated with cognitive deficit, such as normal aging, Alzheimer disease,
schizophrenia, ADHD, and depression.47 In particular, it has been shown that the extent of
task-related deactivations in the DMN could differentiate between subjects with mild cognitive impairment, Alzheimer disease, and healthy controls, with lesser deactivation in
MCI than healthy controls and in Alzheimer patients than in MCI.48 Furthermore, Lawrence
et al have demonstrated that good behavioral performance on a sustained attention/WM task can arise from stronger activation in the TPN, stronger deactivation in the DMN, or a mixture of strong levels of activation and deactivation.49
In our study, both groups demonstrated a progressive increase of spatial recruitment of regions within and adjacent to the TPN from 1- to 3-back level of task, probably reflecting a continuous compensatory effort, with a larger recruitment in OSA subjects as compared to HC. However, the groups differed in the task-related deactivation of the DMN with more widespread deactivation (DMN spatial recruitment) in OSA than in HC at the 1 and 2-back level and a different pattern of compensatory recruitment in the two groups at the 3-back level, in spite of a continuous spatial recruitment of DMN regions in both groups with increasing load (Fig. 3).
Therefore, significantly worse behavioral performance of OSA patients at the 3-back level appears to be related more to a different pattern of recruitment and deactivation of DMN-related regions than a defective TPN.
Our finding of positive correlation between cerebral activation during the n-back task and the measure of nocturnal desaturation in a number of regions of and adjacent to the DMN
(particularly in bilateral temporal poles and mesial temporal regions) suggests intermittent hypoxia to be a major factor for the DMN dysfunction in OSA patients. IH was also found to have a negative impact on TPN regions, with a negative correlation between IH and cerebral activation in bilateral frontal and left parietal regions.
Defective deactivation of a network of brain regions commonly more active during rest than during a cognitive task (DMN) has been demonstrated to be related to worse behavioral performance in a number of conditions associated with cognitive impairment and sleep disturbances (normal aging, Parkinson disease, schizophrenia, ADHD), suggesting that inability to reallocate neuronal resources and suppress activity in neighboring regions plays a
role in cognitive impairment.50-53 Disruption of task-related deactivation within the midline
regions of DMN has been reported after acute sleep deprivation,54 and slower reaction times
on a psychomotor vigilance task have also been associated with increased activation in
midline DMN regions after total sleep deprivation,55 suggesting that sleep deprivation has a
direct impact on DMN. Similarly, reduced deactivation in the posterior regions of DMN has been shown to be related to attentional lapses in healthy subjects.56 In regard to those
together withthe absence of changes in reaction times suggests that sleep deprivation is not the mechanism that dysregulates DMN in OSA patients.
We found significantly increased brain activation in HC as compared to OSA patients in several regions of the limbic system at the 1- versus 0-back comparison. The analysis of parameter estimates trend revealed a peak of BOLD signal at 1-back in HC that is absent in OSA patients. Several of those brain regions are known to be implicated in emotional and
autonomic nervous system control.57-60 It is well established that OSAS is associated with
autonomic nervous system dysfunction.61, 62 Therefore, we believe that the observed
difference in activation reflects a blunted autonomic response in OSA patients. Indeed, the design of our task means that each session began with the 1-back task as the first load block (see Methods), clearly enhancing the risk of task-related stress due to the new situation during this test. This proposition is further supported by a re-analysis of data that considered only the second part of each session, in which there was no difference between patients and HC in those regions. Further studies including autonomic nervous system measures are needed in order to evaluate more in depth this specific aspect of the testing situation.
Finally, more and more attention is being directed to the effect of obesity per se on cognitive function, as it has been shown that excess body weight is associated with brain structural and functional alterations63 and a higher risk of developing dementia in later life.40 Higher BMI was found to be associated with hypometabolism as well as reduced NAA/Cho ratio of the prefrontal and cingulated regions.64, 65 Behaviorally, several studies find a significant
relationship between high BMI and cognitive dysfunction in otherwise healthy adults or after controlling for BP, age, and diabetes.40, 41, 66 Since obesity is strongly associated with OSA
due to patient recruitment, it is important to examine the independent effect of BMI on cognitive function of OSA patients and to systematically account for its effect in cognition studies in these subjects. Our results are in line with previous literature, as we found only negative correlations between BMI and brain activation during the WM task in a number of brain regions of the TPN, in particular in bilateral DLPFC and occipital and cerebellar regions. Not surprisingly, BMI and desaturation time were significantly correlated in our sample, hence using a multiple regression model allowed us to tease apart their independent influence on cerebral activation during the WM task. However, despite the significant
correlation between BMI and desaturation time, only BMI was significantly negatively correlated with behavioral performance at the limit-of-capacity level of task (3-back), suggesting that BMI has a more deleterious role on WM function in OSA than sleep fragmentation and nocturnal desaturation. This finding and the fact that only negative correlations were found between BMI and cerebral activation suggests that BMI has a structural impact on the grey matter of the TPN. Thus, further studies are needed to
investigate the independent impact of BMI and the effect of obesity treatment on cognitive function in OSA.
Several neuroimaging studies have previously investigated executive function aspects in OSA patients. Thomas et al reported a decreased brain activation in anterior cingulate, bilateral DLPFC, and posterior parietal regions in OSA patients during the performance of a 2-back verbal task, which paralleled a significantly worse behavioral performance as
compared to healthy controls.29 Ayalon et al, using a Go-no-Go task, reported a decreased
cerebral activation in several regions typically involved in attentional tasks in patients compared to controls, whereas there was no significant difference in behavioral performance and response time between the two groups for the Go versus rest (although there was a trend
towards worse performance in patients for the No-go versus rest comparison).30, 31
Castronovo et al have reported an increased activation in OSA patients versus HC in left frontal regions, precuneus, putamen, hippocampus, and cerebellum, as well as decreased activation in brainstem, left occipital, and right orbital regions at similar behavioral
performance at a 2-back task.32
Our study differs from previous studies on several points: (a) it considers a visuospatial (and not a verbal) n-back task, (b) it involves 4 levels of difficulty, and (c) it examines BOLD signal changes in not only the TPN but also the DMN regions. It is therefore more difficult to draw direct comparisons between our results and results of previous studies. However, similar to previous studies we found an increase in spatial recruitment of TPN, in particular of the left hemisphere, in OSA patients as compared to HC, as well as a decrease in
activation in frontal regions involved in WM function, particularly at more difficult task levels. Moreover, Castronovo et al have reported an increased activation in the precuneus in
their OSA group, which partly corroborates our results of decreased deactivation in posterior regions of DMN.
Our study has limitations: we have examined only male subjects, as controversy exists about gender effects on brain activation during cognitive performance; therefore our results cannot be extended to female OSA patients. Our patient and HC groups also significantly differed in the average of years of schooling, introducing the question of contribution of intelligence level (when based on years of schooling) to the observed behavioral and neuronal
differences. We believe however that this bias is not as important as it seems: although statistically significant, the schooling difference between the groups was small, and both groups had a high educational level (mean of 16.5 and 18.9 years). Having a more reliable measure of fluid intelligence than the education level would be certainly more relevant. Whereas the design of our task demanded an alternation between four task levels—the 1-, 2-, and 3-back blocks having a duration of 1 min for a total of 4 min on each task level per patient not allowing observation of potential effects due to a long time-on-task—it enabled us to include a limit-of-capacity 3-back level in our parametric design, requesting more effort from patients and HC. As our primary interest was the difference in WM function, shorter block duration gave us the advantage of not having the confounding effect of fatigue, typically seen in sleep deprived subject in designs with long time-on-task blocks. But the fixed order of increasing load difficulty in our task design, while likely enabling us to uncover a different trend of response to stress between the two groups, may have masked more WM-related effects at the low-load level. We believe that differences in task designs between various studies, although making the result comparison more difficult, yield complementary information on brain function in OSAS.
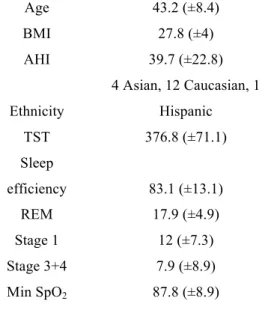
Table 1: Sample characteristics Age 43.2 (±8.4) BMI 27.8 (±4) AHI 39.7 (±22.8) Ethnicity 4 Asian, 12 Caucasian, 1 Hispanic TST 376.8 (±71.1) Sleep efficiency 83.1 (±13.1) REM 17.9 (±4.9) Stage 1 12 (±7.3) Stage 3+4 7.9 (±8.9) Min SpO2 87.8 (±8.9)
BMI = body mass index, AHI = apnea hypopnea index, TST = total sleep time Table 2: Behavioral performance in OSA patients and HC
OSA patients HC P value Accuracy 0-back 99 (±2.5) 99.5 (±0.8) 0.5 RT 0-back 466.9 (±125.6) 446.2 (±117.5) 0.7 Accuracy 1-back 96.7 (±4.7) 96.3 (±4.3) 0.9 RT 1-back 762.7 (±167) 671.3 (±182.8) 0.3 Accuracy 2-back 91.4 (±6.8) 93.6 (±5.3) 0.4 RT 2-back 984.6 (±318.2) 806.8 (±274.2) 0.19 Accuracy 3-back 78.9 (±10.6) 89 (±5.2) 0.005 RT 3-back 1197.1 (±322) 992.1 (±239.6) 0.1
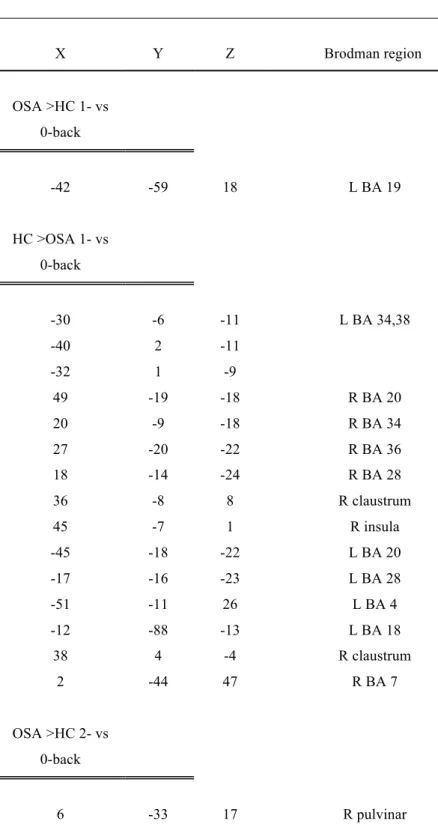
Table 3: Talairach coordinates of brain regions showing significant differences in cerebral activation between OSA patients and healthy controls (t-test analysis)
X Y Z Brodman region OSA >HC 1- vs 0-back -42 -59 18 L BA 19 HC >OSA 1- vs 0-back -30 -6 -11 L BA 34,38 -40 2 -11 -32 1 -9 49 -19 -18 R BA 20 20 -9 -18 R BA 34 27 -20 -22 R BA 36 18 -14 -24 R BA 28 36 -8 8 R claustrum 45 -7 1 R insula -45 -18 -22 L BA 20 -17 -16 -23 L BA 28 -51 -11 26 L BA 4 -12 -88 -13 L BA 18 38 4 -4 R claustrum 2 -44 47 R BA 7 OSA >HC 2- vs 0-back 6 -33 17 R pulvinar
51 -50 -9 R BA 37 -44 -49 -8 L BA 37 -12 -95 -3 L BA 17 HC >OSA 2- vs 0-back -38 39 9 L BA 10 51 3 13 R BA 44 OSA >HC 3- vs 0-back -27 -76 -5 L BA 19 -35 18 38 L BA 8 HC >OSA 3- vs 0-back 56 7 11 R BA 44
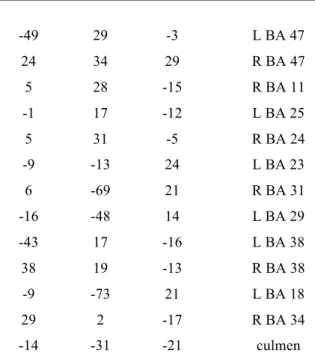
Table 4: Talairach coordinates of brain regions showing significant correlation with AHI, desaturation time, BMI, and cerebral activation during the WM task
X Y Z Brodman region
Positive correlations with AHI
-32 37 9 L BA 10
-57 -2 27 L BA 6
38 43 7 R BA 10
Negative correlations with AHI
-16 -30 -19 culmen
Positive correlations with Desaturation Time
-49 29 -3 L BA 47 24 34 29 R BA 47 5 28 -15 R BA 11 -1 17 -12 L BA 25 5 31 -5 R BA 24 -9 -13 24 L BA 23 6 -69 21 R BA 31 -16 -48 14 L BA 29 -43 17 -16 L BA 38 38 19 -13 R BA 38 -9 -73 21 L BA 18 29 2 -17 R BA 34 -14 -31 -21 culmen
Negative correlations with Desaturation Time
45 11 42 R BA 8
-29 -50 39 L BA 7
-48 -16 48 L BA 2
Negative correlations with BMI
-29 50 12 L BA 10 60 -13 14 R BA 42 -11 -73 21 L BA 18 -23 -50 -3 L BA 19 19 -52 0 R BA 19 -34 -12 -5 L claustrum 29 2 -18 R BA 34 -23 -34 -28 L cerebellum -19 -39 -23 L cerebellum 20 -33 -26 R cerebellum 23 -38 -30 R cerebellum
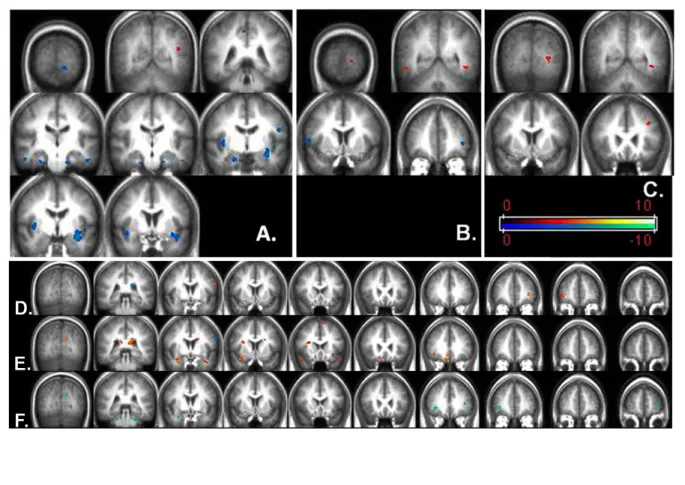
Figure 1: Spatial recruitment of A: TPN in OSA patients after exclusive masking by brain activation of the HC group (left) and spatial recruitment of TPN in HC after exclusive masking by brain activation of OSA group (right); B: DMN in OSA patients after exclusive masking by brain deactivation of the HC group (left) and spatial recruitment of DMN in HC after exclusive masking by brain deactivation of OSA group (right). Exclusive masking (p=0.05), FDR correction for multiple comparisons (p=0.05).
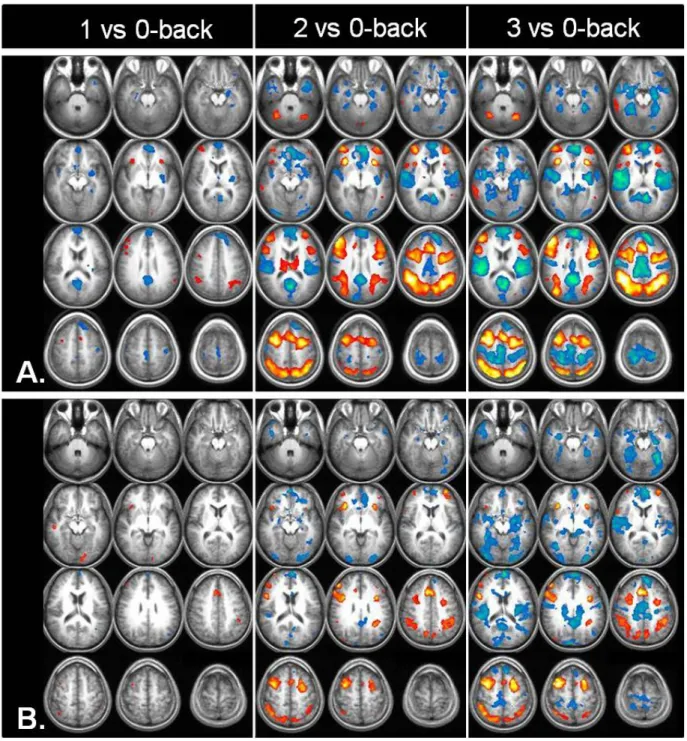
Fig. 2: Brain regions significantly higher activated in HC compared to OSA patients in cold scheme; brain regions significantly higher activated in OSA patients as compared to HC in warm color scheme. A: 1- versus 0-back comparison, B: 2- versus 0-back comparison, C: 3- versus 0-back comparison. Correlations between cerebral activation during WM task in OSA patients and D: AHI, E: nocturnal desaturation time (min), F: BMI. Images presented in radiologic convention.
Fig. 3: Cerebral activation (warm color scheme) and deactivation (cold color scheme) in A: OSA patients and B: healthy controls for 1-, 2-, and 3 versus 0-back contrasts.
Part 2
The Effects of CPAP treatment on Task Positive and Default
Mode Networks in Obstructive Sleep Apnea Patients
Part 2
The Effects of CPAP treatment on Task Positive and Default Mode
Networks in Obstructive Sleep Apnea Patients: an fMRI Study
The aim of the second part of this study was to investigate both cerebral activation and deactivation patterns in response to a visuo-spatial parametric working memory (WM) task (executive function) in patients with moderate to severe OSA before and after CPAP treatment in a randomized, sub-therapeutic CPAP (sham)-group controlled fashion, and to compare it to the response of healthy controls.
Methods
Subjects
Seventeen men diagnosed with moderate to severe OSAS were recruited from the Stanford Sleep Clinic and surrounding area via advertisement. All participants were right-handed nonsmokers and were screened for current or previous neurological and psychiatric disorder as determined by history, clinical evaluation, and Hamilton Depression Scale score. All participants reported regular sleep schedules with ≥6 h of sleep per night as determined by sleep habits questionnaires. Seven age-matched subjects without history of sleep disorders were recruited from the community as HC; and absence of sleep pathology, including sleep disordered breathing (SDB), was confirmed by an overnight polysomnography (PSG: AHI <5).
Patients who were confirmed to have OSA on diagnostic PSG were randomly assigned to either the active (therapeutic) or sham (sub-therapeutic) nasal CPAP group. A CPAP titration study was conducted for patients in both groups, during which active group subjects were effectively titrated and sham group subjects slept with the sub-therapeutic nasal CPAP. The sham-CPAP device closely simulated the airflow through the exhalation port and the operating noise of the active-CPAP device. Prior study using a functionally similar sham-CPAP device revealed that oxygen saturation, end-tidal CO2, and mean temperature and humidity measured at the CPAP mask were the same
with active versus sham-CPAP67. No significant difference was found in sleep parameters or
the number of abnormal respiratory events between the sham-CPAP group and a
no-treatment group in 10 men with OSA. Subjects in both groups were treated for 2 months and treatment compliance was monitored using Encore® Pro Smart Card® system. At the end of the treatment period, sham-CPAP group subjects underwent a second CPAP titration night and left the study with therapeutic CPAP treatment.
The study was approved by the Stanford Institutional Review Board, and all subjects signed informed consent.
Polysomnography (PSG)
See Methods Part 1
Experimental Proedure and n-Back Task
See Methods Part 1 .
fMRI Data Acquisition
fMRI Data Analysis
Functional MRI data were preprocessed and analyzed using Statistical Parametric Mapping software (Welcome Department of Cognitive Neurology, London) and custom MATLAB routines (MathWorks Natick, MA). The preprocessing steps consisted of realignment of all images to the first image, normalization to MNI template, and spatial smoothing with a Gaussian filter of 6 mm full-width-half-maximum.
To test for the effect of each task load, we used a standard general linear approach with 4 regressors for the 3 task load and baseline conditions, modeled as a boxcar function convolved with the canonical HRF. The 6 motion parameters from the realignment were added as 6 regressors of no interest. Statistical analysis at the single-subject level treated each
voxel according to a general linear model.45 Individual contrast images were created by
computing each WM task load versus the 0-back load baseline (1 > 0, 2 > 0, 3 > 0). For group analysis, for each of the 3 main contrasts a one-sample T-test was used for each group and an exclusive masking procedure was performed on baseline and post-treatment sessions to reveal any voxel significantly activated in one but not in the other session.
We also designed a parametric model where all task blocks were modeled as one single regressor, with 2 additional regressors modeling a linear modulation of the task-related activity by load level (1-, 2-, and 3-back), a quadratic modulation of the task-related activity by load level, and 6 regressors of no interest (behavioral performance per task block and 6 motion correction parameters).
Individual contrast images obtained from linear modulation of the parametric analysis were used in a paired t-test to compare baseline and post-treatment scans for sham and active CPAP groups. Full factorial analysis was used to examine the group x scan interaction. OSA and HC groups were compared for the 3 main contrasts (1 vs 0-back, 2 vs 0-back and 3 vs 0-back) using an exclusive masking procedure to reveal voxels significantly activated in one but not in the other group.
In order to minimize the type I error, a cluster threshold method was used,46 requiring that any given voxel be significantly activated at P level of 0.001 and be a part of a cluster of ≥10 contiguous significantly activated voxels.
Results
Clinical Measure and Behavioral Performance
Baseline patient data
For 17 OSA patients, the mean AHI was 39.7 (±22.8), the mean Epworth score was 7.3 (±4),
and the mean BMI was 27.8 (±4) kg/m2. Mean minimal nocturnal oxygen saturation was
87.8% (±8.9%). Details of sleep quality and sleep stages are reported in Table 5. There was no significant difference between sham and active-treatment groups in AHI, duration of nocturnal desaturation or performance. There was a significant difference in BMI (p=0.01) between the 2 patients’ groups (29.9+/-4.2 for active and 25.4+/-2.1 for sham).
Behavioral performance at baseline and post-treatment
During scanning subjects’ accuracy decreased and response time increased with increasing n-back load. There was a significant group x session interaction between active and sham CPAP groups for RT on 3-back load (p=0.023). Active CPAP OSA patients’ group performed significantly worse than HC on the 3-back, both before (75.2% vs 89% correct, p=0.002) and after CPAP treatment, even if a trend for improvement after treatment was observed (78.7% versus 89% correct, P = 0.04). However, the significantly worse
performance at 2-back before treatment got significantly better after CPAP treatment. There was no significant difference in performance for the other levels of task load (Table 6).
In order to exclude an influence of sleepiness on brain activation and performance, we examined a possible relationship between RT during the 0-back epochs throughout both sessions of the n-back task with task duration. There was no correlation between RT and task duration for either session.
fMRI
Categorical analysis
The activation/deactivation patterns in our HC group mobilized cerebral regions previously described to be involved during performance of WM tasks. In line with previous studies both activation and deactivation increased with increasing task difficulty in all groups. Activation was maximal at the 2-back level and deactivation at the 3-back level in the HC group, suggesting that TPN is more capacity constrained than DMN. In patient groups TPN
activation was relatively comparable for 2 and 3-back, but inferior to that of HC at 2-back in a number of frontal and parietal regions, particularly DLPFC. We used the
activation/deactivation pattern of our HC as our reference frame of comparison for TPN and DMN activity in our OSA patients.
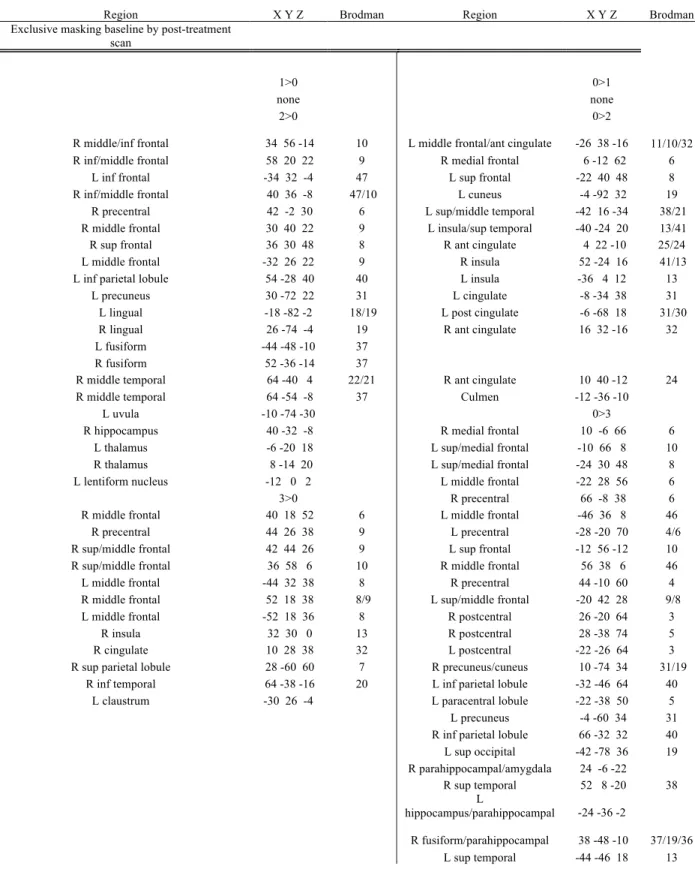
Sham-treatment group baseline scan exclusively masked with post-treatment scan
Exclusive masking of activation of baseline scan by the post-treatment scan in sham-CPAP group revealed activation in left cuneus (BA 18), right inferior temporal gyrus (BA 37) and right inferior frontal gyrus (BA 47) for the 1>0 contrast; left hippocamal/parahippocampal region, left fusiform gyrus (BA 37), and right middle temporal gyrus (BA 21) for the 2>0 contrast; right frontal (BA 8,9,10), left frontal (BA 6,46), right inferior parietal lobule (BA 40), right superior temporal gyrus (BA 39) and left insula (BA 13) for the 3>0 contrast (Table 7).
Deactivation was found in the right amygdale/uncus (BA 36) for the 1>0 contrast; bilateral superior temporal gyri (BA 38), left anterior and posterior cingulate gyrus (BA 25, 30), left inferior frontal gyrus (BA 47), left inferior temporal gyrus (BA 20) for the 2>0 contrast;
bilateral parietal (BA 5,7), bilateral amygdalas, right uncus (BA 34), right parahippocampal gyrus (BA 27, 30), medial frontal (BA 6,9), left medial frontal (BA 6), left precentral (BA 4), bilateral cerebellar regions, bilateral lingual gyri (BA 17, 18), right cuneus (BA 18), right fusiform gyrus (BA 19), right cingulate (BA 25, 31), bilateral posterior cingulate (BA 29, 30), right superior temporal (BA 38) for the 3>0 contrast (Fig. 4a).
Sham-treatment group post -treatment scan exclusively masked with baseline scan
Activation was found in bilateral superior frontal gyri (BA 6), right middle frontal gyrus (BA 8), left superior frontal gyrus (BA 9,10), left precuneus (BA 7), bilateral cerebellar regions, periaqueductal grey and tectum in 1>0 contrast; left precentral, superior, and middle frontal gyri (BA 6,8,9), right precentral gyrus (BA 4), left middle temporal gyrus (BA 20), bilateral precuneus (R BA 31, L BA 7), left postcentral gyrus (BA 3) for 2>0 contrast; right medial frontal gyrus (BA 10) and right precuneus (BA 7) for 3>0 contrast.
Deactivation was found in the left middle temporal gyrus (BA 19) for the 1>0 contrast; right medial frontal gyrus (BA 9) for 2>0 contrast; left inferior frontal gyrus (BA 45), bilateral insula (BA 13), right putamen, bilateral superior (BA 22) and right middle temporal gyri (BA 21), right superior and middle temporal gyri (BA 39, 41), left postcentral and fusiform gyri (BA 20), right lingual gyrus (BA 17/19) and left superior occipital gyrus (BA 19) for 3>0 contrast (Fig.4b).
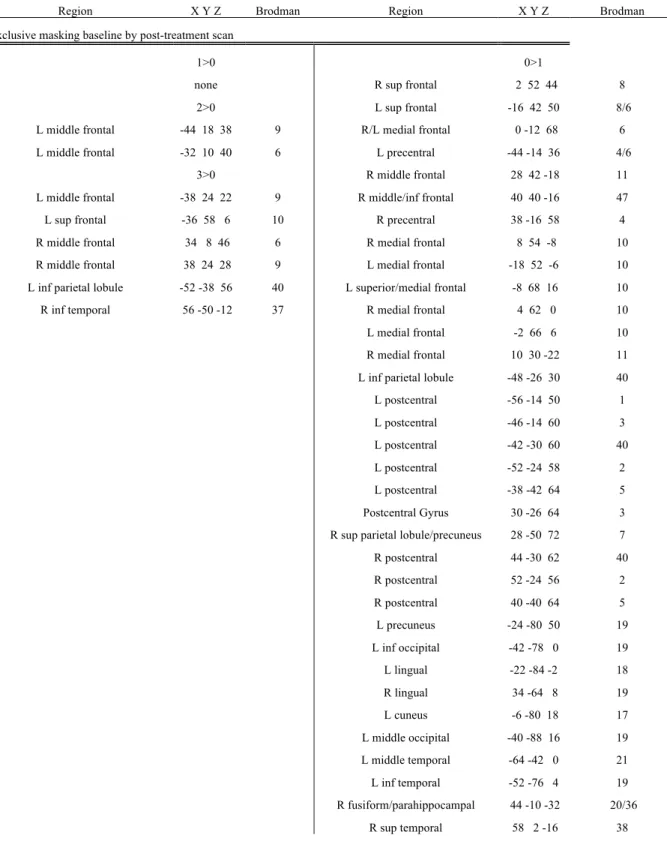
Active-treatment group baseline scan exclusively masked with post-treatment scan
Activation was found in right inferior frontal gyrus (BA 45/46) for the 1>0 contrast; right cerebellum (tuber) for the 2>0 contrast; left precentral gyrus (BA 6) for the 3>0 contrast (Table 8).
Deactivation was found in left middle temporal (BA 39), left medial frontal (BA 10), right inferior temporal gyrus (BA 20), right subcallosal (BA 34) and right parahippocampal gyri (BA 36) for the 1>0 contrast; right superior and medial frontal gyri (BA 8, 10), right insula
(BA 13), right putamen, right head of the caudate nucleus, right superior temporal gyrus (BA 38), bilateral postcentral gyri (BA 3), left precentral gyrus (BA 6) for the 2>0 contrast; left superior parietal lobule and left cuneus (BA 7, 17), left paracentral lobule (BA 6), bilateral insula (BA 13), left medial frontal gyrus (BA 10),right medial frontal gyrus (BA 6), right precentral gyrus (BA 4), bilateral superior temporal gyri (BA 22), right precuneus (BA 31), right parahippocampal gyrus (BA 19), left fusiform gyrus (BA 19) and left culmen for 3>0 contrast (Fig.5a).
Active-treatment group post -treatment scan exclusively masked with baseline scan
Activation was found in bilateral parietal lobules (BA 40), left middle frontal gyrus (BA 10), right superior frontal gyrus (BA 6), left precentral gyrus (BA 6) for the 1>0 contrast; bilateral medial and superior frontal gyri (BA 6), bilateral precuneus (BA 7), right superior temporal gyrus (BA 22), bilateral insula (BA 13), bilateral frontal regions (BA 6, L BA 4), right lingual gyrus (BA 18), right cuneus (BA 19), right cingulated gyrus (BA 24, 31), right precentral gyrus (BA 44), left superior, middle and inferior frontal gyri (BA 9), right middle occipital gyrus (BA 37), right inferior parietal gyrus (BA 40) for the 2>0 contast; left middle frontal gyrus (BA 9), right middle frontal gyrus (BA 6, 10), left middle frontal gyrus (BA 46), bilateral cerebellum for 3>0 contrast.
Deactivation was found in the right anterior cingulate gyrus (BA 24) and left inferior parietal lobule (BA 40) for the 1>0 contrast; bilateral insula (BA 13), right anterior cingulated gyrus (BA 24), right superior temporal gyrus (BA 41), left cuneus (BA 30), left postcentral gyrus (BA 43), left caudate nucleus, left superior frontal gyrus (BA 8) for the 2>0 contrast; bilateral superior temporal gyri (BA 22), right anterior cingulated (BA 25), right cingulate (BA 24, 31), left medial globus pallidus, left putamen, right medial frontal gyrus (BA 11), right postcentral gyrus (BA 3, 5), right medial frontal gyrus (BA 10), left inferior frontal gyrus (BA 47), left middle temporal gyrus (BA 21), left cerebellum for 3>0 contrast (Fig.5b).
Parametrical analysis
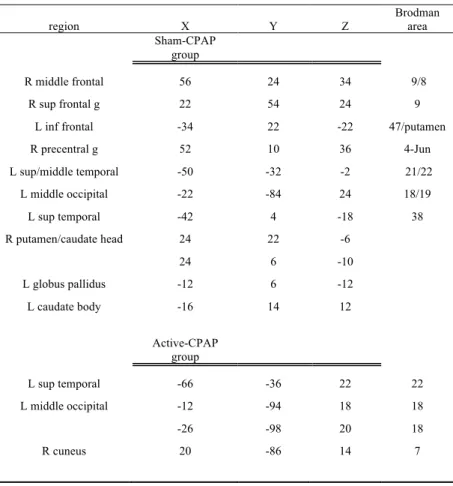
Paired T-test of baseline and post-treatment scan for the sham-treatment group revealed significantly higher activation in the right superior and middle frontal gyrus (BA 6, 8, 9), left superior and middle temporal gyri (BA 21, 22, 38), left inferior frontal gyrus (BA 47), bilateral putamen, head of the right caudate nucleus, left caudate nucleus body, left lateral globus pallidus, left middle occipital gyrus (BA 18, 19), right precentral gyrus (BA 4, 6). No areas of significantly higher activation were found in the post-treatment as compared to the baseline scan (Fig.6a, Table 9).
Paired T-test of baseline and post-treatment scan for the active-treatment group revealed significantly higher activation in the left superior temporal gyrus (BA 22), left middle
occipital gyrus (BA 18) and right cuneus (BA 17). No areas of significantly higher activation were found in the post-treatment as compared to the baseline scan (Fig.6b).
Discussion
This is the first study, to our knowledge, to specifically examine the effects of CPAP on TPN and DMN networks of untreated OSA patients as compared to sham CPAP treatment and HC.
Our results show that active- and sham-CPAP groups follow opposite trends of cerebral activation after 2 months of treatment. Whereas sham-CPAP group exhibited a decrease in TPN activation associated to an increase of DMN deactivation at the limit of capacity task (3-back), the active CPAP group presented an increase of TPN activation et all task levels, associated with an increase of DMN deactivation in the anterior midline at 3-back. In
association with a significant improvement of response times (at 2 and 3-back) and accuracy (2-back) in the active group, these findings suggest a positive effect of CPAP on the active-treatment group when the sham-CPAP group seems to sustain additional effects of untreated OSA.
An alternative interpretation of our results for the sham group is that sham-CPAP per se had a negative impact as it may lead to more mouth-breathing and sleep disruption. Significant worsening of RTs and decreased TPN activation at the 3-back after 2 months of
sub-therapeutic treatment in the sham group reflect a rather faster evolution than what would be expected of untreated OSA-related effects. Increased deactivation of the DMN has been previously reported by Sweet at al after two nights of CPAP withdrawal and correlated with
better behavioral performance and higher sleepiness68. Thus our finding of increased spatial
recruitment of DMN in the sham CPAP group for the 3-back task is consistent with these previous results and with our hypothesis of increased sleep disruption secondary to sham CPAP use.
Basal ganglia (BG) have been previously reported to show specifically load-dependent
activation69 and be activated during complex WM tasks (2-back)70, 71. Drummond et al have
described higher activation in bilateral putamen and caudate for fast as compared to slow
RTs after a normal sleep night using a Psychomotor Vigilance Task55. After acute sleep
deprivation (SD) there was an increase in activation in those regions for slow, but not fast RTs. Similarly, Habeck et al found increased activation in BG after acute SD, which may reflect an increased effort in order to maintain adequate level of attention and arousal72. Our
sham group patients exhibited significantly higher BG activation on pre-treatment as compared to post-treatment session, which, in association with slower RTs at 3-back may reflect lower capacity for WM performance.
Defective deactivation of DMN regions has been reported to be related to worse behavioral performance in a number of conditions associated with cognitive impairment and sleep disturbances (normal aging, Parkinson disease, schizophrenia, ADHD), suggesting that inability to reallocate neuronal resources and suppress activity in neighboring regions plays a
role in cognitive impairment.50-53 Disruption of task-related deactivation within the midline
regions of DMN has been reported after acute sleep deprivation,54 and slower reaction times
on a psychomotor vigilance task have also been associated with increased activation in
midline DMN regions after total sleep deprivation,55 suggesting that sleep deprivation has a
direct impact on DMN. Similarly, reduced deactivation in the posterior regions of DMN has
et al have demonstrated that task-induced deactivation in the ventro-medial PFC significantly
predicted speeding of RTs on a sensori-motor task after administration of Modafinil73.
Modafinil inhibits norepinephrine and dopamine transporters, leading to increased synaptic NE and DA concentration and has been shown to enhance cognitive performance in both
OSA patients and healthy individuals74.Therefore the observed increase of deactivation in
vmPFC together with speeding of RTs in our active-treatment group could indicate an improvement in catecholamine systems modulation of the DMN, reflecting an improved arousal level.
Despite randomization, our patient groups differed in BMI, with active-CPAP group being more overweight. This was associated with a significant negative correlation between BMI and the behavioral performance at the 3-back level in OSA patients, as well as OSA group differences in the behavioral performance at the intermediate (2-back) and maximal WM loads (3-back), with active-treatment group performing significantly worse than HC,
although there was no significant difference between the active and sham-CPAP groups. In a previous report we showed that BMI had a major negative impact on the cerebral activation
in the TPN, particularly in the prefrontal regions75. Although there was a trend towards better
performance on the 3-back task load after CPAP treatment in the active group, it still remained significantly worse than that of HC. The incomplete reversal of deficits by CPAP treatment has been attributed in prior literature to irreversible structural hypoxic damage, however, since we found an independent negative effect of BMI on TPN activation in the PFC, we postulate that the incomplete response to CPAP treatment may also be related to the presence of overweight, unchanged by CPAP treatment alone. This is supported by the fact that nasal CPAP does not act on the restrictive aspect of thoracic breathing presented by obese OSA patients, who thus will persist having breathing problems during sleep even if they translate only by airflow limitation and lower oxygen saturation than expected for their age group. Furthermore, other mechanisms than impaired breathing, such as metabolic and hormonal changes associated with obesity, likely contribute to the observed cerebral activation deficit.
It is increasingly recognized that excess body weight is associated with brain structural and functional alterations63, a higher risk of developing dementia in later life40, as well as
cognitive dysfunction in otherwise healthy adults or after controlling for BP, age, and
diabetes40, 41, 66. Therefore, it would be of great interest to examine whether reduction in BMI
in conjunction with CPAP treatment could improve executive function deficits in OSA patients.
OSA patients in our study were all high-performing individuals which suggests that neuronal damage secondary to OSA was rather minimal. The role of CPAP treatment in those
individuals might therefore reside not so much in improving performance, but in protection from further damage. In that sense, longitudinal studies of CPAP effects on initially well performing patients would be needed in order to assess the degree of protection that CPAP treatment might offer and tease apart the contribution of CPAP versus placebo effect in the long term.
Two other studies have investigated the effect of CPAP on cerebral activation of OSA patients. Thomas et al have found no improvement in DLPFC activation on a verbal 2-back WM task in 6 OSA patients after CPAP treatment, although there was some increase in the
parietal activation29. Since their patient group had performed significantly worse than HC at
baseline and did not improve after treatment, the lack of cerebral activation changes in the DLPFC was interpreted as an indication of a more permanent cerebral damage. No
information was reported on the deactivation pattern.
More recently Castronovo et al examined the effect of CPAP on cerebral activation on a
verbal 1- and 2-back WM task in 17 OSA patients32. Greater spatial activation was reported
in a number of prefrontal regions, bilateral precuneus, left putamen, left hippocampus and was interpreted as a compensatory over-recruitment. Whereas more extensive activation in the PFC of never treated OSA patients in the presence of the same level of performance is indeed suggestive of over-recruitment of the TPN, more important activation in the hippocampus and precuneus were more difficult to explain. However, these latter
observations are consistent with our hypothesis and findings of defective DMN functioning in OSA, as both hippocampus and precuneus are constituents of DMN. Furthermore, the authors have found an increased activation in bilateral hippocampus, fusiform gyrus and ACC (BA 24) in the preatreatment as compared to posttreatment scans in OSA patients,
which is consistent with less effective DMN at baseline with subsequent improvement after treatment.
Those findings as well as results of our study are in line with our previous observation that
DMN is more severely affected by OSA than TPN75.
In light of the results of functional and structural neuroimaging studies it appears that CPAP treatment could be most useful in high-functioning OSA patients, by preventing or at least slowing OSA-related neuronal damage. Further long-term longitudinal studies are needed in order to investigate this hypothesis. Finally, high-functioning OSA patients should be tested with limit-of-capacity tasks in order to avoid ceiling effects.
In conclusion, both TPN and DMN can show spatial over-recruitment in OSA patients in order to maintain an adequate behavioral response. When the compensation capacity is overwhelmed, decrease in behavioral performance is observed. In our study we found that OSA patients’ performance accuracy significantly differed from that of HC only at the limit-of-capacity 3-back WM level. However, RT of accurate responses was a more sensitive measure of impairment, showing a significant patient group versus treatment interaction. CPAP treatment appears to have a generally positive effect on both cerebral activation and deactivation patterns, however, in accord with previous studies, it does not allow complete reversal of already established deficits, at least within two months of CPAP treatment. Increased BMI has an independent negative effect on TPN activation in the PFC and may thus account for part of the remaining deficits.
Further research is needed in order to establish whether a conjunct treatment of obesity and CPAP could yield better improvement in behavioral performance and frontal TPN activation than CPAP treatment alone.
Table 5: Sample characteristics Age 43.2 (±8.4) BMI 27.8 (±4) AHI 39.7 (±22.8) Ethnicity 4 Asian, 12 Caucasian, 1 Hispanic TST 376.8 (±71.1) Sleep efficiency 83.1 (±13.1) REM 17.9 (±4.9) Stage 1 12 (±7.3) Stage 3+4 7.9 (±8.9) Min SpO2 87.8 (±8.9)
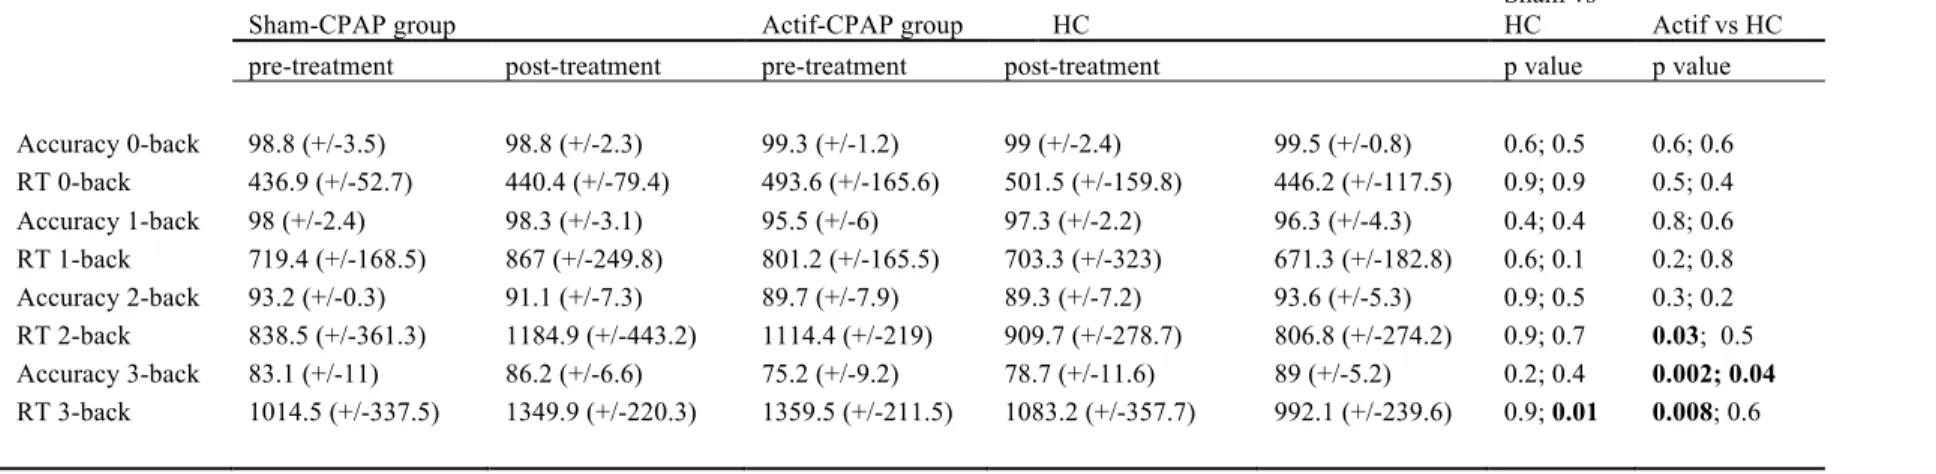
Table 6: Behavioral performance
Sham-CPAP group Actif-CPAP group HC
Sham vs
HC Actif vs HC pre-treatment post-treatment pre-treatment post-treatment p value p value Accuracy 0-back 98.8 (+/-3.5) 98.8 (+/-2.3) 99.3 (+/-1.2) 99 (+/-2.4) 99.5 (+/-0.8) 0.6; 0.5 0.6; 0.6 RT 0-back 436.9 (+/-52.7) 440.4 (+/-79.4) 493.6 (+/-165.6) 501.5 (+/-159.8) 446.2 (+/-117.5) 0.9; 0.9 0.5; 0.4 Accuracy 1-back 98 (+/-2.4) 98.3 (+/-3.1) 95.5 (+/-6) 97.3 (+/-2.2) 96.3 (+/-4.3) 0.4; 0.4 0.8; 0.6 RT 1-back 719.4 (+/-168.5) 867 (+/-249.8) 801.2 (+/-165.5) 703.3 (+/-323) 671.3 (+/-182.8) 0.6; 0.1 0.2; 0.8 Accuracy 2-back 93.2 (+/-0.3) 91.1 (+/-7.3) 89.7 (+/-7.9) 89.3 (+/-7.2) 93.6 (+/-5.3) 0.9; 0.5 0.3; 0.2 RT 2-back 838.5 (+/-361.3) 1184.9 (+/-443.2) 1114.4 (+/-219) 909.7 (+/-278.7) 806.8 (+/-274.2) 0.9; 0.7 0.03; 0.5 Accuracy 3-back 83.1 (+/-11) 86.2 (+/-6.6) 75.2 (+/-9.2) 78.7 (+/-11.6) 89 (+/-5.2) 0.2; 0.4 0.002; 0.04 RT 3-back 1014.5 (+/-337.5) 1349.9 (+/-220.3) 1359.5 (+/-211.5) 1083.2 (+/-357.7) 992.1 (+/-239.6) 0.9; 0.01 0.008; 0.6