DEPARTAMENTO DE BIOLOGIA ANIMAL
GENETIC DIVERSITY IN A LITTLE KNOWN
LEMUR SPECIES FROM THE NORTH OF
MADAGASCAR (Microcebus tavaratra)
Isa Gameiro Aleixo Pais
Mestrado em Biologia da Conservação
2011
DEPARTAMENTO DE BIOLOGIA ANIMAL
GENETIC DIVERSITY IN A LITTLE KNOWN
LEMUR SPECIES FROM THE NORTH OF
MADAGASCAR (Microcebus tavaratra)
Dissertação orientada pelos Prof. Doutor Lounès Chikhi, IGC e Prof. Doutor Élio Sucena, FCUL
Isa Gameiro Aleixo Pais
Mestrado em Biologia da Conservação
2011
I deste trabalho. A todas elas gostaria de expressar o meu obrigada.
First of all, I feel grateful for having as supervisor Dr. Lounès Chikhi, who taught me population genetics, I thank him all the support, guidance and patience during this work!
Ao meu co-orientador Élio Sucena por me proporcionar as condições necessárias para o desenvolvimento deste projecto.
A special thanks to all the members of the team working in Madagascar, in particular Jordi Salmona and Sam Meyler, without their field work this thesis would have never been possible.
To all present and past members of the Population and Conservation Genetics group for their comments and technical support. In particular I would like to thank Célia Rodrigues for her valuable help in all the labwork, to Isabel for helping me with the first steps into sequences, to Reeta Sharma for all her support in dealing with data analysis programs and to Bárbara Parreira for all the teaching lessons and moral support at most times.
Gostaria de agradecer a todos os meus amigos por terem estado presentes e pelo apoio que me deram em todos os momentos.
À minha irmã pela sua serenidade e bom senso, à minha mãe pelas suas sopas e por sempre ter acreditado em mim, ao meu pai por ter dado sempre a força e os meios para desenvolver este trabalho e ao resto da família por tudo o resto.
Este trabalho foi financeiramente apoiado pela Fundação para a Ciência e Tecnologia no âmbito do projecto no qual me insiro, “Habitat loss and fragmentation in Madagascar: comparative
analysis of several lemur species in two neighbouring regions of Madagascar”
II and Benstead, 2003; Myers et al., 2000) mas a sua biodiversidade única tem sido, e ainda é, ameaçada por alterações climáticas e por pressões antropogénicas (Ganzhorn et al., 2001; Allun et al., 2008). Os lémures, como animais dependentes da floresta, são particularmente afectados por estas mudanças no habitat. Embora a razão pela qual estas alterações climáticas ocorreram ainda não seja muito clara, a história de Madagáscar revela que muitas das espécies existentes extinguiram-se no último milénio (Dewar 2003; Lawler 2010).
Contrariamente ao esperado, esta diminuição no número de espécies não é notória nos lémures, o que tem levado a debates acerca de uma possível “inflação taxonómica” (Tattersall, 2007). Isto é particularmente verdade para as espécies nocturnas de pequeno e médio porte como é o caso do lémure rato (Microcebus spp.) e do lémure desportivo (Lepilemur spp.), que têm visto o seu número de espécies reconhecidas passar de duas (para a espécie Microcebus) e sete (para a espécie Lepilemur) para 18 e 26 respectivamente (Louis et al., 2006; Olivieri et al., 2007, Mittermeier et al., 2010). Esta característica poderá explicar o rápido crescimento do número de espécies descritas, mas também dá ênfase à vulnerabilidade das espécies em relação à destruição do seu habitat (Yoder et al., 2002, Weisrock et al., 2010), em particular os lémures rato que parecem ser influenciados pela presença de espaços não florestados entre os fragmentos de floresta (Radespiel et al., 2008).
Os lémures rato (género Microcebus) encontram-se distribuídos por toda a ilha de Madagáscar (Louis et al., 2006; Olivieri et al., 2007) ocupando diversos habitats (Vigilant and Guschanski, 2009). Devido ao facto de este género ser microendémico, estas espécies revelam grande importância para estudos comparativos em vários pontos de Madagáscar. Na grande maioria das regiões já foram realizados censos, mas ainda existem áreas que não foram estudadas e em muitas
III de floresta de Bekaraoka e Bobankora. Os dois espécimens foram identificados como pertencentes à espécie Microcebus tavaratra. Contudo espécies coabitantes de lémure rato são conhecidas por habitarem várias regiões de Madagáscar e não é claro que Daraina apenas abrigue uma espécie em particular, uma vez que ainda não foi realizada nenhuma amostragem para as regiões a sul de Daraina.
Este trabalho insere-se num projecto que pretende estudar várias espécies de lémures da zona de Daraina, no norte de Madagáscar, e tem como principal objectivo identificar a diversidade genética existente em populações de lémure rato presentes em três fragmentos de floresta desta região. Daraina é uma área com indústrias mineiras e florestais que provavelmente contribuem em grande parte para a desflorestação do habitat (Vargas et al., 2002, Goodman et al., 2006, Quéméré et al., 2010), e consequentemente, espécies que dependem da floresta como é o caso dos lémures, são particularmente afectadas por estas acções (Banks et al., 2005; Sott et al., 2006).
Embora haja evidência da presença do lémur rato tavaratra (Microcebus tavaratra) em Daraina, não é certo que os indíviduos amostrados para este estudo pertençam a esta espécie. Deste modo é importante determinar se todos os indivíduos pertencem à mesma espécie e se esta é a anteriormente descrita por Weisrock et al. (2010). Para tal, ADN de 72 indivíduos amostrados no campo foi extraído e amplificado para 3 loci do ADN mitochondrial (cyt b, COII e d-loop). Em seguida, procedeu-se à sequenciação do ADN amplificado e as sequências obtidas foram alinhadas no programa BIOEDIT© version 7.0.9.0 (Hall, 1999). Sequências de 5 espécies de Microcebus foram adquiridas da base de dados GenBank para serem utilizadas como referência às nossas amostras. Para construir as árvores filogenéticas necessárias de modo a determinar a espécie amostrada, foi necessário calcular o modelo evolutivo que melhor se adequa aos nossos dados.
IV reais. As árvores filogenéticas foram construídas para cada locus no programa MEGA© version 5 (Tamura et al., 2011) usando o modelo evolutivo seleccionado. Os resultados obtidos demonstraram que as nossas amostras encontram-se agrupadas juntamente com as sequências de referência de M. tavaratra, o que sugere que os indivíduos amostrados pertencem, provavelmente, a esta espécie.
Frequentemente, o processo de identificação das espécies é também utilizado para obter informação ao nível da diversidade genética das populações. No caso destes indivíduos, foi utilizado o ADN mitocondrial anteriormente sequenciado e ADN nuclear genotipado para cinco loci polimórficos. Diversidade haplotídica e nucleotídica foram calculadas para os loci cyt b, COII e d-loop (mtDNA) e todos estes índices encontravam-se dentro dos valores apresentados noutros estudos de genética populacional, à excepção de uma população, Binara. Para estes indíviduos não foi encontrada qualquer diversidade genética para nenhum dos loci, um resultado interessante visto que o número mínimo de indíviduos sequenciados (N=10) estava no limite do número sugerido por Markolf e tal, 2011 (10 indivíduos por cada fragmento amostrado). Para além disso, os locais de captura dos indivíduos neste fragmento eram os mais dispersos de todas as populações amostradas. Para este marcador genético (mtDNA), a população de Bekaraoka apresentou as taxas de variação mais altas de entre as três populações com valores mínimos de Hd=0.709±0.003, e π=0.003±0.002. Esta população foi também a única que mostrou evidências de partilha de haplótipos com as outras duas populações, resultados facilmente observados nas redes de haplótipos calculadas.
No entanto, a diversidade genética encontrada ao nível do ADN nuclear apresentou resultados contrários aos anteriormente obtidos. Nesta análise, a população de Binara demonstrou
V desvio do equilíbrio de Hardy-Weinberg, embora os valores de p não sejam estatisticamente significativos.
Foi ainda realizado o teste AMOVA para ambos os tipos de marcadores genéticos e enquanto no ADN mitocondrial foi detectada variação entre e dentro de cada população (54.48 - 64.81% e 35.19 – 45.52%, respectivamente), para o ADN nuclear apenas foi encontrada uma variação muito alta dentro de cada população (94.16%). Um outro teste de estrutura populacional foi realizado no programa STRUCTURE 2.3.3 (2010), mas mais uma vez não foi detectada nenhuma estrutura a nível da diversidade nuclear para as populações amostradas neste estudo.
A estrutura populacional, o efeito de gargalo, a selecção natural, o ciclo de vida, o sistema de acasalamento e a estrutura social são factores que podem ter um efeito na genética das populações (Bazin et al., 2006). Neste estudo foi detectada variação genética entre e dentro de cada população mas é complicado atribuir essa diversidade a eventos específicos, uma vez que a nossa amostragem abrange apenas três fragmentos de floresta e 72 indivíduos, e não existe muita informação disponível para a espécie de Microcebus presente na região de Daraina.
Contudo, estudos como este são importantes para a conservação de espécies pois permitem-nos perceber como é que as populações respondem a alterações climáticas e/ou pressões antropogénicas, e desta forma desenvolver planos de conservação coerentes e consistentes. Estas acções requerem um trabalho conjunto entre investigadores, comunidades locais, ONG’s (Organizações não-governamentais), universidades e entidades governamentais (Dunham et al., 2008, Quéméré et al., 2009).
VI Estudos sobre a delimitação das espécies e genética populacional providenciam-nos informação sobre a evolução das espécies assim como a sua resposta natural às pressões antropogénicas. Ainda assim, para muitas espécies, esses efeitos ainda não foram estudados e necessitam de mais investigação (Hanski et al., 1998). Este é o caso dos lémures rato (género Microcebus) que habitam as florestas de Daraina. Foi sequenciado o ADN mitocondrial de 72 indivíduos Microcebus, cujas amostras tinham sido recolhidas em três fragmentos de floresta, de modo a determinar se eram todos membros da mesma espécie, a M. tavaratra, uma vez que dois outros indivíduos desta espécie já tinham sido identificados nesta região (Weisrock et al., 2010). É importante perceber como a diversidade genética é distribuída tanto para os genes mitocondriais como para os nucleares (microsatélites), uma vez que o rio Manankolana e outros aspectos ecológicos de Daraina já demonstraram desempenhar um papel importante na estrutura genética de algumas populações (Quéméré et al., 2010; Radespiel et al., 2008).
Os resultados sugerem que todos os indivíduos pertencem à espécie M.tavaratra e que é mantida uma grande variabilidade genética nas populações de Bekaraoka e Solaniampilana. Contudo, na floresta de Binara, a falta de diversidade genética em todos os mtADN loci é surpreendente. Por outro lado, os dados dos microsatélites demonstraram que afinal a população de Binara exibe variabilidade genética assim como as outras duas populações. Como tal, não foi possível identificar nenhuma estrutura populacional ao nível nuclear. Embora seja provável que este seja o estudo mais abrangente geograficamente sobre os Microcebus de Daraine, os resultados sugerem que é necessária mais investigação. Estudos como este são importantes para que se implementem planos de conservação coerentes e consistentes para as espécies em risco.
VII species, as well as their response to natural or anthropogenic pressures. However, for many species these effects have not yet been studied and need further research (Hanski et al., 1998). This is the case of mouse lemurs (genus Microcebus) living in the forests of Daraina.
We will sequence the mitochondrial DNA of 72 Microcebus individuals sampled in three forest fragments, in order to determine if they are all members of the same species, the M. tavaratra species previously identified in 2 individuals from this region (Weisrock et al., 2010). We would also like to understand how is genetic diversity distributed within and between populations for both mitochondrial and nuclear genes (microsatellites), as the Manankolana river and other natural features in Daraina have shown to play a role in the genetic structure of some populations (Quéméré et al., 2010; Radespiel et al., 2008). Finally, we will try to identify genetic clusters, despite the limited number of nuclear loci and populations, and determine if these clusters correspond to specific features of the habitat.
The results suggest that all individuals belong to the M. tavaratra species and high genetic variation is maintained in populations from Bekaraoka and Solaniampilana. However, the lack of genetic diversity in the Binara forest across all mtDNA loci is surprising. Microsatellite data though, showed that the Binara population actually exhibited genetic variability and thus, no clustering could be defined at the nuclear level.
Despite being probably the most geographically widespread study on Microcebus from Daraina, our results suggest that more research should be carried out. Nevertheless, studies like this one are important for the implementation of appropriate and effective conservation plans of threatened species.
Abstract ... VII
0. Structure of the project ... 1
1. Introduction ... 2
1.1. Conservation in Madagascar ... 3
1.2. Lemurs of Madagascar: mouse lemurs ... 5
1.3. The Study site: Daraina region ... 8
2. Materials and Methods... 10
2.1. The Microcebus samples collection and DNA extraction ... 10
2.1.1. Mitochondrial DNA (mtDNA) amplification and sequencing ... 10
2.1.2. Microsatellite amplification and genotyping ... 12
3. Lemur taxonomy and genetic diversity ... 13
3.1. Phylogenetic trees ... 13
3.2. Genetic diversity indexes ... 14
3.2.1. mtDNA ... 14
3.2.2. Nuclear DNA: microsatellites ... 15
4. Results ... 17
4.1. Phylogenetic analysis: the Daraina mouse lemurs belong to the M. tavaratra clade ... 17
4.2. Mitochondrial DNA diversity and differentiation within M. tavaratra ... 19
4.3. Microsatellite diversity within M. tavaratra ... 22
5. Discussion ... 24
5.1. Samples and laboratory techniques ... 24
5.2. Only one Microcebus species appears to be present in Daraina ... 25
5.3. Genetic diversity ... 27
5.3.1. Mitochondrial DNA variation in M. tavaratra ... 27
5.3.2. Microsatellite markers ... 31
5.4. Further research and conservation implications ... 32
6. REFERENCES ... 34
1 0. Structure of the project
The present thesis is divided in six chapters.
Chapter 1 is a brief introduction to the main theme considered in this thesis. Herein, we aim to relate this study with all subjects presented throughout the work with basis on up to date
knowledge in this field. A description of the species studied as well as the study site is also found in this section.
In chapter 2, the methodology necessary to obtain the data for this work is described in detail..
The analysis performed for the taxonomy and genetic diversity of mouse lemurs is described in section 3.
A description of the results obtained from the phylogenetic analysis, quantification of genetic diversity and study of population structure are presented in this fourth chapter.
Finally, in chapter 5, all the results obtained are discussed and related with other studies, and final conclusions are attained. In this chapter we alsodiscuss the main contributions of the work, give future guidelines and identify open questions that deserve further investigation in the context of the conservation of lemurs in Madagascar.
2 1. Introduction
Biodiversity is variably distributed across the World with some regions featuring exceptional concentrations of endemic species and experiencing exceptional loss of habitat (Myers, 1990; Pressey et al., 1993; Prendergast et al., 1999; Ginsberg 1999 in Goodman and Benstead 2003). Biodiversity is currently under threat due to habitat loss and fragmentation (Meyers et al., 2000; Ganzhorn et al., 2003) caused by both natural and anthropogenic factors (Watson 2002; Fahrig 2003). These Biodiversity hotspots are being identified as priority areas for Conservation. Madagascar is characterized by a high level of endemism in plants (3,2% of global species total – 300,000) and animals (2,8% of global species total – 27,298) (Goodman and Benstead 2003; Myers et al., 2000).
The identification of new species, the quantification of the species diversity and differentiation are fundamental for defining conservation strategies. Differentiation among populations affects species overall genetic diversity and this differentiation is usually measured by different statistics which use allelic frequencies from microsatellite and sequence DNA data. The analysis of genetic data of natural populations has the ultimate goal of understanding species evolution and diversification. Moreover, population genetic studies used to assess the distribution of diversity within and between populations are essential to understand which factors, anthropogenic or natural, are the responsible for such diversity.
In this thesis, I will therefore address several questions (i) are individuals sampled across three forest fragments of one particular region of Madagascar members of the same species, (ii) is this (or one of these) species the same species as M. tavaratra identified by Weisrock et al., (2010) in previous studies, (iii) how is genetic diversity distributed within and between populations for both mitochondrial and nuclear genes (microsatellites), (iv) can we identify genetic clusters despite the limited number of nuclear loci, (v) do these clusters, if any correspond to specific features? However, given the limited number of individuals and locations sampled we do not expect to be able to answer the last questions with more than preliminary results. A better understanding on these issues should contribute to a better understanding on the current status of the lemur species diversity in Madagascar and should highlight aspects of this lemur population diversity.
3 I should also finish this introduction by indicating that part of my Masters work was also carried out to set up and test protocols. For instance I have (I) tested and validated a DNA extraction protocol on faecal material from P. tattersalli (ii) amplified microsatellites for several populations of P. coronatus, and P. coquereli, (iii) tested and validated several extraction protocols to identify the cheapest and most efficient one, and (iv) tested and validated a sexing protocol on M. tavaratra (biopsy), P. coronatus (faeces) and P. verreauxi (faeces).
Altogether the present study is part of a wider project which aims at understanding the effects of habitat loss and fragmentation across lemur species within the same region and in which I am involved. It builds on a previous work carried out by Quéméré et al. (2010 a, b) on the golden-crowned sifaka (Propithecus tattersalli) whose distribution is limited to the Daraina region (Quéméré et al., 2009, 2010a, b). The work presented here is thus a first step towards a wider phylogenetic and multispecies landscape and population genetics region-wide study. The Daraina region is particularly interesting because, besides being fragmented, it is ecologically very variable. Anthropogenic activities, such as gold mining and wood exploitation, are factors that may contribute to habitat loss and fragmentation in this region (Vargas et al., 2002; Goodman et al., 2006; Quéméré et al., 2010 a, b), but a recent study has shown that the major barrier to gene flow in P. tattersalli was the Manankolana river that crosses the region. Other factors appeared to be the presence of savannah and geographic distance whereas the national road, also crossing the region, did not appear to have such a major impact (Radespiel et al., 2008).
1.1. Conservation in Madagascar
Madagascar is one of the most important Biodiversity hotspots in the World (Goodman and Benstead, 2003; Myers et al., 2000) but its unique biodiversity has been, and still is, highly threatened by major environmental changes and anthropogenic pressures (Ganzhorn et al., 2001; Allnut et al., 2008). While the exact causes of these environmental changes are not fully clear, the history of Madagascar reveals that many species have become extinct in the last millennia (Dewar,
4 2003; Lawler et al., 2001). Harper et al. (2007), have recently estimated that only 10%–15% of the original forests of Madagascar remain and that deforestation continues at a rate of 1% per year, hence contributing to further habitat loss and fragmentation (Burney et al., 2004; Smith et al., 1997), and potentially driving species to extinction (Goodman and Benstead, 2003). Despite the existence of a few continuous forest reserves in Madagascar, most forest mammals survive in small, and increasingly isolated habitat patches (Smith et al., 1997). Lemurs in particular, as forest-dwelling animals, are strongly affected by these changes (Godfrey and Irwin 2007). In order to preserve such a unique and diverse ecosystem, conservation actions must be developed (Rands et al., 2010). This requires both local and global strategies which must involve local communities, NGOs (non-governmental organizations), universities and governmental agencies. Together, these entities may define priorities regarding deforestation, mining and logging, to reduce habitat loss and fragmentation in Madagascar (Dunham et al., 2008, Quéméré et al., 2009).
The number of studies on the impact of habitat loss and fragmentation on the genetic diversity of lemur populations has increased in the last years, in part due to increased sampling efforts, new molecular techniques and population genetics analyses (e.g. Olivieri et al., 2008; Quéméré et al., 2010a; Schneider et al., 2010). However, for many other species from the same regions these effects have not yet been studied and are still poorly understood, making long-term consequences difficult to infer and study (Hanski et al., 1998; Ewers and Didham, 2006).
In parallel to this need for multispecies studies within the same region there are still many issues that need to be solved at higher taxonomical levels. Indeed, it is important to improve our understanding on the taxonomic units present in the regions of interest. This is particularly true in Madagascar where the number of recognised species has significantly increased in the last fifteen years in several groups of vertebrates (Vences et al., 2009; Mittermeier et al., 2010). In lemurs this has led to debates regarding a possible “taxonomic inflation” (Tattersall, 2007) This is particularly true for nocturnal small and medium-sized species such as mouse lemurs (Microcebus spp.) and sportive lemurs (Lepilemur spp.), which have seen their number of recognized species go from
5 two (for Microcebus) and seven (for Lepilemur), to 18 and 26, respectively (Louis et al., 2006a; Olivieri et al., 2007, Mittermeier et al., 2010).
1.2. Lemurs of Madagascar: mouse lemurs
Molecular analysis suggest that out of the 18 mouse lemurs species officially recognised (Mittermeier et al., 2008, 2010), several do show extremely limited geographic distributions (micro-endemism) (Vences et al., 2009), with rivers playing an apparent role as barriers of gene flow (Wilmé et al., 2006). This characteristic may explain the rapid increase in the number of species described but also emphasizes the species vulnerability to habitat destruction (Yoder et al., 2002, Weisrock et al., 2010), particularly as mouse lemurs appear to be influenced by the presence of non forested areas between forest fragments (Radespiel et al., 2008).
Mouse lemurs (genus Microcebus) are the world’s smallest primates with average adult body size ranging from 30 to 72 g (Rasoloarison et al., 2000; Yoder et al., 2000). They are strictly nocturnal solitary foragers that live in dispersed social organizations (Heckman et al., 2007; Olivieri et al., 2008) and are sympatric with other nocturnal species and in some areas, with other Microcebus species (Mittermeier et al., 2010). They are found in most habitat types of Madagascar, thus showing a widely distribution across the island (Louis et al., 2006a; Olivieri et al., 2007) (Figure 1), but their home range is relatively small (0.01 – 0.02 km2) (Kappeler and Rasoloarison, 2003). Basic aspects of the ecology and behaviour of some Microcebus species still remain to be studied. The IUCN Red List conservation status for the Microcebus genus varies across species from Endangered to Least Concern, and for many data is deficient. Nevertheless, M. tavaratra is classified as Endangered (EN), having habitat loss due to illegal logging, mining for sapphires, uncontrolled brush fires and charcoal production as the principal threat (Mittermeier et al., 2010).
Mouse lemurs are a potentially interesting model to study the genetic consequences of habitat fragmentation over short evolutionary periods (Chikhi and Bruford, 2005) because they are
6 present in all types of habitats, and have short generation times, making them sensitive to (and hence ideal for inferring) recent demographic events due to anthropogenic or climatic changes. The fact that most mouse lemurs are thought to be microendemic (Gligor et al., 2009), makes them vulnerable to deforestation and poaching (Yoder et al., 2000; Mittermeier et al., 2010) but also suggests that comparative studies can be carried out across Madagascar.
Recently, Weisrock et al. (2010) analysed genetic data from 286 individuals across Madagascar in order to clarify the phylogenetic relationships between mouse lemurs. While most regions were covered, there were still some gaps in the sampling and some wide regions only had one or two individuals sampled. This was the case of the Daraina region, where two mouse lemur individuals were sampled in the forest fragments of Bekaraoka and Bobankora (Figure 1). The two specimens were identified as belonging to the species M. tavaratra, together with four other individuals sampled north and northwest of Daraina in the national parks of Ankarana, Ankavana and Analabe (Olivieri et al., 2007). However, sympatric mouse lemur species are known to inhabit several regions of Madagascar and it is unclear whether Daraina only harbours one species particularly as the regions south of Daraina are unsampled. Moreover, a recent study by Markolf et al. (2011) has suggested that for mouse lemurs, the sample sizes used to identify species through mtDNA, as in the Weisrock et al. (2010) study may be too small leading to an upward bias in the number of recognised species.
7 Figure 1: The geographic distribution of Microcebus species across Madagascar.
This map shows the most up to date distribution of mouse lemurs obtained from the analysis of mitochondrial and nuclear loci. (Source: in Weisrock et al.,2010).
8 1.3. The Study site: Daraina region
Despite being relatively small (2,580 km2) the Daraina region has a surprisingly diverse habitat (Quéméré et al., 2010b) within the area geographically limited by the Loky and the Manambato rivers. The forested area corresponds to 17% of the total area (440 km²) and is composed of gallery forests, littoral forests and highly fragmented humid or dry deciduous forest patches undergoing gold mining and wood exploitation (Goodman et al., 2006). Forests are surrounded by human-altered degraded grasslands used for zebu cattle grazing, dry scrub and agricultural land (Meyers, 1993; Randrianarisoa et al., 1999).
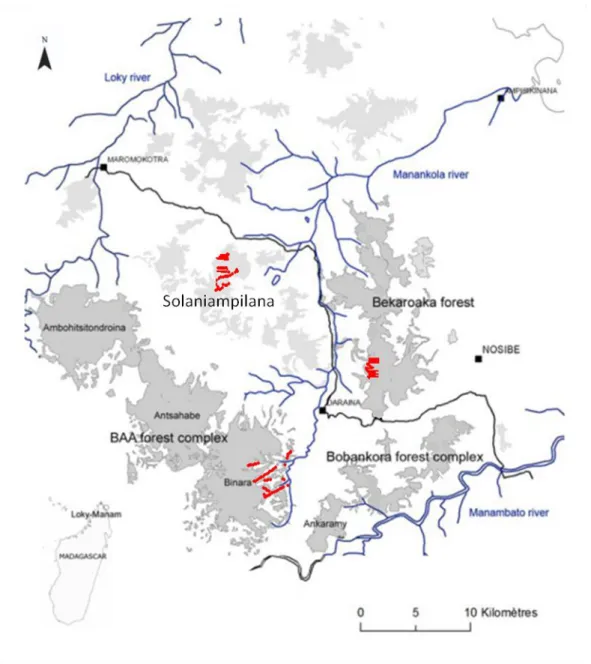
All samples were obtained from three forest fragments,Bekaraoka, Binara and Solaniampilana,withn the Daraina or Loki/Manambato region in the north of Madagascar (Figure 2). The three fragments, though geographically close, are ecologically very different. Solaniampilana and Bekaraoka are classified as western dry forest, while Binara is an evergreen humid forest (Moat and Smith, 2007). The fragments are separated from each other by a minimum of 10km and a maximum of 18km in a straight trajectory. The total surface area of the Bekaraoka, Binara and Solaniampilana forest fragments were estimated using the ArcGis® 9.3 program and the Madagascar Vegetation Mapping Project, from this last, forest classification data was used (source: http://www.kew.org/gis/projects/mad_veg/datasets.html). The estimated surface areas were, respectively, 54.24 km², 45.38km² and 12.86 km². It is also important to stress that the Bekaraoka and Binara forests are located in the “Station Forestière à Usages Multiples”, (S.F.U.M. “Multiple Usage Forest Station”), a 570 km² Protected Area managed by the Fanamby NGO in collaboration with the Ministry of Environment and Forests (Quéméré et al., 2010b), while the Solaniampilana forest is currently situated outside this protected area.
Based on known home range for the genus Microcebus (Mittermeier et al., 2010), and distance between the sampled sites, it is plausible to assume that direct dispersal would be very unlikely to occur. To our knowledge the species of Microcebus present in this region are poorly known and
9 only two individuals have been sequenced so far, one from Bekaraoka and one from Bobankora fragments (Weisrock et al., 2010).
Figure 2: Trapping locations for the individuals sampled in this study. The map above shows the area of Daraina and the different forest fragments sampled; the red dots are the geographic locations where individuals were captured.
10 2. Materials and Methods
2.1. The Microcebus samples collection and DNA extraction
The Microcebus samples were collected in July and August of 2010 using Sherman traps (H.B. Sherman Traps®). For each animal captured, morphometric measurements were recorded and tissue, faecal and hair samples were collected. A total of 209 individuals were captured. However, only the tissue samples (ear biopsies) of a maximum of 72 individuals were used and sequenced in this study (see below for details and annex table 1 for sample information). The biopsies were stored in Queens Lysis Buffer (Seutin et al., 1991; Dawson et al., 1998) for preservation purposes. Once in the laboratory, the samples were kept at 4˚C until laboratory analysis. All animals were marked with 1-3 systematic ear biopsies (ca. 2mm²) for future identification in the field following Rakotondravony et al., (2009), thus some storage tubes contained more than one biopsy. All field handling and sampling procedures adhered to the legal requirements of Madagascar and were approved by the Ministry of Water and Forests.
Total genomic DNA was extracted from 72 ear biopsies. Each biopsy was incubated overnight at 37˚C in 300µl digestion buffer (100mM EDTA, 100mM NaCl, 50mM Tris pH8 and 1% SDS) and 30µl of Proteinase K at 10mg/ml (Promega #V3021). A standard mammalian DNA isolation protocol (adapted from Laird et al., 1991) was used as it was found to be the cheapest and quickest of all other procedures considered (see Annex – table 2). The extractions were performed in a DNA free Hood and each set of samples included a negative control to ensure that no cross-contamination occurred and a positive control to validate the genotypes.
2.1.1. Mitochondrial DNA (mtDNA) amplification and sequencing
Three different mtDNA regions/loci were amplified and sequenced for individuals from the three forest fragments. The mtDNA regions were selected on the basis of previously published molecular studies on Microcebus species. Two conserved regions of the mtDNA adapted for cross
11 species comparisons, Cytochrome b (cyt b 1110bp fragment) and Cytochrome oxidase II (COII -684bp fragment), were amplified with the flanking tRNA primers L14724:
5’-CGAAGCTTGATATGAAAAACCATCGTTG-3’ and H15915:
5´-AACTGCAGTCATCTCCGGTTTACAAGA-3´ (Irwin et al., 1991), and L7553: 5´- AACCATTTCATAACTTTGTCAA-3´ and H8320: 5´-CTCTTTAATCTTTAACTTAAAAG-3´ (Adkins et al., 1994), respectively. Another 514bp fragment from the hypervariable d-loop region of the mtDNA was also amplified using the universal mammalian control region primers L15997: 5´- CACCATTAGCACCCAAAGCT-3´and H16498: 5´-CCTGAAGTAGGAACCAGATG -3´ (Gerloff et al., 1999). PCR amplifications were carried out in a 10µl reaction with final concentrations of 1.0µM for each primer, 1.5mM of MgCl2, 0.2mM of each dNTP, 1 x
NH4-reaction buffer, 0.05 units of GoTaq® Flexi DNA polymerase (Promega #M8305), and 10–100ng of DNA template. Standard PCRs were run with an initial denaturing temperature of 94˚C for 2min, followed by 30 cycles of 1min at 94˚C, 1min at 45-55˚C and 1min and 15secs at 72˚C, and a final extension of 10 min at 72˚C. Both PCR conditions and cycles followed the protocols from Guschanski et al.(2007) and Horvarth et al. (2008). For details on the annealing temperatures see table 1. An aliquot of 3 µl PCR products, including the positive and negative controls, were loaded on a 2% agarose gel to verify successful amplification and possible contamination. The percentage of samples that were discarded from the data analysis due to none or poor amplification are also represented in table 3 (sequencing success≈74%). PCR products were directly sequenced using both forward and reverse primers and BigDyeH Terminator v3.1 (Applied Biosystems, Foster City, CA). Cycle sequencing was performed in a total volume of 10 µL including 0.5mM primer, 2µl Big Dye, 2µl buffer, 50-100ng of PCR product and water up to 10 µl. Cycle sequencing conditions were carried out with an initial denaturing temperature of 96ºC for 1min, followed by 25 cycles of 96˚C for 10 sec, 50˚C for 5 sec, 60˚C for 1min15sec, and a final hold at 4˚C. The sequences were analyzed in an ABI 3130 XL Genetic Analyzer (Applied Biosystems, Foster City, CA). Individual sequences were checked by eye and edited using MEGA© version 5 (Tamura et al., 2011), with the final alignment of all sequences for each loci being performed in BIOEDIT© version 7.0.9.0 (Hall, 1999). The single loci were then
12 concatenated into larger sequences to have all regions of the mtDNA to be analysed as a single loci. It is important to note that no information regarding sampling location was associated to the sequences in order to ensure blind analysis of the DNA (Heckman et al., 2006), although for each individual was identified with a number.
2.1.2. Microsatellite amplification and genotyping
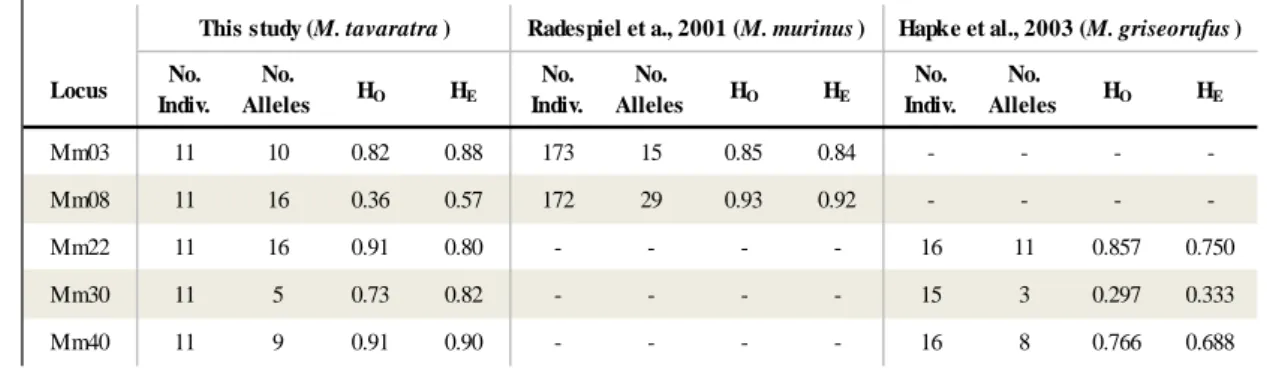
Genetic markers developed for another species, the M. murinus species, were used in this study. This was because there were no microsatellite markers designed for M. tavaratra and as markers for M. Murinus have been shown to provide good results when tested across different mouse lemur species (Radespiel et al., 2001; Hapke et al., 2003). Five polymorphic dinucleotide microsatellite loci were used to genotype 11 individuals from each fragment (table 1). The microsatellite loci were amplified in a 10µl reaction containing 0.15mM of each primer, 5 µl of My Taq HS Mix (Bioline-25045) and 1µl of template DNA. An initial denaturation of 15 s at 94°C was followed by 36 cycles of 30 s at 94°C, 1 min at 55-58°C, 1 min at 72°C, and a final extension at 72°C for 10 min. Negative controls were used in every PCR reaction in order to check for contamination. Primers were labelled with a fluorescent dye (either Hex or FAM) and amplification products were genotyped using ABI 3130 DNA equipment.
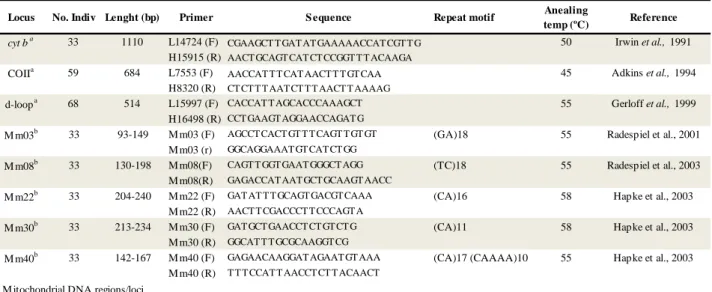
Table 1: Mitochondrial and nuclear DNA loci genotyped in this study. Table 1: M icrosatellite and nuclear DNA loci used in this study
cyt ba 33 1110 L14724 (F) CGAAGCT T GAT AT GAAAAACCAT CGT T G 50 Irwin et al., 1991
H15915 (R) AACT GCAGT CAT CT CCGGT T T ACAAGA
COIIa 59 684 L7553 (F) AACCAT T T CAT AACT T T GT CAA 45 Adkins et al., 1994 H8320 (R) CT CT T T AAT CT T T AACT T AAAAG
d-loopa 68 514 L15997 (F) CACCAT T AGCACCCAAAGCT 55 Gerloff et al., 1999 H16498 (R) CCT GAAGT AGGAACCAGAT G
M m03b 33 93-149 M m03 (F) AGCCT CACT GT T T CAGT T GT GT (GA)18 55 Radespiel et al., 2001 M m03 (r) GGCAGGAAAT GT CAT CT GG
M m08b 33 130-198 M m08(F) CAGT T GGT GAAT GGGCT AGG (TC)18 55 Radespiel et al., 2003 M m08(R) GAGACCAT AAT GCT GCAAGT AACC
M m22b 33 204-240 M m22 (F) GAT AT T T GCAGT GACGT CAAA (CA)16 58 Hapke et al., 2003 M m22 (R) AACT T CGACCCT T CCCAGT A
M m30b 33 213-234 M m30 (F) GAT GCT GAACCT CT GT CT G (CA)11 58 Hapke et al., 2003 M m30 (R) GGCAT T T GCGCAAGGT CG
M m40b 33 142-167 M m40 (F) GAGAACAAGGAT AGAAT GT AAA (CA)17 (CAAAA)10 55 Hapke et al., 2003 M m40 (R) T T T CCAT T AACCT CT T ACAACT
a
M itochondrial DNA regions/loci
b
Nuclear markers (microsatellites)
Reference
Locus S equence Repeat motif Anealing
temp (ºC) Lenght (bp)
13 3. Lemur taxonomy and genetic diversity
3.1. Phylogenetic trees
The geographic distribution and taxonomy of lemurs is still under debate, and this is true for mouse lemurs (Weisrock et al., 2010; Markolf et al., 2011). Moreover, several regions of Madagascar are known to harbour more than one mouse lemur species. As noted above only two individuals from the Daraina region have been sequenced to date and both have been assigned to the M. tavaratra species together with individuals from surrounding regions (Weisrock et al., 2010). In order to determine whether our samples belonged to the same clade or species, phylogenetic reconstructions were carried out. Four mtDNA sequences belonging to four mouse lemur species (M. tavaratra, M. mittermeieri, M. sambiranensis and M. simmonsi) downloaded from GenBank (NCBI) were used as the reference sequences. These four species were specifically selected based on the fact that they are geographically distributed around and close to the Daraina region (Mittermeier et al., 2010; Weisrock et al., 2010). Loci cyt b and COII were concatenated for all the sampled individuals and for the GenBank sequences. (see Annex, table 3 for details on GenBank sequences)Thehylogenetic tree was drawn with the aim to find out to which group our samples fit best. Phylogenetic trees per loci were also performed in order to avoid lost of information due to short sequences or missing sites (see Annex – figures 1-3).
According to the results obtained in the first phylogenetic tree constructed, we then performed the same analysis including the d-loop region but only using M. tavaratra sequences (1 sequence from Weisrock et al. (2010), 1 from Yoder et al., (2000) and 4 from Olivieri et al., (2007). This tree allowed us to detect if a possible population structure was present in our data set. The evolutionary model that best fits the data for each phylogenetic tree was calculated in jModelTest© 0.1.1 (Posada, 2005). In this case, the test used 40 candidate models to determine which one had less information lost, according to Akaike Information Criterion (AIC). All model types (equal/unequal base frequencies (+F), with/without proportion of invariable sites (+I) and with/without rate variation among sites (+G)) were included in the calculations. The phylogenetic
14 trees were then constructed using MEGA© version 5 (Tamura et al., 2011) under the best fitting model using a maximum likelihood (ML) method and 1000 bootstrap replicates. Note that different evolutionary models were used for the different mtDNA regions (table 2).
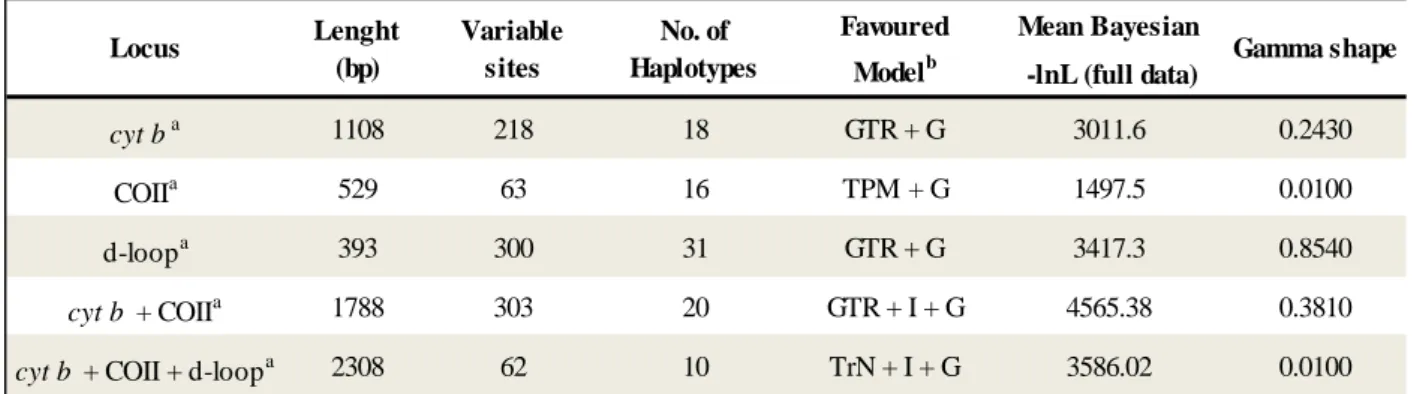
Table 2: Evolutionary models for phylogeny inference.
3.2. Genetic diversity indexes
The aim here was to characterize the population structure using both, mtDNA and microsatellite data. Analysis were performed using the commonly used statistics to study population structure such as FST statistics, analysis of molecular variance (AMOVA) and
clustering methods in STRUCTURE.
3.2.1. mtDNA
Haplotype diversity (Hd), defined as the probability that two randomly chosen haplotypes are different, and nucleotide diversity (π), the average proportion of nucleotide differences between all possible pairs of sequences in the sample (Nei, 1989), were calculated using the mtDNAin the program DnaSP v5.0 (Librado and Rozas, 2009). An exploratory analysis was performed for the
Table 2: Evolutionary models.
These were selected in jModelTest to be used later in the construction of phylogenetic trees in MEGA v.5.
Mean Bayesian -lnL (full data) cyt ba 1108 218 18 GTR + G 3011.6 0.2430 COIIa 529 63 16 TPM + G 1497.5 0.0100 d-loopa 393 300 31 GTR + G 3417.3 0.8540 cyt b + COIIa 1788 303 20 GTR + I + G 4565.38 0.3810
cyt b + COII + d-loopa 2308 62 10 TrN + I + G 3586.02 0.0100
a
GenBank sequences were used for these calculations
b
Model selected according to the Akaike Information Criterion in the program jModelTest
Gamma shape Locus Variable sites No. of Haplotypes Favoured Modelb Lenght (bp)
15 genetic diversity indices. These were calculated (i) independently for the each mtDNA locus (COII, cyt b and d-loop) using 33 individuals, (ii) for the concatenated sequences using the same 33 individuals, and (iii) using all the individuals sequenced at the COII and d-loop regions(59 and 68 respectively). This genetic diversity results have shown to not vary with the number of samples used and with the number of sequences. For this reason most of the results and discussions are focused on the 33 individuals and in the largest data set for each mtDNA region (cyt b 33 indiv., COII 59 indiv., d-loop 69 indiv.).
The relationships among the haplotypes were also displayed using a median-joining network (Bandelt et al., 1999), constructed in NETWORK© v4.6.0.0 (available at www.fluxus-engineering.com). A network was built for each mitochondrial loci.
Genetic diversity for each forest was calculated in Genetix v4.05.2 (Belkhir et al., 1996/1997) and evaluated using the observed and expected heterozygosities (Ho and He) and the common measure FIS which detects if populations depart from the HWE.Pairwise FST were performed using
ARLEQUIN v3.11 (Excoffier, 2006) in order to look for genetic deifferentiation between populations. 10,000 permutations were performed in order to assess the significance of the estimated values.
A hierarchical analysis of molecular variance (AMOVA) was also performed using the conventional F-statistics, where the frequencies of haplotypes are used to test the significance of the variance components associated with various hierarchical levels of genetic structure (Excoffier et al., 1992). In this case, variation among and between populations was determined by means of a non-parametric permutation approach.
3.2.2. Nuclear DNA: microsatellites
Microsatellite data were obtained for the five loci from 33 individuals. Expected and observed heterozygosity (He and Ho, respectively), as well as the inbreeding coefficient (FIS, measuring
16 departures from HW proportions) were calculated per locus per populationusing Genetix v4.05.2 (Belkhir et al., 1996/1997). The significance of the deviations from HW equilibrium were determined by running 1,000 permutations per locus. Pairwise FST and AMOVA analyses (overall,
and locus by locus) were run in ARLEQUIN v3.11 with the significance of values being estimated from 10,000 permutations.
Further analysis based on genotypic information was performed using the program STRUCTURE 2.3.3 (2010). This program aims at identifying genetic clusters and requires the user to provide a minimum and a maximum number of genetic clusters (K). Runs were carried out with the “admixture model” and the “correlated allele frequency” model, without any prior information and with an initial alpha value of 1.0. The principle of this program is to group the data into k groups that are at HW and linkage equilibrium. Data are analysed for each given K value using a number of independent replicates (usually twenty) and a likelihood value is estimated under each K. We used as a minimum value K=1 and as maximum K=6, this choice was based on the Evanno et al.. (2005) study, which suggests to use a value larger than the number of samples: more precisely they suggest to add three to that number but this is admittedly an arbitrary number. In our case, since there were three forest fragments, K=6 seems more than reasonable. Altogether twenty independent runs of 60,000 iterations were performed for each K, with a burn in period of 20,000 generations.
17 4. Results
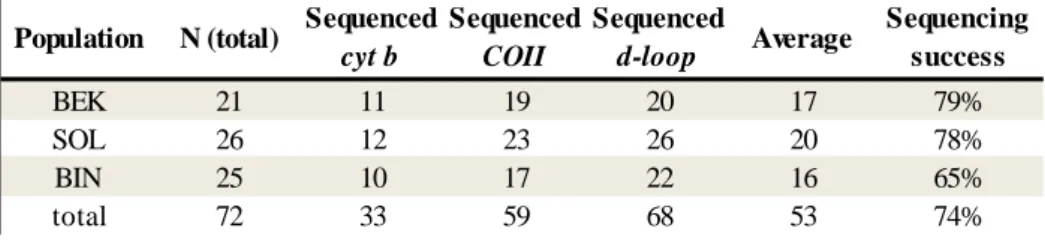
Altogether, DNA from all individuals could be easily extracted and amplified, but the sequencing success proved to be different across loci. Out of the 72 individuals 68, 59 and 33 individuals could be sequenced for the d-loop, COII and cyt b, respectively, giving an overall success rate of 74% (table 3). All individuals sequenced for the cyt b were also sequenced for the other two loci, allowing us to have concatenated data for 33 individuals.
Table 3: Rate of success for mtDNA sequencing of M. tavaratra tissue samples.
4.1. Phylogenetic analysis: the Daraina mouse lemurs belong to the M. tavaratra clade
The results of the jModelTest© 0.1.1 (Posada, 2005) analysis allowed us to identify the GTR +Γ +I (General Time Reversible model plus Gamma distribution and Invariable sites) as the best evolutionary
model for our data (i.e. the concatenated sequences of the 2 loci cytb and COII). but information for each
evolutionary model can be found in table 2.
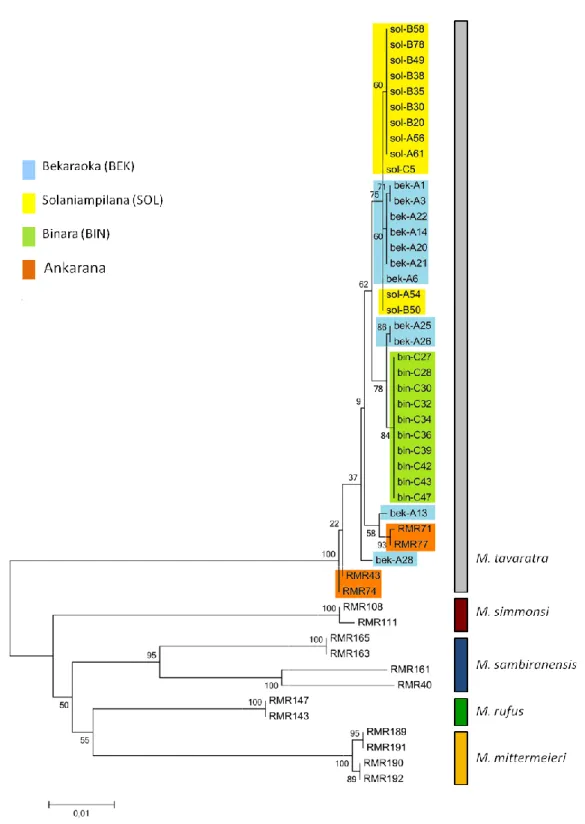
When we analysed our sequences together with the previously published M. tavaratra sequences and four other mouse lemur species (M. mittermeieri, M. sambiranensis, M. simmonsi and M. rufus), we found that the ML trees constructed for the two conserved mtDNA regions, grouped our samples together with the M. tavaratra individuals in one well-supported clade (Figure 3). This result was also found when the two genes were analysed independently (Annex Figures 1 & 2). The fact that these mtDNA genes exhibited the same pattern (grouping all M.tavaratra sequences) with high bootstrap values, strongly suggests that all our samples can be assigned to the
Table 3: Rate of success for mtDNA sequencing of M.tavaratra tissue samples
BEK 21 11 19 20 17 79% SOL 26 12 23 26 20 78% BIN 25 10 17 22 16 65% total 72 33 59 68 53 74% Sequencing success Population N (total) Sequenced
cyt b
Sequenced
COII
Sequenced
18 M. tavaratra species. Such defined clustering was not found in the d-loop region. In this tree it is possible to find M. sambiranensis in the same clade as our samples and the GenBank sequences of M. tavaratra and M. mittermeieri represented in the two main clades (see Annex – figure 3). This hypervariable region therefore exhibits similar haplotypes across species.
Figure 3: Phylogenetic tree for the mtDNA (cyt b and COII) of four Microcebus species. In this tree we have
19 Figure 4 represents the phylogenetic tree obtained from the concatenated sequences for 33 individuals for which the three loci were sequenced. This figure shows no simple grouping of the data, with the exception of the Binara samples which are monophyletic, due to the fact that only one haplotype was observed across the three loci (i.e. there was no mtDNA polymorphism in Binara, see below). The Solaniampilana samples exhibit some clustering but this is also probably due to a lower level of genetic diversity since several individuals from Solaniampilana also grouped with individuals from Bekaraoka. This last forest fragment exhibited the most divergent haplotypes, and had individuals in all the “clades” of the tree with the exception of the sub-clade comprising the Binara individuals.
4.2. Mitochondrial DNA diversity and differentiation within M. tavaratra
Sequence comparisons of 1,110 bp of mtDNA cyt b gene revealed 16 polymorphic sites for a total of 33 individuals from the 3 forests, of which 9 sites were parsimony informative. These polymorphisms defined 7 distinct haplotypes with a haplotype diversity of Hd=0.805 (± 0.036) and nucleotide diversity of π=0.0031 (± 0.0004). Since the sample size for the cytb gene was smaller than that of the other two mtDNA loci (59 and 68 individuals for the COII gene and the d-loop, respectively) one could argue that the lower cytb diversity is likely to be underestimated. We therefore compared the results obtained for the same 33 individuals to the results obtained with the larger sample sizes for the other two mtDNA regions and found that they did not significantly differ from the smaller data set (see Annex – table 4). This suggests that the diversity calculated for the cytb is probably not strongly underestimated.
Six haplotypes were identified for the COII gene (684 bp), with 9 sites being polymorphic (8 were
parsimony informative) and Hd=0.645 (± 0.042) and π=0.004 (± 0.0002). The control region (d-loop, 514 bp) showed high haplotype diversity across all populations (Hd=0.805 ± 0.001) and a high nucleotide
20 diversity (π=0.021 ± 0.001). Polymorphism was found for 43 sites, with 36 parsimony informative sites,
and these mutations resulted in 13 distinct haplotypes.
As presented in table 4, the three populations showed variable levels of genetic diversity with Binara and Solaniampilana exhibiting either no diversity or very low nucleotide diversity for the mtDNA regions amplified, whereas Bekaraoka exhibited much higher levels, at both the haplotype and nucleotide diversity level. There were clear differences across loci. Whereas Bekaraoka population revealed high haplotype diversity for all loci, Solaniampilana had intermediate diversity for the d-loop and cyt b regions, but a lower value for the COII gene. However, the most striking result was the lack of diversity found for the Binara fragment. All the individuals (N=22) showed the same haplotype for all mtDNA region. When the same analyses were performed for the concatenated sequences, a similar pattern was observed for each population (table 4).
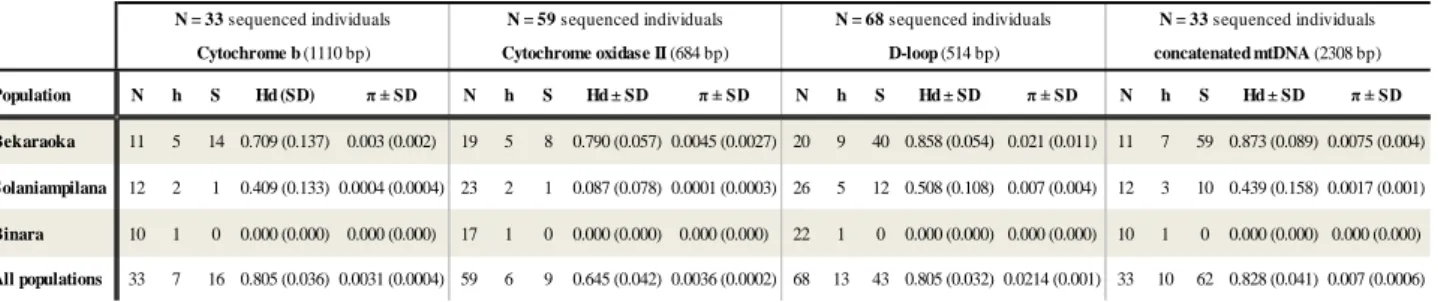
Table 4: mtDNA haplotypes and nucleotide diversity. Genetic diversity was calculated for the largest sample size of each forest fragment, for each mtDNA locus. A set of 33 individuals with concatenated sequences for the three loci was also analysed.
Genetic differentiation between the forest fragments showed that all pairwise FST values were
significant at the locus level and for the concatenated sequences (table 5). Overall, the most distinct population was Binara showing FST values ≥0.516 as expected for a sample having one
fixed haplotype.
Table 4: mtDNA haplotype and nucleotide diversity.
Genetic diversity was calculated for the largest sample size of each forest fragment, for each mtDNA locus. A set of 33 individuals with concatenated sequences was also analysed.
Population N h S Hd (SD) π ± SD N h S Hd ± SD π ± SD N h S Hd ± SD π ± SD N h S Hd ± SD π ± SD
Bekaraoka 11 5 14 0.709 (0.137) 0.003 (0.002) 19 5 8 0.790 (0.057) 0.0045 (0.0027) 20 9 40 0.858 (0.054) 0.021 (0.011) 11 7 59 0.873 (0.089) 0.0075 (0.004)
Solaniampilana 12 2 1 0.409 (0.133) 0.0004 (0.0004) 23 2 1 0.087 (0.078) 0.0001 (0.0003) 26 5 12 0.508 (0.108) 0.007 (0.004) 12 3 10 0.439 (0.158) 0.0017 (0.001)
Binara 10 1 0 0.000 (0.000) 0.000 (0.000) 17 1 0 0.000 (0.000) 0.000 (0.000) 22 1 0 0.000 (0.000) 0.000 (0.000) 10 1 0 0.000 (0.000) 0.000 (0.000)
All populations 33 7 16 0.805 (0.036) 0.0031 (0.0004) 59 6 9 0.645 (0.042) 0.0036 (0.0002) 68 13 43 0.805 (0.032) 0.0214 (0.001) 33 10 62 0.828 (0.041) 0.007 (0.0006)
N = 33 sequenced individuals N = 59 sequenced individuals N = 68 sequenced individuals N = 33 sequenced individuals Cytochrome b (1110 bp) Cytochrome oxidase II (684 bp) D-loop (514 bp) concatenated mtDNA (2308 bp)
21 Table 5: Genetic distances among study populations. Population pairwise FST are represented below the
diagonal line and they are highly significant as p-values (above the diagonal line) are exactly equal to zero.
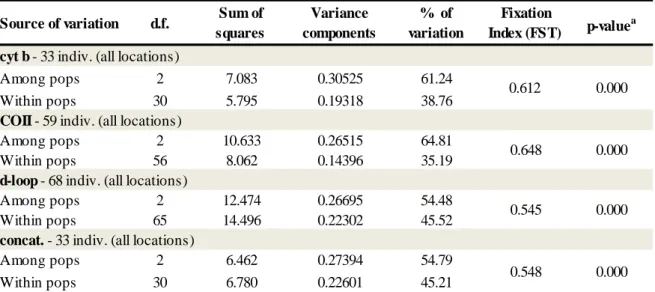
The hierarchical AMOVA based on haplotype frequencies revealed that for the two conserved mtDNA genes (cyt b and COII), 61 to 65% of the total variation was within populations and 35 to 39% was among populations (table 6). When this analysis was performed for the d-loop hypervariable region and for the concatenated sequences, the difference between the variations within and among populations were less evident indicating, nevertheless, higher levels of genetic differentiation within populations (45% within populations and 54% among populations).
Table 6: AMOVA results of Microcebus species from three forest fragments in Daraina. Table 5: Genetic distances among study populations.
BEK SOL BIN BEK SOL BIN BEK SOL BIN BEK SOL BIN
BEK 0.000 0.000 0.000 0.000 0.000 0.000 0.000 0.000
SOL 0.432 0.000 0.345 0.000 0.321 0.000 0.339 0.000
BIN 0.632 0.779 0.516 0.950 0.562 0.730 0.549 0.763
cyt b COII d-loop 3 loci concatenated
Population pairwise FST are represented below the diagonal line and they are highly significant as p values (above
the diagonal) are exactly equal to zero.
Table 6: AMOVA results of Microcebus spp from three forest fragments in Daraina.
cyt b - 33 indiv. (all locations)
Among pops 2 7.083 0.30525 61.24
Within pops 30 5.795 0.19318 38.76
COII - 59 indiv. (all locations)
Among pops 2 10.633 0.26515 64.81
Within pops 56 8.062 0.14396 35.19
d-loop - 68 indiv. (all locations)
Among pops 2 12.474 0.26695 54.48
Within pops 65 14.496 0.22302 45.52
concat. - 33 indiv. (all locations)
Among pops 2 6.462 0.27394 54.79
Within pops 30 6.780 0.22601 45.21 0.548 0.000
a
Probability of finding a more extreme variance component and FST index than observed by chance alone after 1000
permutations.
p-valuea
0.612 0.000
0.648 0.000
0.545 0.000
Source of variation d.f. Sum of squares Variance components % of variation Fixation Index (FST)
22 Haplotype networks were drawn for each locus and for the concatenated data (Figure 4). Binara only exhibits one haplotype for each mtDNA region, and this haplotype is shared only with individuals from Bekaraoka population for COII and d-loop regions. The Solaniampilana and Bekaraoka populations always share one haplotype for all the mtDNA regions analysed. As individuals from Bekaraoka were found to have less genetic differences with the other populations, the locations of the traps where the individuals were captured were placed on a map from Daraina (figure 2).
4.3. Microsatellite diversity within M. tavaratra
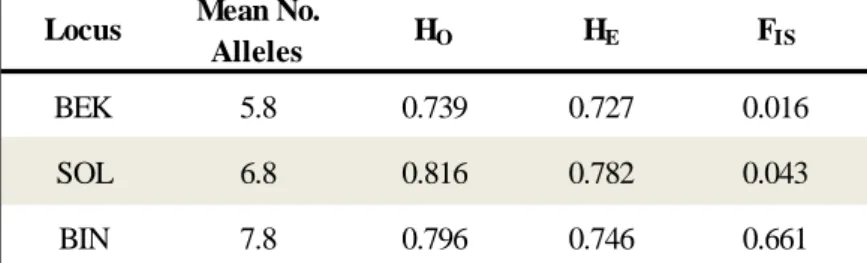
All of the five nuclear loci were amplified for 33 individuals, most of them the same for which the 3 mtDNA loci had been amplified. All loci analysed were polymorphic with a minimum of 3 and a maximum of 11 alleles (table 3). Overall, none of the FIS values were significantly different
from zero, so the three populations showed no departure from HWE, despite the fact that the loci were originally developed for another mouse lemur species (M. murinus). Hence, all the data was kept in the analysis.
Interestingly, the microsatellite results differed strongly from those obtained with the mtDNA. The population that had previously shown no variation (Binara) was variable for the 5 nuclear loci, exhibiting the highest number of alleles per locus (table 7).
Table 7: Nuclear DNA diversity calculated for each populations when 5 microsatellite loci were analysed.
*None of the p-values for the FIS are statistically significance.
BEK 5.8 0.739 0.727 0.016
SOL 6.8 0.816 0.782 0.043
BIN 7.8 0.796 0.746 0.661
Locus Mean No.
23 The AMOVA showed that around 94% of the variation corresponds to within populations’ diversity, hence
showing that the populations are very little differentiated from each other at the microsatellite level, as
opposed to the result obtained with the mtDNA loci, where higher variation was found within populations.
Table 8: AMOVA results for the microsatellite data obtained in this study.
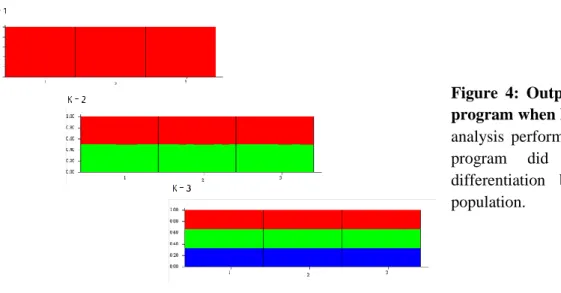
Although the AMOVA had shown no variation among populations, a population structure analysis was performed in STRUCTURE 2.3.3 (2010) using different K values (number of possible populations) in order to determine if any differentiations did exist. The results revealed by the Structure program support the low differentiation among populations, classifying all individuals as belonging to the same population, whichever the total number of clusters used (figure 6).
Figure 4: Output from Structure program when k=1, 2 and 3. In the analysis performed in structure, the program did not detect any differentiation between the three population.
Among pops 9.258 0.121 5.84
Within pops 123.62 1.958 94.16
aProbability of finding a more extreme variance component and F
ST index than
observed by chance alone after 1000 permutations.
p-valuea 0.058 0.000 Source of variation Sum of squares Variance components % of variation Fixation Index (FST)
24 5. Discussion
5.1. Samples and laboratory techniques
Testing several extraction protocols, as well as optimizing DNA amplification and sequencing, can be a time demanding task but it is extremely useful for improving results’ quality and to ease on future work which use similar methods. Given that I was involved in the project around several lemur species for which hundreds of samples were collected, a crucial issue was to develop efficient methods that would also be cheap. This was the case for the faecal samples of sifakas (more than 1500 faecal samples have been collected for P. coronatus and P. coquereli) but also for the mouse lemurs for which more than 400 individuals are expected to be collected for the long-term project. Out of all three methods tested (Annex – table 1), the mammalian DNA isolation protocol adapted from Laird et al.,(1991) protocol was considered the best for several reasons. It yielded good DNA, used few organic solvents hence reducing health hazard and associated pollution, offered the lowest budget and it could be performed in one single day, after over-night digestion.
This study aimed to use a data set of 20 to 25 individuals per forest fragment, but this was not always the case. The lowest number of samples per fragment for which genetic analysis was performed was ten. While this number is not very high I should stress that for endangered species, the number of individuals genotyped can typically be smaller depending on the ease of access and species. For the longer term I expect to genotype more individuals but for this Masters project this is still a reasonable number of samples in comparison to several previous lemur phylogenetic and population genetics studies (For instance, Schneider et al., (2010) used a large sample of 195 M. murinus individuals from 15 locations but only analysed one mtDNA locus and no microsatellite data). In a recent study Markolf et al., (2011) tried to estimate the minimum number of individuals that should be analysed per sampled location to determine whether genetically differentiated populations can be identified as putative species. Their work focused on mouse lemurs from the southwest of Madagascar and used a simple permutation approach using genetic data from the
d-25 loop mtDNA region. They suggested that ten individuals per location was the minimum required number of individuals sampled per location in order to avoid false positives. In our case this did not seem to be problematic since the only monophyletic group associated to a forest fragment (Binara) had a minimum of 10 individuals sequenced, and in fact it suggests that the number of individuals sequenced here was reasonably high. This was also confirmed by the analysis of larger samples for the different mtDNA loci. Overall, the sequencing success rate for our samples was 74% and our results suggest that the larger the locus to be amplified, the lower the sequencing rate. Because we used good quality DNA (tissue, as opposed to faecal material), only samples which provided bad sequences were repeated two or three times. For the nuclear DNA (microsatellites), most genotypes could be read on the first amplification and only one repetition was performed for those individuals for which the genotype was potentially problematic (no alleles, or possible missing allele).
5.2. Only one Microcebus species appears to be present in Daraina
Species delimitation is a complex but crucial issue for understanding the factors driving the diversification of biota (Wilmé et al., 2006) and for defining regions of conservation priority, defined as hotspots (Markolf et al., 2011). In this study, one of the main aims was to determine if all the individuals sampled in the three forest fragments of Daraina belonged to the same species and if these could be assigned to a previously described Microcebus species recorded in the same area (M. tavaratra) by Weisrock et al., (2010). Our results did not show high genetic divergence among lineages and all our samples grouped with the M. tavaratra reference sequences in one
monophyletic clade with very high statistical support. We can thus confidently suggest that all our samples
belong to the same species. Another result was that the tree depth was much less important for M. tavaratra
than for some of the other mouse lemur species, hence suggesting that perhaps only part of the species
haplotypic diversity has been uncovered for some species, and that more individuals should be analysed in
26 species should use several individuals per location to validate monophyly of putative species sampled across sometimes wide areas. Markolf et al., 2011 suggest using at least ten individuals per forest fragment. While it should be clear that this number is, to a large extent, arbitrary and should not be taken at face value, it is worth mentioning that in most previously published genetic studies less than five individuals are usually used to “define species”. In Daraina, Weisrock et al. (2010) only used two individuals from two forest fragments to define the specimens’ species.
We did, however, find that some species did not appear as monophyletic when a phylogenetic tree was
constructed for the most variable region of the mtDNA amplified in this study (d-loop locus). Actually, two
species showed individuals belonging to the two main clades, namely M. tavaratra and M. mittermeieri
(figure 3 in Annex). The fact that these two species have individuals belonging to different clades is not
necessarily surprising as the d-loop sequences exhibited high nucleotide diversity with 300 polymorphic
sites out of 389bp sequence length (table 2).
This amount of polymorphic sites across the five species, suggests that homoplasy is very high and therefore that this locus cannot be used to estimate species divergence, for this group of species and is better adapted to monitor within species diversity. The fact that M. mittermeieri and M. tavaratra had sequences in the two most divergent clades suggests that these two species may have larger effective population sizes than the other species. Another possibility is that it might be related to the geographical distribution of the individuals sampled.
In this study we chose to use phylogenetic trees as these are a useful tool for establishing genealogical
relationships among a group of organisms and therefore species identification (Clement et al., 2000), but it
would be interesting to perform the same analyses with a program that constructs phylogenetic networks, as
more information might be obtained (i.e. hybridization, horizontal gene transfer) (Huson and Scornavacca,
27 5.3. Genetic diversity
Genetic indices can provide valuable information on the recent evolutionary history of species and on possible changes of their environment and habitat (Goossens et al., 2006; Fouquet et al., 2007; Rezende et al., 2009). Evolutionary changes, including past or recent expansions or contractions due to human or natural effects, selection events, together with other species characteristics such as the social structure, can all affect patterns of genetic diversity (Gaggioti et al., 2009). Recent years have seen an increase in the number of studies trying to infer populations or environmental changes from the analysis of several genetic markers (Avise et al., 2000). This study is thus important as it provides the first within species diversity data for M. tavaratra.
5.3.1. Mitochondrial DNA variation in M. tavaratra
One of the most surprising result obtained in this study was the lack of genetic diversity in the Binara forest across all mtDNA loci despite the fact that the other fragments (Bekaraoka and Solaniampilana), appeared to maintain a high level of haplotype diversity. While this seemed very surprising at first we also found that not much variation was found at the nucleotide level for the Solaniampilana fragment, even for the most variable region (d-loop: π=0.007 ± 0.004). Different species and social units, as well as sampling areas pose some difficulties for scaling genetic diversity across studies, but the values of genetic diversity obtained in this study do not disagree much with previous studies (i.e. Matocp and Villablanca, 2001; Radespiel et al., 2008), with the exception of Binara.
When we compare the three fragments it is unclear why the levels of genetic diversity would be very different between these. For instance, the vegetation in Bekaraoka and Solaniampilana is classified as dry deciduous whereas Binara is an evegreen forest. We should mention here that originally different habitats were thought to play an important role in the distribution of Microcebus species across Madagascar, causing a division between eastern wet-adapted and western dry-adapted mouse lemurs. However, Yoder et al., (2000) have demonstrated that a