299
Abstract
The exploitation of low-grade iron ore deposits represents the current scenario for this business. Thus arise several types of research that aim at improvements and innovations as solutions to such situation. Therefore, herein, suggested is an alternative route for iron ore flotation that targets a higher mass recovery with concentrate within the market specification. First, the sample was deslimed at 38 μm and with the under-flow a cut was performed in the 74 μm cyclone in order to separate the coarse particles from the fine. With the coarse particles, i.e. with the underflow, there a reverse flota-tion was carried on obtaining a concentrate with 67.7% of Fe and 0.9% of SiO2. In the fine particle overflow, direct flotation was done, generating a low-quality concentrate with 40.9% of Fe and 39.7% of SiO2. The mass recovery in direct flotation was 88% and in the reverse flotation was 61.1%. The concentrate generated from two flotations had a mass recovery of 67.4% with a content of Fe of 53.4% and 21.6% SiO2.
Keywords: iron ore, flotation circuits, reverse flotation. Fabio de São José
http://orcid.org/0000-0003-2500-8415 Doutorando Engenharia Mineral
Universidade Federal de Ouro Preto - UFOP Escola de Minas
Departamento de Engenharia de Minas Ouro Preto - Minas Gerais – Brasil [email protected]
Emanuela Reis Brod
Geóloga
Serviço Geológico do Brasil - CPRM Teresina - Piauí - Brasil [email protected]
Carlos Alberto Pereira
Professor Associado
Universidade Federal de Ouro Preto - UFOP Escola de Minas
Departamento de Engenharia de Minas Ouro Preto - Minas Gerais – Brasil [email protected]
Simultaneous use
of direct and reverse
flotation in the production
of iron ore concentrate plant
Mining
Mineração
http://dx.doi.org/10.1590/0370-44672017710103
1. Introduction
The processes for iron ore concentra-tion that stand out are the gravitaconcentra-tional methods, magnetic separation, and flota-tion. And among these, flotation has al-lowed the concentration of low-grade ore fines. Flotation is a procedure that began to be applied in the mineral industry in the early twentieth century. With a few innovations, the use of flotation was in-tensified and today it is the predominant technique in the area of mineral concentra-tion (Sampaıo and Baltar, 2007).
Iron ore flotation shows good per-formance for the concentration of oxi-dized ores with low iron content, allowing the reduction of silica found in magnetic concentrated and therefore it is the most suitable process for the production of concentrates intended for metallurgical processes that use a direct reduction pro-cess (Iwasaki, 1983).
According to Araujo and Peres
(2006), the flotation routes that can be used for iron ore are:
• Cationic reverse flotation of quartz; • Anionic flotation of iron oxides; • Anionic reverse flotation of acti -vated quartz.
The cationic reverse flotation of quartz is the most commonly used route: quartz is floated with ether amines par-tially neutralized with acetic acid, and the iron ore is depressed by unmodified starches (Yang, 1988).
The cationic reverse flotation of quartz is preferred for iron ores, due to the high selectivity achieved and the fact that the iron-bearing minerals are in greater portion than the gangue, minimizing
col-lector consumption (Costa, 2009).
Another relevant fact on reverse flotation is the high density of miner-als of interest compared to the gangue. It is important to note that for better
flotation with foam, the mineral ores
should be finely ground (Chaves and
Leal Filho, 2004).
The direct flotation of iron oxides consequently has potential application for low-grade ores and recovery materials in dams (Araujo and Peres, 2006).
The anionic direct flotation of iron oxides is an attractive route for low-grade ores and tailings deposited in the tailings dams. The anionic reverse flotation of activated quartz was used during the time that the amines were not available.
300
Usually with desliming before the reverse flotation and in certain types of iron ore, the attrition increases the mass recovery and reduces the levels of both iron as contaminants, with a gain of Gaudin’s selectivity. The attrition improves performance and reduces con-sumption of the collector (Krishnan and Iwasaki, 1984).
The fine particles removed in the process of desliming usually are rich in silica and alumina, and other undesirable
elements like phosphorus because of the concentration of friable minerals, such as goethite and kaolinite, is greater in the fines. So the desliming process increases the total iron content of ore to be floated
(Queiroz, 2006; Donskoi et al., 2008; Totou, 2010).
Herein presented are the results of the study of an alternative route to flota-tion processes convenflota-tionally used for iron ore, without the inclusion of unit operations, in order to increase the mass
recovery and ensure the quality of the concentrates generated.
The proposed route is that after the desliming operation adopted in traditional reverse flotation circuit, a cut is made in the cyclone for separating the fine particles from coarse particles. The coarse particles are floated by the reverse flotation method with the use of conventional reagents. The fine particles are floated directly with the use of reagents studied in partnership with
the Clariant Company.
2. Materials and methods
Initial characterization
The study was conducted with an iron ore sample from the Quadrilátero Ferrífero, Minas Gerais, Brazil. After milling until 95% of the material passes in 150 μm, wet sieving and a chemical analysis of each fraction were carried out.
For the mineral liberation study, the Gaudin method was used, where at least five hundred particles were counted and their mineral of interest
composition estimated.
All chemical analysis performed in this study were made through atomic emission spectroscopy with a plasma source.
The mineralogical character-ization was conducted by an opti-cal microscope (Z eiss —A xioplan model), whereupon the results were refined in a Scanning Electron Mi-croscope (SEM) and QS (FEI Quanta
650 SEM operating at 25 kV and
10 nA equipped with two EDS Bruker SDD 5030).
The analyses by x-ray diffraction
(XRD), using the powder method,
were performed with a PANalytical device and the qualitative interpreta-tion of the spectra was performed by
comparison with PDF02 standards contained in the database (ICDD
2006) Plus software in HighScore.
Ore preparation
The formation of mass for the tests included initial screening stages, crushing
the retained material in a conical Crusher
(opening equal to 4.0 mm) and then in a roller crusher (opening of 0.6 mm). About 60 kg were formed, homogenized and divided into fractions of 2 kg destined to:
• initial wet sieve analysis in the fol
-lowing mesh sieves: 212; 150, 106, 74, 44
and 38 µm in order to estimate the initial time of grinding.
• wet grinding in a mill jar of
0.20 x 0.30 m, using 20 steel bars 1˝ and 60% solid concentration.
The milled product was homog-enized and divided in a rotating divisor of
pulps for the following analyses:
• 01 fraction of approximately 50 g
for the determination of the actual density
by gas pycnometer (1200 Quatachrome); • 01 fraction of approximately 250 g
for mineralogical analysis;
• 01 fraction with the rest of the
material for chemical analysis for the range of sizes.
Particle size analysis was done by wet sieving (sieve meshes were equal to
150; 106; 74; 44 and 38 µm). Pulverization
and sending the fractions retained by each sieve to chemical analysis.
T he sample (af ter grinding, P95 < 150 μm) was deslimed in a
cyclone with cut of 38 μm and the overflow and underflow were chemi-cally analyzed. The overflow was filed. And part of underflow obtained was subjected to a reverse flotation method on the terms traditionally used in iron
ore projects in the CDM: Denver cell D12; 50% solids; 2.5 L tank; 1200 rpm rotation; depressant: corn starch in 550 g/t of dosage; NaOH for gela
-tinization; Collector: Flotigan amine 3C Clariant (EDA) with dosage of
400 g/t of SiO2; pH 10.5 (adjusted with NaOH). The conditioning time was 3 minutes for the starch and 1 minute for the amine.
Reverse and direct flotation tests
The remainder of the underflow was forwarded to a cyclone device again (classification cut of 74 μm), and with the new underflow obtained a re-verse flotation was performed, under the same conditions described above. A direct flotation was made with the overflow from the same classifica-tion under the following condiclassifica-tions:Denver cell D12; 50% solids; 2.5 L tank; 1200 rpm rotation; depressants: Genamin (FQ7) of Clariant with dos
-age of 600 g/t; collector: 5806 Floti
-gam-25 (fatty acid) of Clariant with dosage of 600 g/t; pH 7 (adjusted with HCl). Conditioning times were of 5
minutes for the FQ7 and 2 minutes for the fatty acid. Another set of tests in the same dosages involved the
collec-tor: Flotigam EDA of Clariant and the
depressor: cornstarch of Unilever S.A. Finally, a total of 18 independent tests
were run. Chemical analyses were per -formed on all products generated in each step described above. The results obtained in the traditional test were
compared with the results obtained in the alternative circuit in terms of mass recovery and concentrate levels to assess the proposed route.
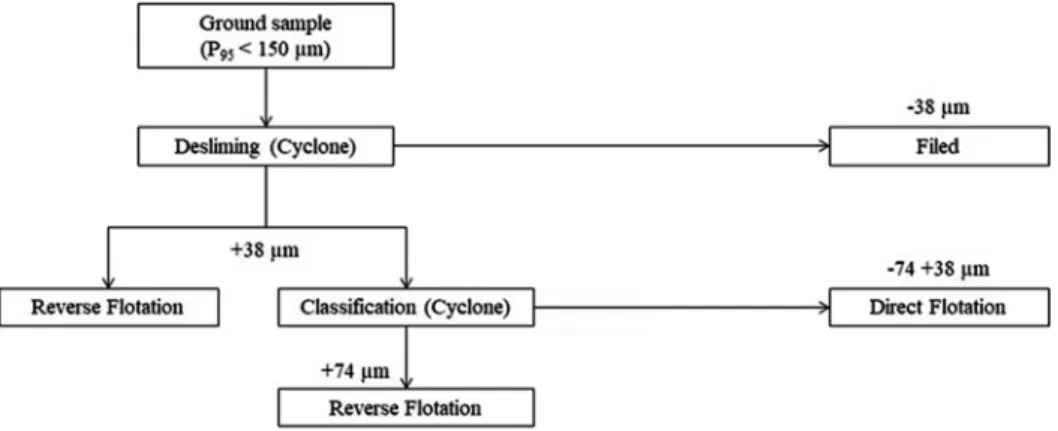
The tests were designated as fol-lows (Figure 1):
Test 1: reverse flotation products
made with the underflow of desliming;
Test 2: reverse flotation products
made with the underflow of classification;
301 Figure 1
Testing flowchart.
3. Results
Initial characterization
In Table 1, the results of chemical analysis by range of sizes and global sample are presented. It is observed that the initial content of Fe in the sample
was 44% and 34.9% of SiO2. Although the fraction 38 µm has high iron con-tent, the levels of deleterious elements are very high compared with the other
fractions. For that reason, desliming was adopted that aimed at a separation of 38 µm in order to reduce the levels of undesirable elements.
Sample granulometry
(µm)
(%)
(ppm) P Al2O3 CaO MgO Mn SiO2 TiO2 FeO Fe PF
Global 0.485 0.041 0.082 0.192 34.9 0.029 1.68 44.0 1.43 374.34 150 0.257 0.042 0.084 0.268 39.3 0.023 2.87 41.5 1.44 367.86 106 0.183 0.031< 0.035 0.182 46.7 0.016 2.30 36.1 1.14 296.86 74 0.186 0.031< 0.034 0.141 46.0 0.016 2.48 36.8 0.99 275.67 44 0.205 0.031< 0.043 0.135 38.3 0.022 2.27 42.2 1.02 282.08 38 0.239 0.031< 0.063 0.135 28.8 0.031 1.96 48.5 1.00 298.47 < 38 1.091 0.059 0.148 0.290 21.8 0.049 1.42 51.5 2.18 585.98 Table 1
Chemical analysis by size range of the sample that was grinding.
The mineralogical composition is presented in Table 2. The main
source of iron is hematite; quartz
represents more than 90% content of silica. The kaolinite is responsible for more than 30% content of Al2O3, and
almost 70% of Al2O3 was associated with goethite.
Minerals Structural formula Proportion (%)
Hematite Fe2O3 49
Goethite and Limonite FeO·OH 7
Magnetite Fe2
3+, Fe2+O
4 7
Mn oxi-hydroxides MnOx < 1
Quartz SiO2 37
Kaolinite Al2Si2O5(OH)4 Dash
Talc Mg6Si8O20(OH)4 Rare
Amphibole (Mg,Ca, Na, K)2-3(Mg,Fe,Al,Ti,Mn,Cr,Li,Zn)5(Si,Al)8(OH)2 Rare Table 2
Mineralogical composition of initial sample.
By washing, 6.5% of the sample was discarded as slimes. And the re-maining 93.5% proceeded to the next step and whose iron content was 44.3% and silica equal to 34.7%. The
mineral-ogical characterization by X-ray diffrac-tion showed that the overflow sample was rich in talc and kaolinite, while in the sample from the underflow, these minerals were not detected.
In general, the liberation degree
(LD) of oxides/hydroxides and gangue (LD 95%-100%) of the sinter feed and
302
Figure 2
Liberation degree (LD) of oxides/hydroxides and gangue.
The occurrence of these minerals is shown in Figure 3, representing the electronic image obtained by SEM. In
textural terms, the samples were charac-terized by the presence of granular quartz crystals with granulation "average" and
"thin" having minor variations related to amphibole and goethite, according to Figure 3.
Figure 3
The electronic image
of iron ore sample - Quanta 650 SEM.
Flotation tests
Table 3 presents the data regarding the mass recovery, along with the levels of concentrate and tailings generated in the test 1, test 2 and test 3 shown in the order of largest recovery and iron content.
Chemical analysis of the concen -trated revealed a 67.70% iron content and 0.68% silica, the mass recovery of con-centrate was 54.4% and the metallurgical
recovery was 85.5% (Test 1).
The next step was the classification (cut of 74 μm) in which there were ob-tained portions of 55.76% of mass for the underflow, with Fe content of 48.13% and 29.7% of silica. With 44.24% of the total, the overflow presented levels of Fe and 37.1% and 44.0% of SiO2. The overflow contents are consistent for applications
using the direct flotation method.
Table 3 also presents the data for the mass recovery and the contents of concen-trate and tailings generated in test 2. The concentrate obtained from the reverse flo-tation of underflow after classification had in its composition about 67.71% of Fe and 0.88% of silica. Mass recovery was 61.1% and metallurgical recovery was 85.4%.
Product (%) (ppm)
Mass recovery Al2O3 CaO MgO Mn SiO2 TiO2 FeO Fe LI P
T
est 1
Concentrated 54.4 0.203 0.037 0.035 0.256 0.68 0.036 3.05 67.70 1.72 458.55 Tailings 45.6 0.242 0.034 0.092 0.050 76.42 0.019 0.70 15.16 0.45 232.12
T
est 2
Concentrated 61.1 0.203 0.037 0.035 0.256 0.88 0.036 3.05 67.71 1.72 394.15 Tailings 38.9 0.242 0.034 0.092 0.050 76.42 0.019 0.70 15.16 0.45 230.01
T
est 3
Concentrated 88.04 0.203 0.037 0.035 0.256 39.67 0.036 3.05 40.93 1.72 368.77 Tailings 11.96 0.242 0.034 0.092 0.050 76.42 0.019 0.70 15.16 0.45 < 230
LI: Loss on Ignition
Table 3 Flotation test results.
Mass recovery data and contents of the concentrate and tailings gener-ated in test 3 are presented in Table 3
too. The iron content of the concen-trate was 40.93% and 39.67% silica. The mass recovery of concentrate was
88.04% and metallurgical recovery was 89.0%.
4. Discussion
The results obtained in the tradi-tional circuit met the standards of mar-ket specification, with exception to the
phosphorous content which was higher. Already concentrated results generated in reverse flotation of the coarse fractions
303 The Figure 4 shows the mass
balance and contents obtained in the traditional circuit of flotation and the suggested circuit. Note that the mass recovery in the proposed circuit was 67.41%, much higher than the standard circuit which was 50.2%. However, the levels of Fe and SiO2, unlike the tradi-tional circuit, were below the market’s specifications. The value of Fe in the proposed route was 53.4% and SiO2 was 21.6%, while the traditional route were 67.7% levels of Fe and 0.7% of SiO2. The P values remained high in both circuits.
Analyzing separately the proposed route data, the results obtained in re-verse flotation after classification (“cy-cloning”) were very satisfactory, both in terms of mass recovery, which was 67.71%, and in terms of levels of Fe and SiO2, 67.76% and 0.88%, respectively.
However, the results obtained in direct flotation were not within the
ex-pected. Despite the high mass recovery,
of 88.0%, concentrate levels were way outside of specifications, the Fe content was 40.9% and 39.7% of SiO2. Pos-sibly, there occurred too much drag by the quartz concentrated foam obtained by direct flotation, increasing the SiO2 content of this. In this way it is concluded that the depressant used (quaternary am-monium salt—Genamin PQ7) was not efficient, not allowing good results for direct flotation.
According to Baltar (2010) any salt can be used as a depressant and its efficiency is in the competition that is created between ionic entities from the collector and depressor, tending to a de-crease of ions and collectors, so there is adsorption on mineral particles. In this
way, the time of contact or residence time of flotation is of fundamental importance in this regard involving the interaction between collector and depressant for mineral depression.
Still, there must be taken into con-sideration the complete dissociation of quaternary ammonium salts in almost the entire pH range, with their acceler-ated consumption and unavailability in the solution.
When compared to studies done by (Nascimento, 2010), the results of the proposed circuit obtained a concentrate of best quality, but was also outside the market specification. But (Lopes and Lima, 2009) managed to obtain the high-est content of Fe and the lowhigh-est content of SiO2 in the concentrates produced. The data for direct comparison can be appreciated in Table 4.
Identification Collector (g/t) Depressor (g/t) %Fe %SiO2 Proposed circuit Fatty acid = 600 chloride and acrylamide = 600Quaternary ammonium 53.40 21.60
Nascimento
(2010)[ Sodium oleate = 2400 Sodium fluorosilicates = 1200 46.71 28.85
Lopes and Lima
(2009) Commercial hydroxamate (AERO 6493) = 1200 Sodium silicate = 1500 61.50 9.80
Table 4 Comparison of the results of the proposed
circuit and of direct flotation studies.
Figure 4 Flowchart with mass balance and contents of standard and alternative industrial circuit proposed.
5. Conclusions
Bench-scale tests carried out in this study reached the goal of elevating the mass recovery after the alteration proposed.
The step of coarse and fine particle separation using a cyclone proved to be promising, since the results of reverse flotation in large particles have achieved superior results.
In terms of mass recovery of concen-trate, compared to the traditional circuit, there were no decreases.
However, in terms of the fine par-ticles, a large volume of gangue minerals that were to foam due to drag from the flotation, the concentrate directly gener-ated a concentrgener-ated with high levels of
304
Acknowledgments
The authors thank the mining com-pany Vale for their support in the design
and execution of trials and Clariant by
reagents supplied, Gorceix Foundation,
UFOP, CAPES.
References
ARAÚJO, A. C., PERES, A. E. C. Flotação de minérios de ferro. In: CHAVES, A. P. Teoria e prática do tratamento de minérios. Flotação – o estado da arte no Brasil. São Paulo: Signus, 2006.
BALTAR, C. A. M. Flotação no tratamento de minérios. (2 ed.). Recife: Universitária da UFPE, 2010.
CHAVES, A. P., LEAL FILHO, L. S. Flotação. In: LUZ, A. B. et al. Tratamento de
minério. (4 ed.). Rio de Janeiro: CETEM/MCT, 2004.
COSTA, J. L. Seletividade na flotação de minério ferríferos dolomíticos. Ouro
Preto: Departamento de Engenharia de Minas, Universidade Federal de Ouro Preto, 2009. (Dissertação de Mestrado em Engenharia Mineral).
DONSKOI, E., SUTHERS, S. P., CAMPBELL, J. J., RAYNLYN, T. Modelling and
optimization of hydrocyclone for iron ore fines beneficiation-using optical ima-ge analysis and iron ore texture classification. International Journal of Mineral
Processing, v. 87, p. 106-111, 2008.
IWASAKI, I. Iron ore flotation, theory and practice. Minning Engineering, v. 35, p. 622-632, 1983.
KRISHNAN, S. V., IWASAKI, I. Pulp dispersion in selective desliming of iron ores.
International Journal of Mineral Processing, v. 12, p. 1-13, 1984.
LOPES, G. M., LIMA, R. M. F. Flotação direta de minério de ferro com oleato de
sódio. REM - Revista Escola de Minas, Ouro Preto, v. 62, n. 3, p. 323-329, 2009. MAPA, P. S. Rota de processo para o underflow da deslamagem de minério de ferro
do concentrador da Samarco Mineração. 2006. Belo Horizonte: Universidade
Fe-deral de Minas Gerais, 2006. (Dissertação de Mestrado em Engenharia Mineral). NASCIMENTO, D. R. Flotação aniônica de minério de ferro. Ouro Preto: De
-partamento de Engenharia de Minas, Universidade Federal de Ouro Preto, 2010.
(Dissertação de Mestrado em Engenharia Mineral).
QUEIROZ, L. A. Emprego da atrição na deslamagem: efeitos na flotação reversa
de minérios itabiríticos. Belo Horizonte: Universidade Federal de Minas Gerais,
2003. (Dissertação de Mestrado em Engenharia Mineral).
SAMPAIO, J. A., BALTAR, C. A. M. Ensaios de flotação. In: SAMPAIO, J. A et al.
Tratamento de minério – práticas laboratoriais. Rio de Janeiro: CETEM/MCT,
2007.
TOTOU, A. R. Efeito da dispersão em polpas de minérios itabiríticos. REM - Revista
Escola de Minas, Ouro Preto, v. 64, n.2, p. 227-232, 2010.
YANG, D. C. Reagent in iron ore processing. In: SOMASUNDARAN, P., MOUD -GIL, B. M. Reagents in mineral technology. New York: Marcel Dekker, 1988.
(Surfactant Science Series).