A Comparison of Methods to Determine Tannin Acyl
Hydrolase Activity
Cristóbal Aguilar
1, Christopher Augur
2*, Gustavo Viniegra-González
1and Ernesto Favela
1 1Departamento de Biotecnología. Universidad Autónoma Metropolitana Iztapalapa, México, D.F. 09340; 2Institut de Recherche pour le Développement. IRD-Mexique, Cicerón 609, Los Morales, México, D.F. 11530, MexicoABSTRACT
Six methods to determine the activity of tannase produced by Aspergillus niger Aa-20 on polyurethane foam by solid state fermentation, which included two titrimetric techniques, three spectrophotometric methods and one HPLC assay were tested and compared. All methods assayed enabled the measurement of extracellular tannase activity. However, only five were useful to evaluate intracellular tannase activity. Studies on the effect of pH on tannase extraction demonstrated that tannase activity was considerably under-estimated when its extraction was carried out at pH values below 5.5 and above 6.0. Results showed that the HPLC technique and the modified Bajpai and Patil methods presented several advantages in comparison to the other methods tested.
Key words: Tannin acyl hydrolase, assay, polyurethane foam, solid state fermentation, tannase
* Author for correspondence.
INTRODUCTION
Tannin acyl hydrolase (EC 3.1.1.20) or tannase is an enzyme which hydrolyses the ester and depside bonds of hydrolysable tannins and gallic acid esters (Lekha and Losane, 1997). It breaks down tannic acid, releasing gallic acid and glucose (Haworth et al., 1958). Tannase is produced by fungi, mainly by species of
Aspergillus, Penicillium, Fusarium and
Trichoderma (Iibuchi et al., 1967; Rajakumar
and Nandy, 1983; Kawakubo et al., 1991; Lekha and Lonsane, 1994; García-Peña, 1996; Bajpai and Patil, 1996), but also by bacteria (Deschamp
et al.,1983) and yeast (Aoki et al., 1976).
Tannase activity has also been detected in the fruit of several plants (Sourlangas, 1947; Madhavakrishna et al., 1960).
The major commercial applications of tannase are in the manufacture of instant tea or acorn wine and the production of gallic acid (Coggon
et al., 1975; Chae and Yu, 1983; Pourrat et al.,
1985). The latter is a key intermediate required for the synthesis of an antifolic antibacterial drug, trimethoprim, used in the pharmaceutical industry (Sittig, 1988). Gallic acid is also a
substrate for the chemical or enzymatic synthesis of propyl gallate in the food industry. In addition, tannase is used as a clarifying agent in wine, fruit juices and coffee-flavoured soft drinks (Lekha et al., 1993).
In order to classify, evaluate and select an adequate method for tannase activity and to attempt to homogenize the data presented in the literature concerning tannase units, six methods for the determination of tannase activity were compared. Additionally, the effect of sample and extractant solution pH on tannase acivity was considered. Along with the results, the advantages and disadvantages of each method are discussed.
MATERIALS AND METHODS
Microorganism and culture medium.
Aspergillus niger Aa-20 (IRD-UAMI collection)
was used in all experiments. Medium composition was the same as reported previously by Lekha and Lonsane (1994) using (NH4)2SO4 as nitrogen source. Salt-containing
medium was autoclaved at 121ºC for 15 min. Tannic acid (Sigma, U.S.A) solution was filter-sterilized and added to a final concentration of 25 gL-1.
Inoculum preparation. Spores from A. niger
Aa-20, stored at -20ºC in protect-crioblocks (bead storage system, Technical Service Consultants Limited) were used to inoculate 50 mL of PDA medium contained in two 125 mL flasks. The flasks were incubated at 30ºC for 5 days, and the spores were scraped into 0.01% Tween 80 solution and counted in a Neubauer chamber.
Enzyme production in solid state
fermentation (SSF). The SSF process involved
the use of polyurethane foam (PUF) (Expomex, Mexico) as support to absorb the liquid medium. PUF was washed using the technique described by Zhu et al. (1994) and then pulverized in a plastic-mill. Glass columns (25mm x 180 mm) were packed with 10 g of inoculated PUF(2 x 10⁷ spores g-1 of dry inert carrier)impregnated with the medium (1.94 mL of inoculated medium per gram of dry inert carrier). Culture conditions were: 30ºC; aeration rate, 20 mL of air per gram of inert carrier per min; initial pH, 5.5; initial moisture content, 65%, and incubation time, 48 h. For enzyme leaching, the
content of each column was mixed with distilled water (10:1 vw-1) and vortexed for 1 min. Solid particles were filtered (Whatman 41) and the clear filtrate was assayed for extracellular tannase activity. The remaining solids were washed three times with 50 mL of distilled water. Intracellular enzymes were recovered by freezing the cells in liquid nitrogen and by macerating in a chilled mortar. The macerated material was recovered in an equal amount of 0.02 M acetate buffer (pH, 5.0) and centrifuged at 5000g for 20 min. The resulting supernatant was assayed for intracellular tannase activity. Each data point was obtained from triplicate assays and the average values were reported as mean values ± standard deviations.
Tannase activity assays. Six tannase activity
methods were assayed: A) HPLC assay as reference method (Beverini and Metche, 1990), B) unbuffered titrimetric assay (Haslam et al. 1961), C) buffered titrimetric assay (Yamada et al. 1967), D) single wavelength spectrophotometric assay (Skene and Brooker, 1995), E) double length spectrophotometric assay (Bajpai and Patil, 1996), and F) a modified double length spectrophoto-metric assay (present work). In the latter, the modification consisted in the addition of the enzymic reaction described by Iibuchi et al. (1967) to the spectrophotometric assay described by Bajpai and Patil method (1996). An equation using specific extinction coefficients was established to estimate the concentration of gallic acid released during the reaction. Tannic acid was the sole substrate used in the enzymatic reaction.
Effect of pH. Fermented material was extracted
with a sodium acetate buffer (200 mM) at varying pH (3.0 - 7.5). Each data point was obtained in triplicate and the average values were reported as mean values. Tannase activity was assayed by HPLC.
Statistical Analysis. Analysis of variance and
RESULTS AND DISCUSSION
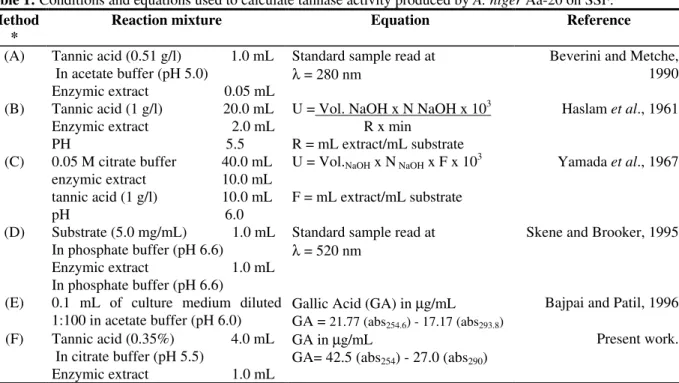
Table 1 shows the equations applied to calculate enzyme activity in all the six cases. In addition, the reaction mixture and conditions used are presented. For the spectrophotometric and HPLC methods, a unit of enzyme activity was defined as the amount of enzyme liberating 1µmol gallic acid per mL per min; while for the titrimetric methods, a tannase unit was the amount of enzyme able to release 1 µmol carboxyl group per mL per min. Features of method F were as follows: the two wavelengths for maximum difference in the absorbance of gallic and tannic acids were 254 nm and 290 nm, respectively. The specific extinction coefficients at these wavelengths were found to be 30.77 and 11.39 for gallic acid and 26.34 and 41.45 for tannic acid respectively. Using these values, equation of method F for the estimation of gallic acid released after the enzymic reaction was deduced (Table 1).
All the six methods tested enabled the evaluation of extracellular tannase activity. However, for intracellular tannase activity, the original double lenght spectro-photometric assay (E) of Bajpai and Patil (1996) could not be applied because the sample used to assay for activity was the culture medium itself, after
filtration and proper dilution without carrying out the enzymatic reaction. This aspect was its major drawback. Moreover, the results obtained for extracellular activity showed the highest standard deviation. Except for this method, all results for extracellular enzyme activities yielded values of tannase activity within the same range (1.5 - 5.0 I.U.), while the values obtained with the spectrophotometric method (E) were 9 times higher. This could be due to the fact that the values obtained through this method represented the amount of gallic acid liberated in the fermentation process, which was constantly consumed by the organism thereby showing point to point variation.
Statistical analysis of measurements of extracellular tannase indicated that all were different (p < 0.01) except for techinque A (HPLC) and F (modified spectro- photometric) which were quite similar (p > 0.05). Measurements of intracellular activities had high coefficients of variation (around 23%) as compared with the measurements of extracellular activities (around 14%) suggesting that there were significant experimental variations in the extraction of tannase. However, the smallest value of the coefficient of variation was related to HPLC technique indicating a higher reliability than others.
Table 1: Conditions and equations used to calculate tannase activity produced by A. niger Aa-20 on SSF.
Method *
Reaction mixture Equation Reference
(A) Tannic acid (0.51 g/l) 1.0 mL In acetate buffer (pH 5.0)
Enzymic extract 0.05 mL
Standard sample read at
λ = 280 nm Beverini and Metche,1990
(B) Tannic acid (1 g/l) 20.0 mL Enzymic extract 2.0 mL PH 5.5
U = Vol. NaOH x N NaOH x 103 R x min
R = mL extract/mL substrate
Haslam et al., 1961
(C) 0.05 M citrate buffer 40.0 mL enzymic extract 10.0 mL tannic acid (1 g/l) 10.0 mL pH 6.0
U = Vol.NaOH x N NaOH x F x 103
F = mL extract/mL substrate
Yamada et al., 1967
(D) Substrate (5.0 mg/mL) 1.0 mL In phosphate buffer (pH 6.6)
Enzymic extract 1.0 mL In phosphate buffer (pH 6.6)
Standard sample read at
λ = 520 nm Skene and Brooker, 1995
(E) 0.1 mL of culture medium diluted 1:100 in acetate buffer (pH 6.0)
Gallic Acid (GA) in µg/mL GA = 21.77 (abs254.6) - 17.17 (abs293.8)
Bajpai and Patil, 1996
(F) Tannic acid (0.35%) 4.0 mL In citrate buffer (pH 5.5)
Enzymic extract 1.0 mL
GA in µg/mL
GA= 42.5 (abs254) - 27.0 (abs290)
Present work.
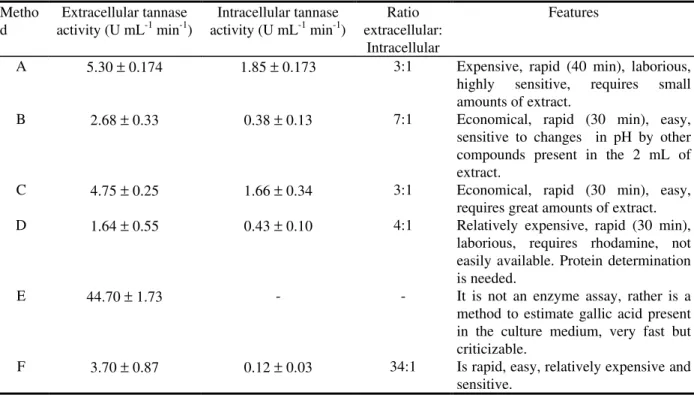
Tannase activity of A. niger Aa-20 on SSF after 48 h incubation period is shown in Table 2. From the obtained data, it can be observed that HPLC (A), buffered titrimetric (C), and modified spectrophotometric (F) methods showed the highest values of tannase activity. Among these three methods, B and F presented higher variability. In addition, some other aspects can be considered to select a method of choice (Table 2).
The data obtained from this comparative study indicated that the values of tannase activity could be compared, mainly due to the fact that values were in the same range of magnitude,
except for the original Bajpai and Patil assay. Extracellular/intracelluar ratios were obtained for each of the methods described. The lowest values were for the HPLC and the titrimetric assay proposed by Yamada et al. (1997). The latter, however, has a disadvantage since large volume of extract was needed (10 mL). In contrast, the HPLC assay required only 50 µl of enzymatic extract and could be the method of choice for purification purposes. However, selection of the method of choice would be a function of precision, sensitivity, time required and equipment available.
Table 2: Tannase activity after 48 h incubation period of A. niger Aa-20 on SSF and characteristics of each method used.
Metho d
Extracellular tannase activity (U mL-1 min-1)
Intracellular tannase activity (U mL-1 min-1)
Ratio extracellular:
Intracellular
Features
A 5.30 ± 0.174 1.85 ± 0.173 3:1 Expensive, rapid (40 min), laborious, highly sensitive, requires small amounts of extract.
B 2.68 ± 0.33 0.38 ± 0.13 7:1 Economical, rapid (30 min), easy, sensitive to changes in pH by other compounds present in the 2 mL of extract.
C 4.75 ± 0.25 1.66 ± 0.34 3:1 Economical, rapid (30 min), easy, requires great amounts of extract. D 1.64 ± 0.55 0.43 ± 0.10 4:1 Relatively expensive, rapid (30 min),
laborious, requires rhodamine, not easily available. Protein determination is needed.
E 44.70 ± 1.73 - - It is not an enzyme assay, rather is a method to estimate gallic acid present in the culture medium, very fast but criticizable.
F 3.70 ± 0.87 0.12 ± 0.03 34:1 Is rapid, easy, relatively expensive and sensitive.
From the results obtained, methods A and F showed major advantages in the evaluation of tannase activity. A comparison of these methods showed that the HPLC method had more precision, sensitivity and presented lower variability (Figure 1a). However, the correlation coefficient was high between both methods (0.965) as shown in Figure 1b. It is important to state, that in both methods the activity is expressed as gallic acid released. When the results obtained in both methods are compared with those obtained by the titrimetric assay (B) where the tannase activity is expressed as
Only five of the six methods evaluated, enabled measurement of intracellular tannase activity (with the exception of the Bajpai and Patil method). The difference between values for each was due to sensitivity, precision and mainly to the product of the enzymatic reaction followed. However, about the latter aspect, it is important to consider that the amount of carboxyl groups released is proportional to the amount of gallic acid produced. This is demonstrated by the obtained values between the five methods mentioned. This point is important, as it is clear that the activity is similar in several methods when a same substrate is used. In addition, some of the available methods have at least one drawback, for example, the method reported by Jean et al., (1981) is limited to one substrate (methyl gallate) which measures methanol produced and therefore the compound cannot be sustituted; the Skene and Brooker method requires rhodanine which is a non readily available chemical.
Figure 1: Tannase activity from A. niger Aa.20 on SSF using the HPLC and modified double length spectrophotometric methods (A), and relationship between tannase activity values obtained with both methods (B).
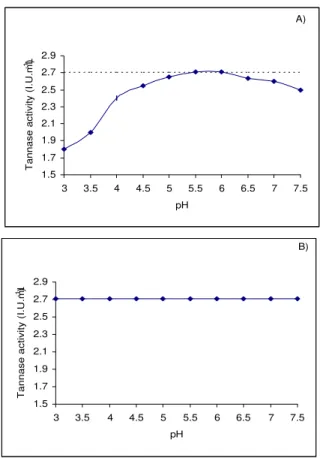
Taking into account the different pH values reported to carry out tannase extraction and enzyme assay, a final experiment was conducted determining the effect of sample pH and extraction solution pH on tannase activity assayed by HPLC. The internal control was the same extract after dialysis against a buffer at pH 6.0 and considered as reference (2.7 U/mL).
Figure 2A shows the pattern obtained when the pH of solution was modified. It was clear that at low pH values of the extraction solution (3.0 - 5.5) tannase activity was under-estimated (7% for pH values of 4.5 - 5.0 and >13% for pH values of 3.0 - 4.0). At a pH range from 5.5 to 6.0, 100% of the activity was recovered; pH change due to sample addition was not significant (p < 0.0001), independently of the sample pH at a range from 3.0 to 7.5 (Figure 2B). If an extraction solution at pH 6.0 was used, followed by a variation in the pH of the assay solution, no significant effect was seen on tannase activity (Figure 2B). However, if the pH of the extraction solution was varied, the extracted tannase activity varied greatly.
Figure 2. Effect of the pH of extractant solution on tannase activity (A) and effect of the pH of the sample on tannase activity (B). Enzyme activity was assayed by the HPLC method.
B)
y = 0.68x - 0.0809 R2 = 0.965
0 1 2 3 4 5
0 1 2 3 4 5 6
Tannase activity (I.U./ml by HPLC assay)
Tannase activity (I.U./ml by modified
spectrophotometric assay)
A)
1.5 1.7 1.9 2.1 2.3 2.5 2.7 2.9
3 3.5 4 4.5 5 5.5 6 6.5 7 7.5
pH
Tannase activity (I.U.mL
-1)
B)
1.5 1.7 1.9 2.1 2.3 2.5 2.7 2.9
3 3.5 4 4.5 5 5.5 6 6.5 7 7.5
pH
Tannase activity (I.U.mL
-1)
A)
0 1 2 3 4 5 6 7
0 1 0 2 0 3 0 4 0 5 0
Time (h) • H P L C
The HPLC technique and the modified Bajpai and Patil method were the fastest, most specific, reliable and reproducible assays under conditions used in the present study. The original Bajpai and Patil method could not be considered as the present study evaluated the gallic acid released in the fermentation process and did not involve an enzymatic reaction. However, we recommend that before selecting a method, the advantages and disadvantages of each method need to be considered. In addition, the enzyme extraction process should be carried out with a buffering solution at a pH of 6.0.
ACKNOWLEDGEMENTS
C.N. Aguilar wishes to thank CONACYT-México for financial support. The present work was performed as part of a cooperative agreement between CONACYT (National Council of Science and Technology) and IRD (Institut de Recherche pour le Développement) within a specific program undertaken at the Universidad Autónoma Metropolitana (México). Part of the research was funded by an European Community INCO DC grant (BIOPULCA, # IC*CT970185).
RESUMO
Seis métodos para determinar a atividade de tannase produzida por Aspergillus niger O Aa-20 em espuma de polyuretano por fermentação em estado sólido foram estudados. Duas técnicas titulométricas , três métodos spectrofotométricos e um método por HPLC foram testados e comparados. Todos os métodos testados permitiram determinar a atividade da tannase produzida extracelularmente. Entretanto, somente cinco se mostraram úteis para avaliar a atividade da tannase produzida intracelularmente. Os estudos do efeito do pH na extração de tannase demonstraram que a atividade de tannase era consideravelmente subestimada quando sua extração foi executada em valores de pH inferiores a 5.5 e superior a pH 6.0. Os resultados demostraram que a técnica de HPLC o método Bajpai and Patil modificado
apresentam várias vantagens em comparação aos outros métodos testados.
REFERENCES
Aoki, K., Shinke, R. and Nishira, H. (1976). Purification and some properties of yeast tannase. Agr. Biol. Chem. 40, 79-85.
Bajpai, B. and Patil, S. (1996). Tannin acyl hydrolase ( EC 3. 1. 1 .20) activity of
Aspergillus, Penicillium, Fusarium and
Trichoderma.World J. Microbiol. Biotechnol.
12, 217-220.
Beverini, M. and Metche, M. (1990). Identification, purification and physicochemical properties of tannase of
Aspergillus oryzae. Sci.Aliments. 10,
807-816.
Chae, S. and Yu, T. (1983). Experimental manufacture of acorn wine by fungal tannase.
Hanguk Sipkum Kwahakoechi. 15, 326-332.
Chen, T. (1969). The induction of tannase in
Aspergillus niger. PhD. Thesis, University of
California, Berkeley, U.S.A.
Coggon, P., Graham, N. and Sanderson, G. (1975). Cold water-soluble tea. U.K. Pat. 2,610,533.
Deschamp, A., Otuk, G. and Lebeault, J. (1983). Production of tannase and degradation of chestnut tannin by bacteria. J. Ferment.
Technol. 61,55-59.
García-Peña, I. (1996). Producción, purificación y caracterización de tanasa producida por
Aspergillus niger en ferrmentación en medio
sólido. M.Sc. Thesis, Universidad Autónoma Metropolitana Unidad Iztapalapa, México. Haslam, E., Haworth, R., Jones, K. and Rogers,
H. (1961). Gallotannins. Part I. The fractionation of tannase. J. Chem. Soc. 1829-1835.
Haslam, E. and Stangroom, J. (1966). The esterase and depsidase activities of tannase.
Biochem. 99, 28-31.
Haslam, E. and Tanner, R. (1970). Spectrophotometric assay of tannase.
Phytochem.90, 2305-2309.
Haworth, R., Jones, K. and Rogers, H. (1958). Ion-exchange chromatography of Aspergillus
Iibuchi, S., Monida, Y. and Yamada, K. (1967). Studies on tannin acylhydrolase of micro-organisms Part III. Purification of enzyme and some properties of it. Agr. Biol. Chem. 32, 803-809.
Jean, D., Pourrat, H., Pourrat, A. and Carnat, A. (1981). Assay of tannase (tannin acylhydrolase EC 3.1.120) by gas chromatography. Anal. Biochem. 110, 369-372.
Kawakubo, J., Nishira, H., Aoki, K. and Shinke, R. (1991). Screening for gallic acid producing microorganims and their culture conditions. Agr. Biol. Chem. 55, 857-877. Lekha, P.K. and Lonsane, B.K. (1994).
Comparative titres, location and properties of tannin acyl hydrolase produced by
Aspergillus niger PKL 104 in solid-state,
liquid surface and submerged fernentations.
Proc. Biochem.29, 497-503.
Lekha, P.K. and Lonsane, B.K. (1997). Production and application of tannin acyl hydrolase: state of the art. Adv. Appl.
Microbiol. 44, 215-260.
Lekha, P., Ramakrishna, M. and Lonsane, B. (1993). Strategies for isolation of potent culture capable of producing tannin acyl hydrolase in higher titres. Chem. Mikrobiol
Technol.Lebensmitt.15, 5-10.
Madhavakrishna, W., Bose, S. and Nayudamma, Y. (1960). Estimation of tannase and certain oxidising enzymes in indian vegetables tanstuffs. Bull. Cent. Leath.
Res. Inst. 7, 1-11.
Nishira, H. (1961). Degradative metabolism of tannin by molds Hakko Kogaku Zasshi. 39, 137-146.
Pourrat, H., Regerat, F., Pourrat, A. and Jean, D. (1985). Production of gallic acid from tara
tannin by a strain of A. niger. J. Ferment.
Technol. 63, 401-403.
Rajakumar, G. and Nandy, S. (1983). Isolation, purification and some properties of
Penicillium chrysogenum tannase. Appl.
Environ. Microbiol. 46, 525-527.
Sanderson, G., Englewood, N., Coggon, P. and Orangeburg, N. (1974). Green tea conversion using tannase and natural tea leaves. U.S. Pat. 3, 812, 266.
Sittig, M. (1988). Trimethoprim. In Pharmaceutical Manufacturing Encyclopedia. New Jersey: Noyes Publication. 282 - 284. Skene, I. and Brooker, J. (1995).
Characterization of tannin acylhydrolase activity in the ruminal bacterium
Selenomonas ruminantium. Anaerobe. 1,
321-327.
Sourlangas, S. (1947). Enzymes in the pyrogallol tannins and the decomposition products yielded. J. Int. Soc. Leath.Trades.
Chemist.31, 13-23.
Yamada, K. Iibuchi, S. and Minoda, Y. (1967). Studies on tannin acylhydrolase of microorganisms. I. Isolation and identification of producing molds and studies on the conditions of cultivation. Agr. Biol.Chem. 45, 233-240.
Zhu, Y., Smith, J., Knol, W. and Bol, J. (1994). A novel solid state fermentation system using polyurethane foam as inert carrier.
Biotechnol. Lett.16, 643-648.