Prediction equations for the energy values of soybean meal for pigs at
the growing phase with
ex-post
validation
1Equações de predição dos valores energéticos do farelo de soja para suínos em
crescimento com validação
ex post
Everardo Ayres Correia Ellery2, Pedro Henrique Watanabe2*, Teresinha Marisa Bertol3, Ednardo Rodrigues
Freitas2 e Germano Augusto Jerônimo Nascimento2
ABSTRACT - The aim of this study was to determine and validate prediction equations for digestible (DE) and metabolizable energy (ME) of soybean meal for growing pigs. The prediction equations were developed using data from chemical composition, digestibility and metabolizability of soybean meal samples (n = 25) evaluated in essays at Embrapa Suínos e Aves. The equations were estimated through regression analysis, using the REG procedure of SAS and adjusted R² was the criterion of choice to select the best models. Two equations were estimated for DE and two for ME. To validate the equations, one experiment with two essays was performed to determine the values of DE and ME of five samples of soybean meal. In each essay, 24 growing pigs with an initial weight of 54.20 ± 1.28 kg at first and 54.60 ± 2.26 kg at second essay, were sorted in a complete randomized block design with 6 treatments (1 reference diet and 5 test diets) and 4 replicates. Considering the lowest prediction error (ep), the equations to predict the DE and ME of soybean meal were: DE = 48153 – 1586.1(PB) + 744.5(EE) + 363.6(FB) - 1398.3(MM) + 15.5(PB2) – 170.8(EE2) – 29.3(FB2) + 5.4(FDA2) – 2.5(FDN2) + 90.6(MM2) – 8.2(EEFDA) + 33(EEFDN), with R² = 0.88 and ep =2.32 and ME = 12692 – 2397.7(MM) – 56.8(EE2) + 164.9(MM2) – 102.2(EEFB) – 12.25(EEFDA) + 67.6(EEFDN) + 5.5(PBFB) – 2.9(PBFDN) with R2= 0.65 and e
p= 1.69. Based on the chemical composition data and correlations, it was possible to establish prediction equations for the values of digestible and metabolizable energy of soybean meal for pigs, being necessary validation for greater accuracy of the models.
Key words: Digestible energy. Mathematical models. Metabolizable energy. Protein feedstuffs.
RESUMO - Objetivou-se determinar e validar equações de predição para energia digestível (ED) e metabolizável (EM) do farelo de soja para suínos em crescimento. Foram utilizados dados de composição química, digestibilidade e metabolizabilidade de amostras de farelo de soja (n = 25), avaliadas em ensaios realizados na Embrapa Suínos e Aves. As equações foram estimadas por meio da análise de regressão, utilizando-se o procedimento REG do pacote estatístico SAS, e o R² ajustado para selecionar os melhores modelos. Foram estimadas duas equações para ED e duas para EM. Para a validação das equações, foi realizado um experimento composto por dois ensaios, para a determinação dos valores de ED e EM de amostras do farelo de soja (n = 5). Em cada ensaio, 24 leitões machos castrados, com peso inicial de 54,20 ± 1,28 kg no primeiro e 54,60 ± 2,26 kg no segundo, foram distribuídos em delineamento em blocos ao acaso, com 6 tratamentos (1 ração referência e 5 rações testes) e 4 repetições por tratamento. Considerando-se o menor erro de predição (ep), as equações que melhor se ajustaram para predição dos valores ED e EM do farelo de soja foram: ED = 48153 – 1586,1(PB) + 744,5(EE) + 363,6(FB) – 1398,3 (MM) + 15,5(PB2) – 170,8(EE2) - 29,3(FB2) + 5,4(FDA2) – 2,5(FDN2) + 90,6(MM2) – 8,2(EEFDA) + 33(EEFDN), com R² = 0,88 e ep=2,32, EM = 12692 - 2397,7(MM) – 56,8(EE2) + 164,9(MM2) – 102,2 (EEFB) – 12,25(EEFDA) + 67,6(EEFDN) + 5,5(PBFB) – 2,9(PBFDN) com R2= 0,65 e e
p= 1,69. A partir dos dados de composição química e das correlações existentes, foi possível estabelecer equações de predição para os valores de energia digestível e metabolizável do farelo de soja para suínos, sendo a validação necessária para maior acurácia dos modelos.
Palavras-chave: Alimento proteico. Energia digestível. Energia metabolizável. Modelos matemáticos.
DOI: 10.5935/1806-6690.20150076 * Autor para correspondência
1Recebido para publicação em 17/03/2014, aprovado em 27/07/2015
Parte da Dissertação de Mestrado em Zootecnia do primeiro autor apresentada na Universidade Federal do Ceará; pesquisa financiada pela Embrapa
2Departamento de Zootecnia, Centro de Ciências Agrárias, Universidade Federal do Ceará (UFC). Av. Mister Hull, 2977, Bloco 808,
Fortaleza - CE, Brasil, 60440-900, [email protected], [email protected], [email protected], [email protected]
3Embrapa Suínos e Aves, Rodovia BR-153, km 110, Distrito de Tamanduá, Caixa Postal: 21, Concórdia-SC, Brasil, 89.700-000, teresinha.
INTRODUCTION
The energy content of any feedstuff comprises the results of the oxidation of nutrients during animal metabolism. Among the constituents of feed, the soluble carbohydrates, lipids, amino acids and part of the dietary fiber supply energy to the organism; but not all the energy produced by oxidation of the nutrients can be used (SAKOMURA; ROSTAGNO, 2007). Depending on chemical composition therefore, the ingredients used in the formulation of diets for pigs may have varying energy values, and it is important to evaluate them in order to provide proper balance
in the diets (NASCIMENTO et al., 2011). However,
the efficiency of the method for formulating the diet is dependent on the accuracy with which the energy of
the feed is determined (SILVAet al., 2003).
Biological trials aimed at analysing the digestibility and metabolizability of the nutrients and energy of any feed or ingredient, are shown to have a high degree of reliability, but they are costly and time-consuming. Thus, indirect methods, such as determination of the energy values of feeds by means of prediction equations, are low-cost alternatives when applied to specific feedstuffs (NOBLET; PEREZ, 1993).
Unlike studies to determine prediction equations for energy values of maize for pigs, where there is a diversity of research, for soybean meal reports are scarce and are mostly non-specific, being in general for protein feedstuffs of plant origin (NOBLET; PEREZ, 1993), or involving the use of indirect variables
(KANGet al., 2004). Despite being primarily a source
of protein in feed, soybean meal also contributes with an average of 20% of the energy value in diets for pigs at the growing phase; the energy content may vary due to processing of the soybean, residual oil content, protein quality and fiber content.
As the soybean meal is obtained from processing soybean, the range of values for the analytical parameters of experimental samples makes it difficult to predict energy values, resulting in regression coefficients with
high standard deviations and low reliability (OSTet al.,
2005). In addition, few studies have been reported on the applicability of the equations that have been developed, and it is difficult to know the degree of confidence to be held in the equations currently available. As not all attempts to relate chemical composition and energy have been successful, and many prediction equations do not respond satisfactorily when tested with independent data (SIBBALD, 1982), the validation of prediction equations by means of statistical tools such as autocorrelation analysis of the prediction errors, and cross-correlation analysis between input and output
data (AGUIRRE, 2004) seeks to increase the accuracy and precision of the prediction models.
Taking into account the information exposed above, the aim of the present work was to determine prediction equations for estimating values for the digestible and metabolizable energy in soybean meal for growing pigs, with subsequent validation based on the lowest prediction error.
MATERIAL AND METHODS
The information used in this study was obtained from data for the nutrient digestibility and metabolizable energy of different samples of soybean meal, determined in trials employing the total collection of faeces and urine, and conducted in the last two decades at the Experimental Facility for Metabolism in Pigs, of Embrapa Suínos e Aves, located in Concórdia, in the State of Santa Catarina, Brazil.
Data from 29 samples of soybean meal were recorded on a spreadsheet, including all the nutritional information for the samples and energy values. After cataloguing the data, the information was selected, analysed and then compared with values in the Tabelas
Brasileiras para Aves e Suínos (ROSTAGNO et al.,
2011.) and the NRC (2012), only considering those with information on crude protein (CP), ether extract (EE), mineral matter (MM), crude fibre (CF), neutral detergent fibre (NDF) and acid detergent fiber (ADF), as well as values for digestible energy (DE) and metabolizable energy (ME) for pigs at the growing phase. Of the 29 samples of soybean meal in the database, 25 were selected to obtain the prediction equations for estimating the values of DE and ME.
Pearson correlations were estimated (DRAPER; SMITH, 1981) to clarify the structure of the relationship among the variables under study, using the CORR procedure of the SAS statistical software (2009).
The prediction equations were estimated by regression analysis, using the REG procedure of the SAS software (2009). The adjusted R² was the choice criterion for selecting the best models. Among the equations that had a higher adjusted R², the final model was the one that included the variables of greatest interest, including interactions among the variables for a better fit of the equations. Two models were selected for DE and two models for ME, and subsequently validated.
soybean meal. In each trial, 24 barrows were used, from the crossing of MS-115 males and F1 females (Landrace x Large White), with an initial weight of 54.20 ± 1.28 kg in the first and 54.60 ± 2.26 kg in the second; animals were housed in cages for metabolic studies. A randomized block design was used to control the differences in initial weight, with six treatments and four replications per treatment in each trial; the experimental unit consisted of one animal.
The treatments comprised a reference diet and five test diets composed of 70% of the reference diet and 30% soybean meal. The reference diet (Table 1) was formulated to meet the minimum nutritional requirements of castrated male pigs with a live body weight of 50-70 kg and a high genetic potential, as per
Rostagnoet al. (2011).
Each trial lasted 12 days, with the first seven for adapting the animals to the cages and determining feed intake, and the last five for collecting faeces and urine. Feeding was carried out twice a day, at 08 a.m. and 02 p.m. After 30 minutes from the start of feeding, the leftovers were collected and weighed, thereby determining the amount ingested. Water was provided ad libitum after each feeding.
The amount of feed provided during the period of faeces collection was set according to the lowest consumption obtained during the initial seven days, based
on the metabolic weight (kg0.75) of each experimental unit.
Ferric oxide (Fe2O3) was used as a faecal marker in the
proportion of 0.5%, to determine the beginning and the end of the collection period. Total collection of the faeces was carried out in plastic bags twice a day, weighed and stored in a freezer at -8 ºC for later analysis. The urine was collected once a day, in plastic buckets containing a 20 mL 1:1 solution of distilled water and hydrochloric acid (2N), so as not to allow the loss of nitrogen or the proliferation of bacteria and fungi. The volume of urine produced was measured, and a 20% aliquot removed and stored in a freezer.
At the end of the experiment, the faeces and urine of each animal were unfrozen and homogenized to get a sample for each animal. Portions of the faeces were pre-dried in a forced air circulation oven at 55 °C for 72 h, and then ground in a knife mill with a 1 mm sieve. The urine samples were dried in petri dishes in a forced air circulation oven at 55 °C for 72 hours, with the volume in the dishes being topped up every 24 hours. Samples of the feed and ingredients were ground, following the same procedures as described for the faeces.
Analysis of the chemical composition and gross energy (GE) of the ingredients, diets, faeces and urine was carried out at the Laboratory for Physical and Chemical Analysis of Embrapa Suínos e Aves (LAFQ), in
Ingredient (%) Reference Diet
Corn 71.426
Soybean meal 23.346
Degummed soybean oil 1.520
Dicalcium phosphate 0.896
Limestone 0.696
Common salt 0.404
L-Lysine HCl 0.380
DL-Methionine 0.118
L-Threonine 0.110
L-Tryptophan 0.014
Colistin sulphate 0.020
Antioxidant¹ 0.016
Cholin chloride 0.010
Phytase 0.010
Mycotoxin binder 0.300
Mineral e vitamin supplement² 0.250
Industrial kaolin 0.484
Total 100.000
Metabolizable energy (kcal/kg) 3,300.000
Crude Protein (%) 17.500
Available phosphorous (%) 0.400
Calcium (%) 0.720
Digestible lysine (%) 1.150
Digestible methionine + cystine (%) 0.641
Digestible threonine (%) 0.721
Digestible tryptophan (%) 0.195
1butylhydroxytoluenw;2Supplying the following quantities per kg
of feed: 75 mg Fe; 7.5 mg Cu; 50 mg Mn; 75 mg Zn; 1.5 mg Co; 0.5 mg I; 0.25 mg Se; 10000 UI vit A; 1500 UI vit D3; 30 mg vit E; 2.0 mg vit K3; 2.0 mg vit B1; 5.0 mg vit B2; 3.0 mg vit B6; 30 mcg vit B12; 0.80 mg folic acid; 12 mg pantothenic acid; 30 mg niacin
Table 1 - Centesimal, chemical and energy composition of the reference diet
accordance with the AOAC (2005). Analysis of the neutral detergent fiber (NDF) and acid detergent fiber (ADF) was
performed according to Van Soestet al. (1991). The gross
energy (GE) of the ingredients, diets, faeces and urine was determined in a PARR Model 1241EA adiabatic bomb calorimeter. Values for the digestible and metabolizable energy of the soybean meal were determined from the
equation proposed by Mattersonet al. (1965).
adjusted R², and submitted to regression analysis using the REG procedure of the SAS statistical software (2009). The
lowest prediction error (ep) was used for criterion validation.
RESULTS AND DISCUSSION
Considering the low variation of soybean meal, values for the digestible and metabolizable energy of the samples had a coefficient of variation below 3% (Table 2). However, a greater variation was seen in the values of ether extract and fibrous fractions. The variability found for the level of ether extract in the soybean meal is due to the efficiency of the
oil-extraction process (OSTet al., 2005; RIEGER et al.,
2008), and may contribute to the variation found in the values of digestible and metabolizable energy.
DE: digestible energy (kcal/kg); ME: metabolizable energy (kcal/kg); CP: crude protein (%); EE: ether extract (%); CP: crude fiber (%); ADF acid detergent fiber (%); NDF: neutral detergent fiber (%); MM: mineral matter (%)
Variable Mean Standard deviation Coefficient of variation Minimum Maximum
DE (kcal kg) 4084 94.81 2.32 3907 4233
ME (kcal kg) 3842 112.83 2.94 3607 4052
CP (%) 51.45 2.09 4.06 46.33 54.53
EE (%) 2.10 0.72 34.29 1.04 3.77
CF (%) 5.36 1.24 23.13 3.67 8.09
ADF (%) 8.13 2.11 25.95 5.17 12.87
NDF (%) 13.56 3.44 25.37 8.47 21.55
MM (%) 6.71 0.59 8.79 5.48 8.48
Table 2 - Energy values and average chemical composition of 25 samples of soybean meal (dry matter basis)
Table 3 - Correlation coefficients between the variables of the chemical composition and the energy values of the soybean meal
DE ME CP EE CF ADF NDF MM
DE 1.000
ME 0.633** 1.000
CP -0.244 -0.132 1.000
EE 0.451* 0.217 -0.665** 1.000
CF -0.046 0.045 -0.335 -0.177 1.000
ADF -0.104 -0.147 -0.232 -0.206 0.775** 1.000
NDF -0.165 0.084 -0.503** -0.030 0.764** 0.349 1.000
MM -0.435* -0.153 0.356 -0.219 -0.095 -0.178 0.864 1.000
DE: digestible energy (kcal/kg); ME: metabolizable energy (kcal/kg); CP: crude protein (%); EE: ether extract (%); CP: crude fiber (%); ADF acid detergent fiber (%); NDF: neutral detergent fiber (%); MM: mineral matter (%); *significant at 5% probability by t-test (P<0,05); ** significant at 1% probability by t-test (P<0,01)
For crude protein content (Table 2), the coefficient of variation was of 4.06% which can be attributed to changes when processing the soybean grains to obtain
the meal. According to Zambomet al. (2001), when the
protein value of the soybean grain is low, it is necessary to remove the soybean hull to increase the crude protein content, resulting in variations in the participation of the fibrous fractions, and confirmed by the difference found between the minimum and maximum values for CF, NDF and ADF in the soybean meal.
A positive correlation was seen between the digestible energy and the values of metabolizable energy and ether extract (Table 3).
to metabolism of the nutrients present in soybean meal, is small, due to the protein quality of the ingredient being evaluated. Thus, as this is a protein concentrate being processed thermally, soybean meal may show a greater difference between the values for DE and ME when overheated, resulting in a loss of nutritional value and
energy (MENDESet al., 2004), and a lower correlation
between DE and ME. According to Pozzaet al. (2008),
the variability seen between the values of DE and ME can be attributed to the protein quality of the ingredient, so that when the protein is of low quality the ME decreases due to the amino acids not used in protein synthesis being catabolized and used as an energy source, while the nitrogen is excreted in the urine.
As to the positive correlation between DE and EE, when considering the residual lipid content of the ingredient, the contribution of this fraction to the energy content of the soybean meal becames evident. According
to Tucciet al. (2003), including soybean oil in the feed for
non-ruminants increases the metabolizable energy content of the feed by about 9 kcal per gram. According to the same authors, the reduction in fatty acid synthesis due to the extra-calorific effect of the oil, results in more energy being available to the processes of production.
The negative correlation between DE and MM (P<0.05) confirms the results reported in previous studies, in which large amounts of MM reduced energy usage by the animals (ADEDOKUN; ADEOLA, 2005; OLUKOSI; ADEOLA, 2009). In addition to its dilution effect, mineral matter can reduce the digestibility of some nutrients such as fats, due to the saponification process in the intestinal lumen, as well as by affecting the rate of passage of digesta or enhancing the interactions between minerals and other nutrients (NOBLET; PEREZ, 1993).
The variables used to fit the prediction equations to estimate the values of DE and ME in soybean meal for growing pigs were ether extract, mineral matter, crude protein, crude fiber, acid detergent fiber and neutral detergent fiber. Based on the nutritional composition of
various ingredients, Just et al. (1984) observed that the
best equations were estimated from the values for CP, CF, nitrogen-free extract, NDF, gross energy and organic matter, further stating that including ADF would give better prediction equations. Similarly, based only on the chemical composition of the feed, Noblet and Perez (1993) found that the MM, CP, EE and dietary fiber were the best predictors of digestible and metabolizable energy values.
It is important to point out that, based on the components measured in each analysis to determine the fiber, the differences found among fractions measured by each of the methodologies result in the participation of all the values obtained for the fibrous components
in the equations; thus, the methods of determining the fibrous fraction in the feed are not independent of each
other (ANDERSONet al., 2011). Accordingly, Noblet and
Perez (1993), supported by Just et al. (1984), observed
that components of the cell wall were the best predictors for the prediction equations of various ingredients, further stating that greater accuracy could be obtained from the fractionation of the NDF in hemicellulose, cellulose and
lignin. In turn, Kang et al. (2004) developed prediction
equations to estimate the metabolizable energy in soybean meal for pigs with the inclusion of ADF and soluble carbohydrates.
According to Noblet and Perez (1993), it is thought that the choice of a prediction equation to estimate the values of digestible and metabolizable energy should be dependent on the cost of the analytical procedures involved and the accuracy of the prediction. Therefore, considering the values obtained for the adjusted R² in this study, the use of data from chemical analysis commonly carried out to determine the nutritional composition of feed, as well as the different correlations found among them as predictors, made it possible to determine the equations without the use of data from more costly analyses, such as that for gross energy.
The prediction equations with the best fit in to estimate the value of DE in soybean meal for growing pigs were:
DE1 = 48153 – 1586.1(CP) + 744.5(EE) + 363.6(CF)
– 1398.3(MM) + 15.5(CP2) – 170.8(EE2) – 29.3(CF2) +
5.4(ADF2) – 2.5(NDF2) + 90.6(MM2)– 48.2(EEADF) +
33(EENDF), with R² = 0.88 and adjusted R2 = 0.77;
DE2= 7414.9 - 903.4(MM) – 88.2(EE2)– 34.7(CF2)
+ 9.6(ADF2) + 58.4(MM2) - 101.6(EECF) + 72.4(EENDF)
+ 12.3(CPCF)– 3.2(CPADF)– 3(CPNDF), with an R2 of
0.86 and adjusted R2 = 0.75.
The equations with the best fit to predict the ME of soybean meal for growing pigs were:
ME1 = 12692 - 2397.7(MM) – 56.8(EE2) +
164.9(MM2) – 102.2(EECF) – 12.25(EEADF) +
67.6(EENDF) + 5.5(CPCF)– 2.9(CPNDF), with an R2of
0.65 and adjusted R2 = 0.48;
ME2 = 10963 + 37.7(CP) + 309.4(CF) –
2450.7(MM) – 67.1(EE2) + 167.9(MM2)– 111.2(EECF)
– 13.2(EEADF) + 76.7(EENDF)– 3.3(CPNDF), with an
R2 = 0.66 and adjusted R2 = 0.46.
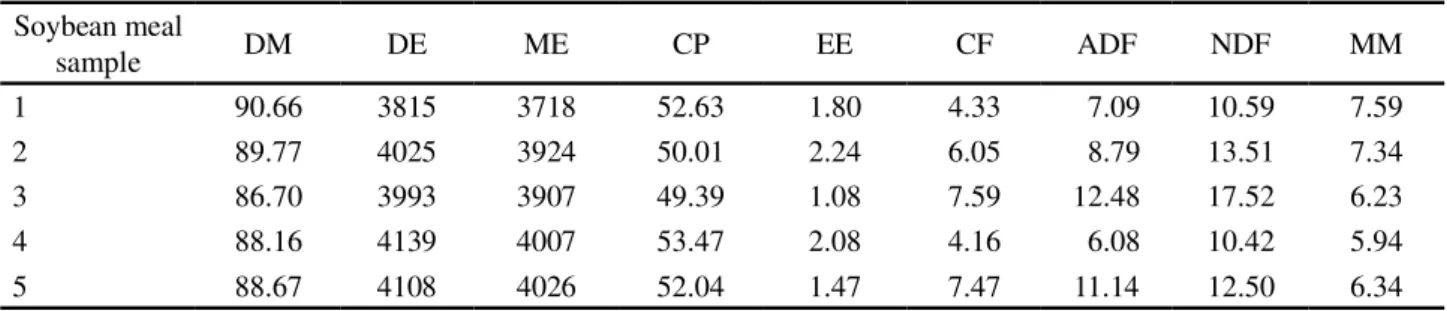
trials to validate the prediction equations. All the values found are within the range of the values obtained in the soybean meal samples compiled at the beginning of the experiment, allowing all the samples to be included in the validation.
Unlike the present study, the prediction equations found in the literature for the various raw materials
include a limited number of variables (POZZAet al.,
2008a; CASTILHA et al., 2011), due to the shorter
time required to perform the analyzes and ease of use
(POZZAet al., 2008b). As a result, there is great interest
in the use of prediction equations for the digestible and metabolizable energy in feed, which comprise one or more combinations of chemical composition variables
(COSTAet al., 2005).
However, generating equations does not imply that they will predict values more accurately, being necessary to validate the equations, reporting the prediction error or residue that is used to estimate the mathematical models
and the coefficients of determination (R2 and adjusted
R2). The coefficients of determination (R2), prediction
error and accuracy obtained for the proposed models are shown in Table 5.
The equations with the best fit in predicting the values for digestible and metabolizable energy in soybean
DM: dry matter; DE: digestible energy (kcal/kg); ME: metabolizable energy (kcal/kg); CP: crude protein (%); EE: ether extract (%); CF: crude fiber (%); ADF: acid detergent fiber (%); NDF: neutral detergent fiber (%); MM: mineral matter (%)
Soybean meal
sample DM DE ME CP EE CF ADF NDF MM
1 90.66 3815 3718 52.63 1.80 4.33 7.09 10.59 7.59
2 89.77 4025 3924 50.01 2.24 6.05 8.79 13.51 7.34
3 86.70 3993 3907 49.39 1.08 7.59 12.48 17.52 6.23
4 88.16 4139 4007 53.47 2.08 4.16 6.08 10.42 5.94
5 88.67 4108 4026 52.04 1.47 7.47 11.14 12.50 6.34
Table 4 - Chemical composition and energy values of the five samples of soybean meal used to validate the equations
Equation R2 Adjusted R2 Pr>F Prediction error (%) Accuracy (kcal kg)
DE1 0.88 0.77 0.0006 2.32±1.10 93.1±44.5
DE2 0.86 0.75 0.0002 2.43±1.96 96.9±77.2
ME1 0.65 0.48 0.01 1.69±1.42 -9.4±92.7
ME2 0.66 0.46 0.02 2.93±2.08 -106.7±100.8
Table 5 - Coefficients of determination, prediction error and accuracy of the prediction equations to estimate the energy values of soybean meal for growing pigs
meal for growing pigs, with the lowest prediction error
(ep) were respectively:
DE1 = 48153 – 1586.1(CP) + 744.5(EE) + 363.6(CF)
– 1398.3(MM) + 15.5(CP2) – 170.8(EE2) – 29.3(CF2) +
5.4(ADF2) – 2.5(NDF2) + 90.6(MM2) – 48.2(EEADF) +
33(EENDF), with R² = 0.88 and ep =2.32 %;
ME1=12692 – 2397.7(MM) – 56.8(EE2) +
164.9(MM2) – 102.2(EECF) – 12.25(EEADF) +
67.6(EENDF) + 5.5(CPCF) – 2.9(CPNDF), with an R2of
0.65 and ep = 1.69 %.
Although several studies have been carried out to determine the relationship between the chemical
composition and energy value of feed (ZONTAet al., 2006;
POZZAet al., 2008a; POZZAet al., 2008b; SIQUEIRA
et al., 2011), few have reported on the applicability of the equations, making it difficult to know the degree of confidence that can be achieved with the equations
available. Thus, R2 values would allow estimation of
the fit of the equation to the original data, but would not necessarily indicate the accuracy of the equation in predicting the energy values for raw materials or feed in other than the original data.
of data, in order to estimate the accuracy of the model. Accordingly, the prediction error can be used as a way of validating the proposed prediction equations, as it determines the residual error of the model, excluding the
error attributed to mean bias (MEYERet al., 2006).
In this study, the equations that displayed the lowest prediction error and the greatest accuracy to estimate the values of digestible energy, was DE1, with
a prediction error (ep) of 2.32%, and for metabolizable
energy, it was the ME1, with ep of 1.69%. It should
be understood that a small reduction in accuracy is acceptable if it is possible to establish relationships that indicate that the energy values of the feed may be estimated from chemical measurements.
Given the equations and prediction errors obtained, determination of the energy values of soybean meal based on bromatological composition resulted in one equation to estimate the value of DE and another to estimate ME value, allowing their application since they have been validated.
CONCLUSIONS
1. From the chemical composition and correlation between the variables, it was possible to establish prediction equations to estimate the values of digestible and metabolizable energy of soybean meal for pigs;
2. Validation of the equations with a new set of data results in higher accuracy of the obtained models.
REFERENCES
ADEDOKUN, S.A.; ADEOLA, O. Metabolizable energy value of meat and bone meal for pigs. Journal of Animal Science, v. 83, p. 2519-2526, 2005.
AGUIRRE, L. Introdução à identificação de Sistemas: técnicas lineares e não-lineares aplicadas a sistemas reais. Belo Horizonte, Minas Gerais, 2.ed., 2004. 714p.
AOAC. Official methods of analysis of the Association Analytical Chemists. 18.ed. Gaithersburg, Maryland, 2005. CASTILHA, L.D.et al. Modelos matemáticos para predição dos valores energéticos do milho para suínos.Revista Brasileira de Saúde e Produção Animal, v. 12, p. 456-467, 2011.
COSTA, M.A.L.et al. Validação das Equações do NRC (2001) para Predição do Valor Energético de Alimentos nas Condições Brasileiras.Revista Brasileira de Zootecnia, v. 34, n. 1, p. 280-287, 2005.
DRAPER, N.R.; SMITH, H.Applied regression analysis.2.ed. New York: John Wiley, 1981. 709p.
JUST, A.; JORGENSEN, H.; FERNANDEZ, J.A. Prediction of metabolizable energy for pigs on the basis of crude nutrients in the feeds. Livestock Production Science, Amsterdam, v. 11, p. 105-128, 1984.
MATERSON, L.D.; POTTER, L.M.; STUTZ, M.W. The metabolizable energy of feed ingredients for chickens.Research Report, v. 7, n. 1, p. 11-14, 1965.
MENDES, W.S. et al. Composição química e valor nutritivo da soja crua e submetida a diferentes processamentos térmicos para suínos em crescimento.Arquivo Brasileiro de Medicina Veterinária e Zootecnia, v. 56, n. 2, p. 207-213, 2004. MEYER, P.M. et al. Validação de modelos de predição de nitrogênio uréico no leite, estimando-se o consumo individual pelo consumo do rebanho.Acta Scientiarum - Animal Sciences, Maringá, v. 28, n. 1, p. 73-79, 2006
NASCIMENTO, G.A.J.et al. Equações de predição para estimar os valores da EMAn de alimentos protéicos para aves utilizando a meta-análise.Revista Brasileira de Zootecnia, Viçosa, v. 40, n. 10, p. 2172-2177, 2011.
NATIONAL RESEARCH COUNCIL.Nutrient requirements
of swine. 11th rev. ed. Washington: National Academic,
2012. 400p.
NOBLET, J.; PEREZ, J.M. Prediction of digestibility of nutrients and energy values of pig diets from chemical analysis.Journal of Animal Science, v. 71, p. 3389-3398, 1993.
OLUKOSI, O.A.; ADEOLA. O. Estimation of the metabolizable energy content of meat and bone meal for swine, 2009.Journal of Animal Science, v. 87, p. 2590-2599, 2009.
OST, P.R. et al. Valores energéticos de sojas integrais e de farelos de soja, determinados com galos adultos e por equações de predição.Ciência e Agrotecnologia, v. 29, n. 2, p .467-475, 2005.
POZZA, P.C. et al. Composição química, digestibilidade e predição dos valores energéticos da farinha de carne e ossos para suínos.Acta Scientiarum - Animal Science, v. 30, n. 1, p. 33-40, 2008a.
POZZA, P.C. et al. Determinação e predição dos valores de energia digestível e metabolizável da farinha de vísceras para suínos.Revista Brasileira de Saúde e Produção Animal, v. 9, n. 4, p. 734-742, 2008b.
RIEGER, C.et al. Características químicas e valores energéticos de farelos de soja do oeste e sudoeste do Paraná.Ciência Rural, Santa Maria, v.38, n. 1, p. 266-269, 2008.
ROSTAGNO, H.S. et al. Tabelas brasileiras para aves e suínos: composição de alimentos e exigências nutricionais.
3.ed. Viçosa: Universidade Federal de Viçosa, 2011. 252p. SAKOMURA, N.K.; ROSTAGNO, H.S.Métodos de Pesquisa
em Nutrição de Monogástricos. Jaboticabal: FUNEP, 2007,
283p.
SIBBALD, I.R. Measurement of bioavailable energy in poultry feedingstuffs: a review.Canadian Journal of Animal Science, v. 62, p. 983-1048, 1982.
SILVA, J.H.V. et al. Energia metabolizável de ingredientes determinada com codornas japonesas (Coturnix coturnix japonica).Revista Brasileira de Zootecnia, v. 32, n. 6, p. 1912-1918, 2003.
SIQUEIRA, J.C. et al. Equações de predição da energia metabolizável da torta de babaçu para frangos de corte.Revista Brasileira de Saúde e Produção Animal, Salvador, v. 12, n .4, p. 1016-1025, 2011.
TUCCI, F.M.et al. Determinação da composição química e dos valores energéticos de alguns alimentos para aves.Acta Scientiarum Animal Sciences, v. 25, n. 1, p. 85-89, 2003.
VAN SOEST, P.J.; ROBERTSON, J.B.; LEWIS, B.A. Methods for dietary fiber, neutral detergent fiber, and nonstarch polysaccharides in relation to animal nutrition.Journal Dairy Science, v. 74, p. 3583-3597, 1991.
ZAMBOM, M.A. et al. Valor nutricional da casca do grão de soja, farelo de soja, milho moído e farelo de trigo para bovinos.
Acta Scientiarum - Animal Science, Maringá, v. 23, n. 4, p. 937-943, 2001.
ZONTA, M.C.M.et al. Energia metabolizável de farinhas de soja ou produtos de soja, determinada pelo método de coleta total e por equações de predição.Archivos de Zootecnia, v. 55, n. 209, p. 21-30, 2006.