This is an Open Access article distributed under the terms of the Creative Commons Attribution License, which permits unrestricted use, distribution, and reproduction in any medium, provided the original work is properly cited.
Enzyme optimization to reduce the viscosity of pitanga (Eugenia uniflora L.) juice
Otimização enzimática para reduzir a viscosidade de suco de pitanga (Eugenia uniflora L.)
Summary
The aim of this work was to separately evaluate the effects of pectinase and cellulase on the viscosity of pitanga juice, and determine the optimum conditions for their use employing response surface methodology. The independent variables were pectinase concentration (0-2.0 mg.g–1) and cellulase concentration (0-1.0 mg.g–1), activity time (10-110 min) and incubation temperature (23.2-56.8 °C). The use of pectinase and cellulase reduced the viscosity by about 15% and 25%, respectively. The results showed that enzyme concentration was the most important factor followed by activity time, and for the application of cellulase the incubation temperature had a significant effect too. The regression models showed correlation coefficients (R2) near to 0.90. The pectinase application conditions that led to the lowest viscosity were: concentration of 1.7 mg.g–1, incubation temperature of 37.6 °C and incubation time of 80 minutes, while for cellulase the values were: concentration of 1.0 mg.g-1, temperature range of 25 °C to 35 °C and incubation time of 110 minutes.
Keywords: Pectinase; Cellulose; Viscosity; Pitanga juice.
Resumo
O objetivo deste trabalho foi avaliar o efeito da pectinase e da celulase, separadamente, sobre a viscosidade do suco de pitanga, além de otimizar as condições de seu uso. Empregou-se para este estudo a metodologia de superfície de resposta. As variáveis independentes foram concentração de pectinase (0-2,0 mg.g–1) e concentração de celulase (0-1,0 mg.g–1), tempo de atividade (10-110 min) e temperatura de incubação (23,2-56,8 °C). As aplicações de pectinase e celulase resultaram em redução da viscosidade em torno de 15% e 25%, respectivamente. Os resultados indicaram que a concentração enzimática foi o fator mais importante, seguida pelo tempo de incubação e, para a aplicação de celulase, a temperatura também teve efeito significativo. Os modelos de regressão apresentaram coeficiente de correlação (R2) em torno de 0,90. As condições de aplicação para pectinase, que resultaram em suco com menor viscosidade, foram concentração de 1,7 mg.g–1, temperatura de incubação de 37,6 °C e tempo de atividade de 80 minutos, enquanto que, para celulase, as condições de aplicação foram concentração de 1,0 mg.g–1, faixa de temperatura entre 25 e 35 °C, e tempo de atividade de 110 minutos.
Palavras-chave: Pectinase; Celulase; Viscosidade; Suco de pitanga.
Ricardo Schmitz Ongaratto1*, Luiz Antonio Viotto1
1 Universidade Estadual de Campinas (UNICAMP), Faculdade de Engenharia de Alimentos (FEA), Departamento de Engenharia de Alimentos (DEA),
Campinas/SP – Brasil
*Corresponding Author
Ricardo Schmitz Ongarato, Universidade Estadual de Campinas (UNICAMP), Faculdade de Engenharia de Alimentos (FEA), Departamento de Engenharia de Alimentos (DEA), Cidade Universitária Zeferino Vaz, Caixa Postal: 6121, CEP: 13083-862, Campinas/SP - Brasil, e-mail: [email protected]
Cite as: Enzyme optimization to reduce the viscosity of pitanga (Eugenia uniflora L.) juice. Braz. J. Food Technol., v. 19, e2015041, 2016.
Received: Jun. 09, 2015; Accepted: Fev. 05, 2016
1 Introduction
A great variety of new products based on clarified fruit juices have appeared on the market such as soft drinks, fruit cocktails, flavoured water, alcoholic beverages and fruit flavoured iced teas, amongst others (VAILLANT et al., 2001). Transparency and homogeneity are essential properties for such products and they can only be obtained through the complete removal of suspended solids (SIN et al., 2006).
Pitanga (Eugenia uniflora L.), also known as Suriname cherry or Brazilian cherry, is a tropical fruit belonging to the Myrtaceae family. It is native to Brazil, especifically to the South and Southeast regions (BEZERRA et al., 2000). The fruit has a high carotenoid content (225.9 µg.g–1) and lycopene represents 32% of the total value and a significant concentration of vitamin A (991 ER.100 g–1) (CAVALCANTE; RODRIGUEZ-AMAYA, 1992). Up to 2006, the state of Pernambuco, Brazil had the largest commercial scale plantation of this fruit in Latin America, with a production between 1300 and 1700 ton/ year (SILVA, 2006). Although some studies with Brazilian cherry do exist (LOPES et al., 2005; ONGARATTO; VIOTTO, 2009; LOPES et al., 2013; FREITAS et al., 2014) there is a considerable deficiency of data on the processing of this tropical fruit.
Of all the fluid properties, viscosity requires the greatest attention in fluid flow studies (HAMINIUK, 2005). It is known that the lower the viscosity of the fluid, the less the drop in pressure during the flow, thereby lowering the power needed for pumping and consequently reducing electricity costs (VIDAL et al., 2006). In the microfiltration process, the lower permeate fluxes were related to the presence of suspended solids (pectin and fibres) and, consequently, higher viscosities (BARRETO et al., 2013). A combination of pectinases, cellulases and hemicellulases, collectively called macerating enzymes, are related to the extraction and clarification of juices, but they also have an effect in reducing viscosity (BHAT, 2000; BARROSI et al., 2004). The use of enzymes in the fruit pulp reduces viscosity considerably, mainly because they break up the pectin molecules and reduce the size of the fibre particles contained in the pulp (BEN-SHALON, 1986; SREENATH et al., 1994; MUTLU et al., 1999; BARROSI et al., 2004).
Response surface methodology is one of the most efficient tools for optimizing bio-systems because it makes it possible to evaluate the interactive effects among the variables being studied (RAI et al., 2004; LEE et al., 2006). The optimization of operating parameters for enzyme treatments involving the application of pectinase have already been studied in the case of banana juice (LEE et al., 2006), star fruit juice (ABDULLAH et al., 2007), sweet orange juice (RAI et al., 2004) and sapodilla juice (SIN et al., 2006). However no such studies have been carried out with cellulases.
The aim of this study was to establish the optimum process conditions (enzyme concentration for pectinase and cellulase in separate applications, activity time and incubation temperature), using response surface methodology to reduce the viscosity of pitanga juice.
2 Material and methods
2.1 Enzymes
Two enzymes were used: Pectinex Ultra SP-L, a pectinase obtained from Aspergillus niger; and Cellubrix L, a cellulase obtained from Trichoderma
reesi, both supplied by the company Novozymes Latin America Ltda (Paraná, Brazil). These enzymes are used by the food industry to reduce the viscosity of fruit pulps and/or to help in the process of clarification. The activity values for pectinase and cellulase were 9500 PGU.mL–1 and 700 EGU.g–1, respectively. An aqueous solution of each enzyme in distilled water was prepared (0.5 v/v) to facilitate its application into the juice, since the enzyme concentration in the trials and the volume of juice to be treated were small.
2.2 Preparation of the juice samples
In this study a commercial brand (De Marchi, São Paulo, Brazil) of frozen pitanga pulp was used. The pulp was defrosted in a thermostatic bath (model NT281, Nova Técnica, Piracicaba, SP, Brazil), homogenized and diluted in the proportion of one part of pulp to two parts of water, by weight, in accordance with the manufacturer’s recommendations for obtaining an ideal juice for consumption. The juice was then separated into individual 200 g portions and frozen again. Samples of the fresh juice were taken at this point to measure the viscosity of the untreated juice.
2.3 Enzyme treatment
The juice samples were defrosted in a thermostatic bath at a controlled temperature of 30 °C over a period of 45 minutes. According to the experimental design, for the hydrolysis process the defrosted pulp was placed in a 250 mL Erlenmeyer flask, which was then closed and heated in the thermostatic bath up to the hydrolysis temperature (ABDULLAH et al., 2007). The enzyme solution was then added to the pulp and placed in a shaker (model TE-421, Tecnal, Piracicaba, SP) where it was maintained at a controlled temperature and agitation frequency (150 rpm) according to the different activity times. At the end of each procedure the sample was removed and heated in a thermostatic bath up to 80 °C for 5 minutes to guarantee inactivation of the enzymes as recommended by the manufacturer. It was then cooled to 30 °C.
2.3.1 Experimental design
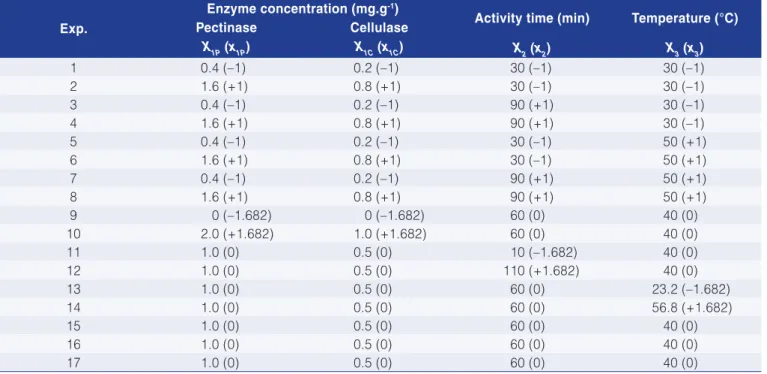
To optimize the operating conditions of the enzymatic treatment, a 23 central composite design with three central points and six axial points, totalling 17 tests, was used for each enzyme, similar to the experimental design reported by Rai et al. (2004). Table 1 shows the levels of the independent variables – real values (X) and coded values (x): pectinase concentration (x), cellulase concentration (x), activity time (x) and incubation temperature (x).
taken to measure the viscosity (dependent variable – y) and the results of the experimental design were analysed using response surface methodology and the Statistica, version
7.0 software program. For each enzyme the dependent variable was expressed individually as a function of the independent variables (response function). The variance for each factor was divided into linear, quadratic and interactive components that were represented in the form of a second order polynomial (Equation 1):
= + + + + + +
+ + +
2 2
0 1 1 2 2 3 3 11 1 22 2
33 12 1 2 13 1 3 23 2 3 y b b x b x b x b x b x
b x b x x b x x b x x (1)
The coefficients of the polynomial were represented by b (constant term), b, b and b (linear coefficients), b, b and b (quadratic coefficients) and b, b and b (interaction coefficients). The significance of all the terms of the polynomial was calculated statistically using p-values of 0.001, 0.01 and 0.05. The regression coefficients were then used to generate the response surfaces of the regression model. The response surfaces and contour curves were generated always keeping one of the variables at the central point and varying the others within the experimental ranges.
The conversions of the coded values to the real values for the variables pectinase concentration (X), cellulase concentration (X), activity time (X) and incubation temperature (X) are shown in Equations 2-5 respectively:
( )
= +1P 1
X % 0.06x 0.1 (2)
( )
= +1C 1
X % 0.03x 0.05 (3)
(
)
=(
+)
2 2
X min 30 x 2 (4)
( )
=(
+)
3 3
X C 10 x 4 (5)
2.4 Viscosity
The viscosity of the juice was measured according to Lee et al. (2006), Sin et al. (2006) and Abdullah et al. (2007) using a Brookfield viscosimeter (Model LVDV-II+, Brookfield Engineering Laboratory, Inc., Middleboro, USA) at 30, 50, 70, 90 and 120 rpm with the SC4-18 spindle. All viscosity analyses were done three times at a temperature of 30 ºC ±1 °C and the viscosities were expressed in mPa.s.
3 Results and discussion
3.1 Pectinase
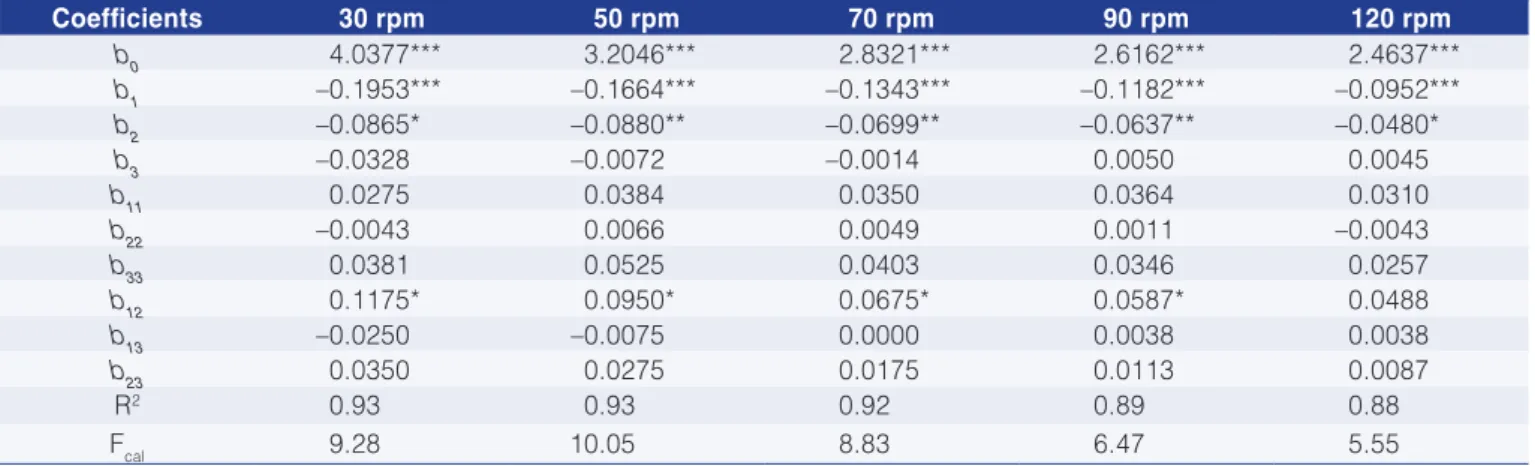
Table 2 shows the results for the apparent viscosity at different deformation rates (spindle rotation velocities) while the regression coefficients of the model Equation 1 for the enzyme treatment using pectinase are given in Table 3.
Irrespective of the enzyme treatment the juice showed a pseudoplastic behaviour, since the viscosity decreased as the deformation rate increased (Table 2). The same effect was found for the untreated juice. The pseudoplastic behaviour of pitanga pulp was already reported by Lopes et al. (2013). The conditions of experiment 10 resulted in a greater viscosity decrease when compared to the untreated juice. For this trial a reduction in viscosity of around 15% was observed.
The apparent viscosity was influenced mostly by enzyme concentration, followed by activity time and by the interaction between these factors (Table 3). Furthermore, Table 1. Matrix of the experimental design for the enzymatic treatment of pitanga juice.
Exp.
Enzyme concentration (mg.g-1)
Activity time (min) Temperature (°C)
Pectinase Cellulase
X1P (x1P) X1C (x1C) X2(x2) X3 (x3)
1 0.4 (–1) 0.2 (–1) 30 (–1) 30 (–1)
2 1.6 (+1) 0.8 (+1) 30 (–1) 30 (–1)
3 0.4 (–1) 0.2 (–1) 90 (+1) 30 (–1)
4 1.6 (+1) 0.8 (+1) 90 (+1) 30 (–1)
5 0.4 (–1) 0.2 (–1) 30 (–1) 50 (+1)
6 1.6 (+1) 0.8 (+1) 30 (–1) 50 (+1)
7 0.4 (–1) 0.2 (–1) 90 (+1) 50 (+1)
8 1.6 (+1) 0.8 (+1) 90 (+1) 50 (+1)
9 0 (–1.682) 0 (–1.682) 60 (0) 40 (0)
10 2.0 (+1.682) 1.0 (+1.682) 60 (0) 40 (0)
11 1.0 (0) 0.5 (0) 10 (–1.682) 40 (0)
12 1.0 (0) 0.5 (0) 110 (+1.682) 40 (0)
13 1.0 (0) 0.5 (0) 60 (0) 23.2 (–1.682)
14 1.0 (0) 0.5 (0) 60 (0) 56.8 (+1.682)
15 1.0 (0) 0.5 (0) 60 (0) 40 (0)
16 1.0 (0) 0.5 (0) 60 (0) 40 (0)
it can be stated that the model fitted the experimental data well as the correlation coefficient (R2) was around 0.90 in all cases.
Both the pectinase concentration and the incubation time had a linear negative effect on the responses. The lowest viscosity values were obtained for the higher values of these parameters. However, the results showed no significant differences irrespective of the activity time, at concentrations above 1.6 mg.g–1 (Figure 1). Lee et al. (2006) and Abdullah et al. (2007) reported similar behaviour for banana juice and starfruit juice respectively. Both studies used the same enzyme as used in the present study. Sin et al. (2006) applied Pectinex 3X L as a pre-treatment for orange juice and the results showed that enzyme concentration, incubation temperature and activity time had a significant linear effect in reducing viscosity, as did the quadratic temperature and the interaction between time and concentration.
Pectic substances have a strong capacity for retaining water and creating a cohesive structure.
Table 2. Apparent viscosity results in mPa.s for the juice treated with Pectinex Ultra SP-L.
Exp 30 rpm 50 rpm 70 rpm 90 rpm 120 rpm
1 4.55±0.15 3.68±0.11 3.20±0.09 2.92±0.08 2.70±0.02
2 3.86±0.06 3.12±0.07 2.75±0.05 2.53±0.06 2.38±0.04
3 3.96±0.12 3.20±0.07 2.83±0.07 2.60±0.05 2.43±0.04
4 3.98±0.13 3.20±0.08 2.80±0.06 2.58±0.05 2.43±0.05
5 4.42±0.04 3.58±0.02 3.14±0.01 2.89±0.02 2.67±0.01
6 3.87±0.05 3.17±0.05 2.84±0.03 2.65±0.02 2.49±0.04
7 4.21±0.09 3.39±0.06 2.99±0.02 2.75±0.03 2.56±0.02
8 3.89±0.06 3.18±0.05 2.81±0.07 2.61±0.05 2.45±0.05
9 4.46±0.09 3.62±0.06 3.18±0.05 2.96±0.05 2.76±0.04
10 3.79±0.10 2.97±0.06 2.66±0.06 2.47±0.05 2.35±0.05
11 4.19±0.05 3.39±0.03 2.97±0.02 2.74±0.03 2.54±0.03
12 3.88±0.03 3.02±0.03 2.70±0.03 2.49±0.03 2.37±0.02
13 4.30±0.12 3.40±0.11 3.00±0.09 2.77±0.07 2.59±0.06
14 4.01±0.13 3.27±0.08 2.87±0.07 2.65±0.07 2.49±0.06
15 4.01±0.08 3.26±0.06 2.87±0.05 2.65±0.04 2.47±0.04
16 4.11±0.29 3.21±0.17 2.83±0.14 2.62±0.12 2.48±0.11
17 3.99±0.11 3.15±0.08 2.80±0.07 2.58±0.05 2.44±0.04
Untreated juice 4.46±0.05 3.60±0.02 3.18±0.02 2.94±0.02 2.77±0.02
Table 3. Regression coefficients for Equation 1 corresponding to the enzyme treatment with pectinase.
Coefficients 30 rpm 50 rpm 70 rpm 90 rpm 120 rpm
b0 4.0377*** 3.2046*** 2.8321*** 2.6162*** 2.4637***
b1 –0.1953*** –0.1664*** –0.1343*** –0.1182*** –0.0952***
b2 –0.0865* –0.0880** –0.0699** –0.0637** –0.0480*
b3 –0.0328 –0.0072 –0.0014 0.0050 0.0045
b11 0.0275 0.0384 0.0350 0.0364 0.0310
b22 –0.0043 0.0066 0.0049 0.0011 –0.0043
b33 0.0381 0.0525 0.0403 0.0346 0.0257
b12 0.1175* 0.0950* 0.0675* 0.0587* 0.0488
b13 –0.0250 –0.0075 0.0000 0.0038 0.0038
b23 0.0350 0.0275 0.0175 0.0113 0.0087
R2 0.93 0.93 0.92 0.89 0.88
Fcal 9.28 10.05 8.83 6.47 5.55
*p-value < 0.05; **p-value < 0.01; ***p-value < 0.001; Ftab: F9; 7; 0.1 = 2.72; F9; 7; 0.05 = 3.68; F9; 7; 0.01 = 6.72.
The degradation of the pectin by the enzymes reduces the retention capacity of such structures thereby increasing the amount of free water in the system, with a consequent reduction in viscosity (LEE et al., 2006; SIN et al., 2006; ABDULLAH et al., 2007; MAKTOUF et al., 2014).
The response surfaces and the contour curves for the variable of temperature were not plotted due to its small significance, considering a significance level of 90%. Response surfaces were only plotted for the 90 rpm setting to facilitate the comparison with other similar studies. Furthermore, the response surfaces obtained for other values of deformation rates were very similar to those presented in this paper.
The optimum conditions were obtained from the regression coefficients of the coded model shown in Table 3. The model obtained was partially derived with respect to x, x and x, and the following coded values were obtained: x=1.11, x=0.66 and x=-0.24. The coded values transformed into real values indicated the optimum pectinase concentration as 1.7 mg.g–1 and optimum incubation conditions as 80 minutes at 37.6 °C.
3.2 Celullase
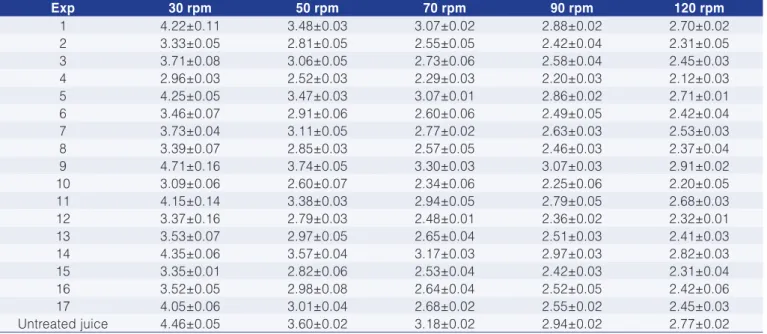
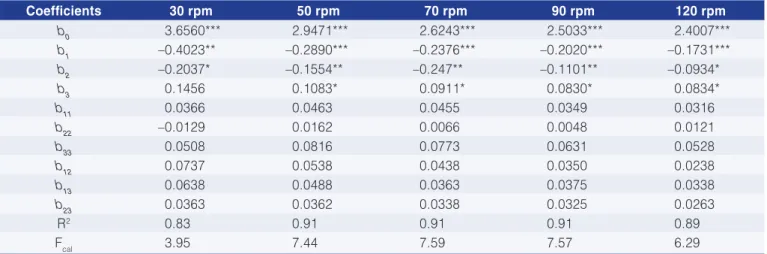
Table 4 shows the apparent viscosity values at different deformation rates while the regression coefficients for the enzyme treatment with cellulose are given in Table 5.
The greatest reduction in viscosity was obtained with the conditions of experiment 4, which resulted in a decrease in viscosity between 23% and 34% for the spindle speed variation from 30 to 120 rpm, respectively. The enzyme concentration and incubation time had a negative linear effect on the pitanga juice viscosity, while temperature had a positive linear effect (Table 5). At a
spindle speed of 30 rpm only the enzyme concentration and the activity time produced a significant effect. Furthermore the proposed models fitted the experimental data well since the correlation coefficient (R2) was above 0.89 except for 30 rpm, where the R2 value was 0.83.
The reduction in viscosity is associated with the reduction in suspended solids, represented mainly by the fibres (VIDAL et al., 2006). Thus, for efficient reduction of viscosity the application of enzymes such as cellulases, which are able to act on the fibrous particles, is needed. In Figure 2 it is clear that the lowest viscosity values corresponded to the higher enzyme concentrations and the longer activity times and Figure 3 shows that the higher the temperature, the less effective the
Table 4. Apparent viscosity results in mPa.s for juice treated with Cellubrix-L.
Exp 30 rpm 50 rpm 70 rpm 90 rpm 120 rpm
1 4.22±0.11 3.48±0.03 3.07±0.02 2.88±0.02 2.70±0.02
2 3.33±0.05 2.81±0.05 2.55±0.05 2.42±0.04 2.31±0.05
3 3.71±0.08 3.06±0.05 2.73±0.06 2.58±0.04 2.45±0.03
4 2.96±0.03 2.52±0.03 2.29±0.03 2.20±0.03 2.12±0.03
5 4.25±0.05 3.47±0.03 3.07±0.01 2.86±0.02 2.71±0.01
6 3.46±0.07 2.91±0.06 2.60±0.06 2.49±0.05 2.42±0.04
7 3.73±0.04 3.11±0.05 2.77±0.02 2.63±0.03 2.53±0.03
8 3.39±0.07 2.85±0.03 2.57±0.05 2.46±0.03 2.37±0.04
9 4.71±0.16 3.74±0.05 3.30±0.03 3.07±0.03 2.91±0.02
10 3.09±0.06 2.60±0.07 2.34±0.06 2.25±0.06 2.20±0.05
11 4.15±0.14 3.38±0.03 2.94±0.05 2.79±0.05 2.68±0.03
12 3.37±0.16 2.79±0.03 2.48±0.01 2.36±0.02 2.32±0.01
13 3.53±0.07 2.97±0.05 2.65±0.04 2.51±0.03 2.41±0.03
14 4.35±0.06 3.57±0.04 3.17±0.03 2.97±0.03 2.82±0.03
15 3.35±0.01 2.82±0.06 2.53±0.04 2.42±0.03 2.31±0.04
16 3.52±0.05 2.98±0.08 2.64±0.04 2.52±0.05 2.42±0.06
17 4.05±0.06 3.01±0.04 2.68±0.02 2.55±0.02 2.45±0.03
Untreated juice 4.46±0.05 3.60±0.02 3.18±0.02 2.94±0.02 2.77±0.02
enzyme treatment was, especially in the case of high cellulose concentrations. Furthermore, for higher enzyme concentrations the optimum temperature range was from 25 °C to 45 °C, but when the time factor was taken into consideration the range fell from 25 °C to 35 °C (Figure 4).
It was not possible to determine the optimum conditions for the application of cellulase by mathematical derivation from the model given by the response surfaces found. Thus the determination was carried out by analysing the contour curves obtained. Thus it can be stated that the optimum conditions for cellulase application corresponded to the maximum enzyme concentration (1.0 mg.g–1), the maximum activity time and incubation temperatures range from 25 °C to 35 °C (Figure 4).
4 Conclusion
The application of pectinase resulted in a reduction in viscosity of around 15%, while in the case of cellulase, it was more than 23%. Thus cellulases would be the most appropriate to use when the objective is to reduce the viscosity of pitanga juice. By using response surfaces, contour curves and derivation techniques it was possible to obtain a definition of the optimum application conditions for the enzymes investigated. The main parameters responsible for the reduction in viscosity were enzyme concentration and activity time. The recommended conditions for pectinase treatments are: enzyme concentration of 1.7 mg.g–1 at 37.6 °C for 80 minutes and for treatments using cellulase: 1.0 mg.g–1 at temperatures between 25 °C and 35 °C for 110 minutes.
Acknowledgements
The authors are grateful to CAPES for granting a scholarship to the first author.
Table 5. Regression coefficients for Equation 1 corresponding to the enzyme treatment with cellulose.
Coefficients 30 rpm 50 rpm 70 rpm 90 rpm 120 rpm
b0 3.6560*** 2.9471*** 2.6243*** 2.5033*** 2.4007***
b1 –0.4023** –0.2890*** –0.2376*** –0.2020*** –0.1731***
b2 –0.2037* –0.1554** –0.247** –0.1101** –0.0934*
b3 0.1456 0.1083* 0.0911* 0.0830* 0.0834*
b11 0.0366 0.0463 0.0455 0.0349 0.0316
b22 –0.0129 0.0162 0.0066 0.0048 0.0121
b33 0.0508 0.0816 0.0773 0.0631 0.0528
b12 0.0737 0.0538 0.0438 0.0350 0.0238
b13 0.0638 0.0488 0.0363 0.0375 0.0338
b23 0.0363 0.0362 0.0338 0.0325 0.0263
R2 0.83 0.91 0.91 0.91 0.89
Fcal 3.95 7.44 7.59 7.57 6.29
*p-value < 0.05; **p-value < 0.01; ***p-value < 0.001; Ftab: F9; 7; 0.1 = 2.72; F9; 7; 0.05 = 3.68; F9; 7; 0.01 = 6.72.
Figure 3. Effect of enzyme concentration and incubation temperature on the apparent viscosity at 90 rpm for the application of Cellubrix L.
(Mestrado em Tecnologia de Alimentos)-Universidade Federal do Paraná, Curitiba, 2005.
LEE, W. C.; YUSOF, S.; HAMID, N. S. A.; BAHARIN, B. S. Optimizing conditions for enzymatic clarification of banana juice using response surface methodology (RSM). Journal of Food Engineering, Essex, v. 73, n. 1, p. 55-63, 2006. http://dx.doi. org/10.1016/j.jfoodeng.2005.01.005.
LOPES, A. S.; MATTIETTO, R. A.; MENEZES, H. C. Estabilidade da polpa de pitanga sob congelamento. Food Science and Technology, Campinas, v. 25, n. 3, p. 553-559, 2005. http:// dx.doi.org/10.1590/S0101-20612005000300026.
LOPES, A. S.; MATTIETTO, R. A.; MENEZES, H. C.; SILVA, L. H. M.; PENA, R. S. Rheological behavior of Brazilian Cherry (Eugenia uniflora L.) pulp at pasteurization temperatures. Food Science and Technology, Campinas, v. 33, n. 1, p. 26-31, 2013. http://dx.doi.org/10.1590/S0101-20612013005000001.
MAKTOUF, S.; NEIFAR, M.; DRIRA, S. J.; BAKLOUTI, S.; FENDRI, M.; CHÂABOUNI, S. E. Lemon juice clarification using fungal pectinolytic enzymes coupled to membrane ultrafiltration. Food and Bioproducts Processing, Rugby, v. 92, n. 1, p. 14-19, 2014. http://dx.doi.org/10.1016/j.fbp.2013.07.003.
MUTLU, M.; SARIOGLU, K.; DEMIR, N.; ERCAN, M. T.; ACAR, J. The use of commercial pectinase in fruit juice industry. Part I: viscosimetric determination of enzyme activity. Journal of Food Engineering, Essex, v. 41, n. 2-3, p. 147-150, 1999. http://dx.doi. org/10.1016/S0260-8774(99)00088-6.
ONGARATTO, R. S.; VIOTTO, L. A. Clarificação do suco de pitanga (Eugenia uniflora L.) e concentração de carotenoides por microfiltração e ultrafiltração. Brazilian Journal of Food Technology, Campinas, VIIBMCFB, p. 85-93, 2009.
RAI, P.; MAJUMDAR, G. C.; DASGUPTA, S.; DE, S. Optimizing pectinase usage in pretreatment of mosambi juice for clarification by response surface methodology. Journal of Food Engineering, Essex, v. 64, n. 3, p. 397-403, 2004. http://dx.doi. org/10.1016/j.jfoodeng.2003.11.008.
SANTHALAKSHMY, S.; DON BOSCO, S. J.; FRANCIS, S.; SABEENA, M. Effect of inlet temperature on physicochemical properties of spray-dried jamun fruit juice powder. Powder Technology, Lousanne, v. 274, n. 1, p. 37-43, 2015. http://dx.doi. org/10.1016/j.powtec.2015.01.016.
SILVA, S.M. Pitanga. Revista Brasileira de Fruticultura, Jaboticabal, v. 28, n. 1, p. 1-159, 2006. http://dx.doi.org/10.1590/ S0100-29452006000100001.
SIN, H. N.; YUSOF, S.; HAMID, N. S. A.; RAHMAN, R. A. Optimization of enzymatic clarification of sapodilla juice using response surface methodology. Journal of Food Engineering, Essex, v. 73, n. 4, p. 313-319, 2006. http://dx.doi.org/10.1016/j. jfoodeng.2005.01.031.
SREENATH, H. K.; SUDARSHANAKRISHNA, K. R.; SANTHANAM, K. Improvement of juice recovery from pineapple pulp/residue References
ABDULLAH, A. G. L.; SULAIMAN, N. M.; AROUA, M. K.; MEGAT MOHD NOOR, M. J. Response surface optimization of conditions for clarification of carambola fruit juice using a commercial enzyme. Journal of Food Engineering, Essex, v. 81, n. 1, p. 65-71, 2007. http://dx.doi.org/10.1016/j.jfoodeng.2006.10.013.
BARRETO, A. G.; CABRAL, L. M. C.; MATTA, V. M.; FREITAS, S. P. Clarificação de polpa de camu-camu por microfiltração. Brazilian Journal of Food Technology, Campinas, v. 16, n. 3, p. 207-215, 2013. http://dx.doi.org/10.1590/S1981-67232013005000026.
BARROSI, S. T. D.; MENDES, E. S.; PERES, L. Influence of depectinization in the ultrafiltration of West Indian cherry
(Malpighia glabra L.) and pineapple (Ananas comosus (L.) Meer) juices. Food Science and Technology, Campinas, v. 24, n. 2, p. 194-201, 2004. http://dx.doi.org/10.1590/S0101-20612004000200006.
BAUMANN, J. W. Application of enzymes in fruit juice technology. In: BIRCH, G. G.; BLAKEBROUGH, N.; PARKER, K. J. (Ed.). Enzymes and food processing. London: Applied Science Publication, 1981. p. 129-147.
BEN-SHALON, N. Hindrance of hemicellulose and cellulose hydrolysis by pectic substances. Journal of Food Science, Chicago, v. 51, n. 3, p. 720-722, 1986. http://dx.doi. org/10.1111/j.1365-2621.1986.tb13919.x.
BEZERRA, J. E. F.; SILVA JUNIOR, J. F.; LEDERMAN, I. E. Pitanga (Eugenia uniflora L.). Jaboticabal: Funep, 2000. 30 p.
BHAT, M. K. Cellulases and related enzymes in biotechnology. Biotechnology Advances, New York, v. 18, n. 5, p. 355-383, 2000. http://dx.doi.org/10.1016/S0734-9750(00)00041-0. PMid:14538100.
BILEK, S. E.; BAYRAM, S. K. Fruit juice drink production containing hydrolyzed collagen. Journal of Functional Foods, Binghamton, v. 14, n. 1, p. 562-569, 2015. http://dx.doi. org/10.1016/j.jff.2015.02.024.
CAVALCANTE, M. L.; RODRIGUEZ-AMAYA, D. B. Carotenoid composition of the tropical fruits Eugenia uniflora and Malpighia glabra. Food Science and Human Nutrition, Amsterdam, v. 29, n. 1, p. 643-650, 1992.
FREITAS, M. L. F.; DUTRA, M. B. L.; BOLINI, H. M. A. Development of pitanga nectar with difference sweeteners by sensory analysis: ideal pulp dilution, ideal sweetness, and sweetness equivalence. Food Science and Technology, Campinas, v. 34, n. 1, p. 174-180, 2014. http://dx.doi.org/10.1590/S0101-20612014005000008.
Engineering, Essex, v. 48, n. 1, p. 83-90, 2001. http://dx.doi. org/10.1016/S0260-8774(00)00152-7.
VIDAL, J. R. M. B.; SIERAKOWISKI, M. R.; HAMINIUK, C. W. I.; MASSON, M. L. Propriedades reológicas da polpa de manga (Mangifera indica L. cv Keitt) centrifugada. Ciência e Agrotecnologia, Lavras, v. 30, n. 5, p. 955-960, 2006. http:// dx.doi.org/10.1590/S1413-70542006000500020.
using cellulases and pectinases. Journal of Fermentation and
Bioengineering, Osaka, v. 78, n. 6, p. 486-488, 1994. http:// dx.doi.org/10.1016/0922-338X(94)90054-X.