Engineering ISSN: 1809-4430 (on-line)
________________________
2 Universidade Federal de Lavras/ Lavras - MG, Brasil. Bolsista CNPq, Processo: 307746/2014-3 3 Universidade Federal de Lavras/ Lavras - MG, Brasil.
Received in: 3-31-2016
CLOACAL AND SURFACE TEMPERATURES OF BROILERS SUBJECT TO THERMAL STRESS
Doi:http://dx.doi.org/10.1590/1809-4430-Eng.Agric.v37n5p877-886/2017
LUCAS H. P. ABREU1*, TADAYUKI YANAGI JUNIOR2, ALESSANDRO T. CAMPOS3,
MARCELO BAHUTI3, ÉDISON J. FASSANI3
1*Corresponding author. Universidade Federal de Lavras/ Lavras - MG, Brasil. E-mail: [email protected]
ABSTRACT: The cloacal and surface temperatures are important physiological parameters to quantify the thermal comfort of animals, its variations may occur as a function of thermal variables. In this context, the goal of the present study was to evaluate the cloacal (tclo) and surface (tsur)
temperatures of Cobb 500® broilers, in the second week of life, subjected to different air dry-bulb
temperature (24, 27, 30 and 33 °C) and stress durations (1, 2, 3 and 4 days). The experiment was carried out in four climate-controlled wind tunnels. Air relative humidity and air velocity were set at 60% and 0.2 m s-1, respectively. The t
clo and tsur were measured daily through digital thermometer
and thermographic camera, respectively. Analysis of variance and Scott Knott mean test at 5% probability were applied to the data. The results indicate that the stress by low air temperature (24 and 27 °C) resulted decreased of tclo and tsur (p<0.05, Scott-Knott test). When subjected to high air
temperature stress (33 °C), there was no significant difference (p>0.05, Scott-Knott test) compared to the control treatment (30 °C). Acclimation of broilers to thermal stress occurred from the second day of stress.
KEYWORDS: animal environment, aviculture, thermal comfort, thermographic image, physiologic parameters.
INTRODUCTION
Brazil, a country with a large territorial extension presents great climatic diversity with temperature amplitudes during the year, in which promotes complications in the broilers breeding due to the variations that occur in the environment production (Nääs et al., 2010).
Thus, in the current scenario of Brazilian poultry development it is necessary that the poultry be raised in appropriate environments so they can achieve high performance maximizing their genetic potential. Under these conditions, characterized as thermal comfort, obtain low energy expenditure to control the homoeothermic thus increasing the performance (Nascimento et al., 2014).
The cloacal (tclo) and surface (tsur) temperature are among the main physiological indicators
for thermal comfort on broilers, as they change with the variation of air dry bulb temperature (tdb),
relative humidity (RH) and luminosity (Costa et al., 2012; Ferreira et al., 2012). When tsur and tclo
variation occur, the broilers dissipate or retain heat, and part of the energy that should use to gain weight will be applied in the thermoregulatory process reducing productive responses.
Any variation in body temperature of broiler indicates that the performed changes on their surface were not enough to maintain the thermal equilibrium (Nascimento et al., 2013) indicating physiological changes.
The increase of tclo is proportional to the age (Marchini et al., 2007), and the stress caused by
high tclo results in decrease in weight gain (Costa et al., 2012). According to Oliveira et al. (2006)
According to Nääs et al. (2014), through skin analysis temperature it is possible to determine the physical healthy state of the animal. One way to evaluate the tsur on broilers is through infrared
thermography which is a procedure that does not cause interference in the ecological niche of the evaluated animal (Nascimento et al., 2011a).
Although feathers obstruct the infrared emission of the skin, the thermography allows the thermal mapping of the body (Castilho et al., 2015; Souza Junior et al., 2013) and is used in several studies to obtain the thermal responses (Barnabé et al., 2015; Mayes et al., 2014; Roberto & Souza, 2014), since the variation of the tsur is instantaneously modified when thermal changes occur in the
thermal environment of the breeding.
The aim of this study was to evaluate the average surface and cloacal temperature on broilers in the second week of life submitted to different intensities and duration of thermal stress, adjusting correlation equations between these variables.
MATERIAL AND METHODS
This research was carried out in an animal environment laboratory equipped with two air conditioning systems 18,000 BTUs each used to control and maintain room air temperature. It also contains four climate-controlled wind tunnels. Inside each wind tunnels there was a cage with dimensions of 0.40 x 0.60 m divided into three sub-distributions equal to 0.08 m² each, equipped with feeders and water fountains.
Two hundred and forty males and females broilers Cobb 500® lineage were used from same
commercial hatchery, of one day of life. For each stage were used sixty broilers with distribution of five broilers per division during the first seven days of life, that is, fifteen broilers per tunnel. Subsequently, in the second week of life, only four chicks were kept in each replicate maintaining the breeding density recommended by the manual (Cobb, 2012).
During the experimental period the broilers were fed with a balanced diet based on corn and soybean, following the nutritional recommendations by Rostagno et al. (2011). Feed and water were available ad libitum. The hygienization of the wind tunnels and cages was carried out every day to
avoid formation of gases, providing an adequate environment for broilers performance. The tclo and
tsur of the poultries were also daily evaluated.
The experiment was carried out in different stages varying the intensity of tdb applied on
broilers on second week of life. In the first seven days, the birds were kept in thermal comfort at 33 °C (Cony & Zocche, 2004). From the eighth day, the tdb levels at each stage were 24, 27 and 33 °C,
in order to provide thermal stress at both low and high air temperatures (Cony & Zocche, 2004; Curtis, 1983).
The thermal stress was applied in four levels of duration and performed on days 8, 9, 10 and 11 of the experimental period of each stage. During the second week, the air temperatures returned to thermo neutrality zone. Table 1 shows how the treatments were divided.
For the experiment, the air relative humidity was maintained at 60 ± 1% and air velocity at 0.2 ± 0.1 m s-1, characterized as comfort for broilers (Medeiros et al., 2005). The illuminance was
TABLE 1. The air dry-bulb temperature and days of maintenance of heat stress condition (in bold), applied to broilers from 1 to 21 days of age kept in climate-controlled wind tunnels.
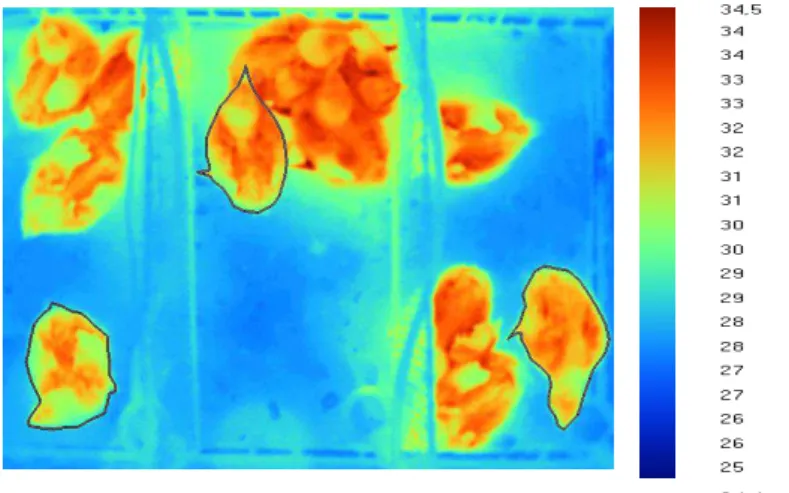
Thermographic images were used to obtain surface temperatures. The images were acquired by means of a Fluke thermographic camera (model TI55FT20/54/7.5), positioned 1 meter high from the cage, in order to allow a wide view and comprehensiveness of all the animals.
The thermographic evaluation was elaborated using the Fluke Smart View 3.0.126.0 software,
in which the adopted emissivity was 0.95 (Ferreira et al., 2011; Nääs et al., 2014). For each replicate of the cage a bird was randomly selected (Figure 1) and the average tsur was obtained as a
function of the surface areas of three broilers (Case et al., 2012; Nascimento et al., 2011b).
FIGURE 1. Thermographic image of broilers subjected to determined thermal conditions inside the climate-controlled wind tunnels.
With respect to the tclo a broiler from each part of the cage was captured randomly to have its
cycle measured, that is, twelve broilers per day totalizing forty-eight verifications per step. The measurement of tclo was performed by digital thermometer (INSTRUTHERM® São Paulo, Brazil,
Model THR-080, accuracy ± 0.01 °C), and before each use the sensor was sterilized and introduced Air dry-bulb temperature (°C)
Stage Tunnel Days of Life
1 to 7 8 9 10 11 12 13 14
1
A
33
33 30 30 30 30 30 30
B 33 33 30 30 30 30 30
C 33 33 33 30 30 30 30
D 33 33 33 33 30 30 30
2
A
33
27 30 30 30 30 30 30
B 27 27 30 30 30 30 30
C 27 27 27 30 30 30 30
D 27 27 27 27 30 30 30
3
A
33
24 30 30 30 30 30 30
B 24 24 30 30 30 30 30
C 24 24 24 30 30 30 30
D 24 24 24 24 30 30 30
into the broilers cloaca, obtaining the value of the tclo until the reading was stabilized (Costa et al.,
2012).
For the statistical analysis of the variables was used completely randomized design (C.R.D.) with three replications, assembled according to the 4x4 factorial arrangement, that is, four tdb in the
second week of broilers life (33, 30, 27 and 24 ˚C) and four stress durations (1, 2, 3 and 4 days), according to equation 1. The variables were treated by the statistical program SISVAR 5.3 (Ferreira, 2010) submitted to variance analysis and comparison means using the Scott Knott test at the 5% probability level. The data were submitted to clustering analysis (R Development Core
Team, 2012), for the construction of the dendogram of broilers tclo using Ward's method which
calculates the smallest sum of squares within the groups (Biagiotti et al., 2015).
ijk i j ij ijk
Y e
(1) In which,
ijk
Y is the observation of the repetitionkof the i-th temperature in the j-th duration with i, j =
1, 2, 3, 4 and k = 1,2,3;
is the constant associated with each observation;
i
is the effect of the i-th temperature;
j
the effect of the j-th duration;
ij
interaction between dry air bulb temperature and duration, and
ijk
e error associated with each observation, being .
RESULTS AND DISCUSSION
To verify the tdb and RH which the broilers were submitted, the thermal environment inside
the wind tunnels was monitored during the experimental period. The mean values and standard deviations observed during the second week of life are listed in Table 2.
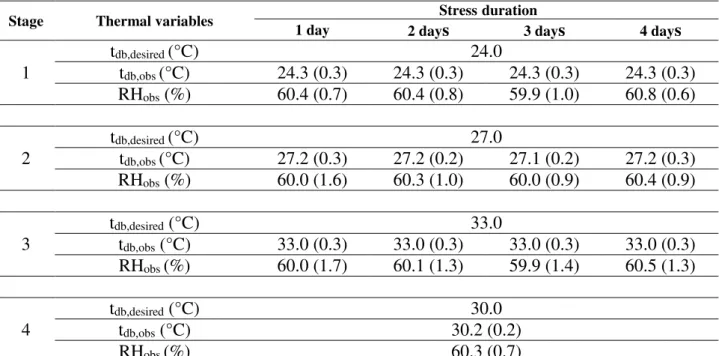
TABLE 2. Values of air dry-bulb temperature (tdb, desired) and air relative humidity (RHdesired)
desired, means observed (tdb,obs and RHobs) and standard deviations (in parentheses)
inside the climate-controlled wind tunnels.
Stage Thermal variables 1 day Stressduration
2 days 3 days 4 days
1
tdb,desired (°C) 24.0
tdb,obs (°C) 24.3 (0.3) 24.3 (0.3) 24.3 (0.3) 24.3 (0.3)
RHobs (%) 60.4 (0.7) 60.4 (0.8) 59.9 (1.0) 60.8 (0.6)
2
tdb,desired (°C) 27.0
tdb,obs (°C) 27.2 (0.3) 27.2 (0.2) 27.1 (0.2) 27.2 (0.3)
RHobs (%) 60.0 (1.6) 60.3 (1.0) 60.0 (0.9) 60.4 (0.9)
3
tdb,desired (°C) 33.0
tdb,obs (°C) 33.0 (0.3) 33.0 (0.3) 33.0 (0.3) 33.0 (0.3)
RHobs (%) 60.0 (1.7) 60.1 (1.3) 59.9 (1.4) 60.5 (1.3)
4
tdb,desired (°C) 30.0
tdb,obs (°C) 30.2 (0.2)
The observed air dry-bulb temperatures obtained low standard deviations, being close to the desired temperatures (Table 2). The highest standard deviations were 0.3 ° C for tdb and 1.7% for
RH. These variations indicate the efficiency of climate-controlled wind tunnels in maintaining the desired thermal environment, corroborating with Schiassi et al. (2014).
The interaction between tdb and duration of thermal stress for the averages tclo was not
significant (P <0.05, test F) however, the different tdb and thermal stress durations presented
significant difference (P <0.01, Test F), and the means test is listed in Table 3. The lowest tclo (40.5
°C) occurred when the broilers were submitted to the lowest thermal stress of the tdb (24 °C) with
the tclo observed being below the lower limit for the range considered as comfort which varies
from 41 to 42 °C (Oliveira et al., 2006). Thus, it is observed that the tdb of 24°C provided a
significant decrease in tclo of the broilers (P <0.05, Scott-Knott test), thus characterizing cold stress
condition (Castilho et al., 2015).
For tdb of 27°C it is observed that the tclo is within the comfort range however, significant
difference (P <0.05, Scott-Knott test) occurs in relation to the other temperatures of thermal stress. In the control treatment (tdb = 30 °C) that characterizes thermal comfort condition (Schiassi et al.,
2015, Cony & Zocche, 2004), the value of the tclo is within the comfort range. However, when
broilers were submitted to tdb of 33 °C it was found no significant difference (P <0.05, Scott-Knott
test) in relation to the control treatment. This is due to the fact that the broilers have been able to dissipate the produced heat by the metabolism to the environment (Abreu & Abreu 2011), because this value of tdb is still not enough to provide significant increase of the tclo.
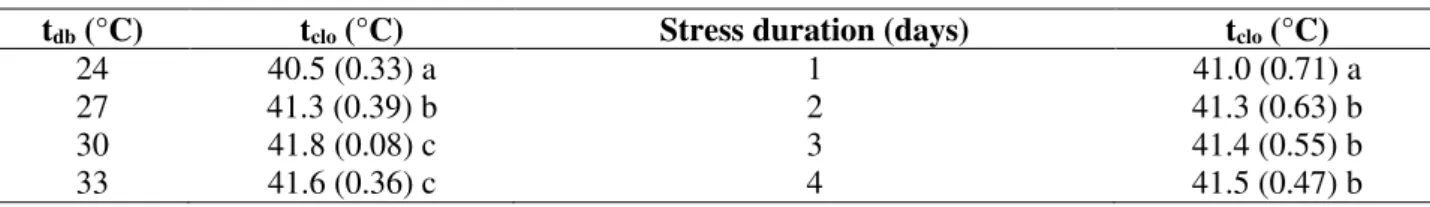
TABLE 3. Mean and standard deviations (in parentheses) of the cloacal temperature (tclo) of broilers
submitted to different intensity and duration of thermal stress during the second week of life. tdb (°C) tclo (°C) Stress duration (days) tclo (°C)
24 40.5 (0.33) a 1 41.0 (0.71) a
27 41.3 (0.39) b 2 41.3 (0.63) b
30 41.8 (0.08) c 3 41.4 (0.55) b
33 41.6 (0.36) c 4 41.5 (0.47) b
Means followed by different letters differ from one another by the Scott Knott test (P <0.05).
Regarding the thermal stress duration there was a significant difference (P <0.05, Scott-Knott test) between the first day in relation to the others (2nd, 3rd and 4th day), which are statistically the
same (P >0.05, Scott-Knott test). In this way, the broilers' ability to acclimatize confirm as reported in several studies (Alves et al., 2010; Baêta & Souza, 2010; Schiassi et al., 2015; Silva & Vieira, 2010).
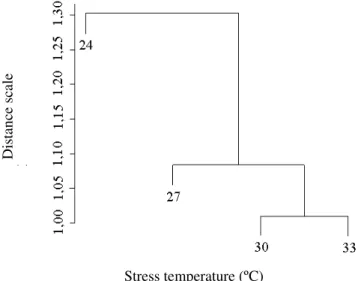
When applying the cluster analysis methodology on the tdb as a function of the tclo it is
observed that the classifications of tdb associated with the distance scale in the dendogram (Figure
FIGURE 2. Analysis in dendrogram of air dry-bulb temperature (tdb) according to the cloacal
temperature (tclo) of broilers subjected to different intensities of stress in the second
week of life.
By means of the thermographic images it was verified that the broilers average tsur reduced
and increased when submitted to low and high stress temperatures respectively, corroborating with the results obtained by several authors (Welker et al., 2008; Yahav et al., 2005).
The interaction between tdb and the thermal stress duration for the means of the tsur was
significant (P <0.05, F test) (Table 4). For one day of stress, it was observed significant difference (P <0.05, Scott-Knott test) for all used temperatures with the average variation of the tsur being 5.0
°C.
TABLE 4. Mean and standard deviations of surface temperatures (tsur) of broilers submitted to
different durations of thermal stress during the second week of life.
tdb (°C) Thermal stress duration (days)
1 2 3 4
24 30.0 (0.43) a A 31.6 (0.60) a B 31.6 (0.32) a B 30.7 (1.80) a A
27 32.0 (0.37) b A 31.0 (0.37) a A 31.2 (0.46) a A 31.4 (0.28) a A
30 34.2 (0.10) c A 33.6 (0.17) b A 33.2 (0.40) b A 33.6 (0.32) b A
33 35.0 (0.40) d A 34.1 (0.23) b B 34.0 (0,25) b B 33.6 (0.40) b B
Averages with different letters (uppercase in the row and lowercase in the column) indicate statistical differences (P <0.05) by the Scott Knott test.
For the durations of thermal stress of two, three and four days there was no significant difference (P> 0.05, Scott-Knott test) of the tsur between tdb at 24 and 27 °C (stress due to low
temperatures) and also between tdb at 30 °C (comfort) and 33°C (stress with high temperature).
However, there was a statistical difference (P <0.05, Scott-Knott test) from tsur between the two
groups of tdb (24 °C / 27 °C and 30 °C / 33 °C).
Based on the results it can be verified that when the broilers were exposed to thermal stress at low air temperature (27 °C), in relation to comfort tdb (30 °C) significant difference was found (P
<0.05, Scott-Knott test) for the tsur in four thermal stress duration. According to Cassuce et al.
(2013) the air temperature of 27 °C is comfortable in the second week of life for broilers, but the recommended comfort value in the literature for the second week is 30 °C (Schiassi et al., 2015; Cony & Zocche, 2004), and can be confirmed through the tclo and tsur observed in this study.
However, it should be emphasized that this analysis represents only the variation of two physiological parameters without considering the zootechnical responses.
Equations for estimation of the tclo and tsur were adjusted as a function of tdb (equations 2 and
3, respectively). The adjusted equations were significant (P <0.05, F test) and showed
Dis
tan
ce
s
ca
le
and (3) were significant (P <0.01, t test), and the standard errors of b0 constant were 0.39 and 0.87
and for b1 of 0.13 and 0,03, respectively.
(2)
(3)
According to eqs (2) and (3) for each degree of variation in the tdb occurs the modification of
0.13 °C and 0.36 °C for the tclo and tsur, respectively. According to Carvalho et al. (2004), the
surface temperature of broilers is subject to faster alteration, since the dissipation of the blood flow occurs through the convection. This behavior can be verified through eqs (2) and (3) in which for each degree of variation, tsur varies 2.77 times more than tclo.
Thus, when subjected to stress at low intensities (24°C) there is reduction of 0.78 and 2.16 °C for tclo and tsur respectively, and when stress occurs with high intensity (33 °C) the increase is 0.39
and 1.08 °C for tclo and tsur, respectively, when compared to comfort temperatures (30 °C).
Considering the importance of statistical analysis for correlation equations formulation between tclo as a function of tsur (Nascimento, 2010), [eq. (4)] was adjusted in which R2 was 0.75.
(4)
Through the [eq. (4)] it is possible to determine the tclo in a non-invasive way, through the use
of infrared sensors for the measurement of the tsur. Thus, it is possible to estimate tclo with minimum
stress for broilers, and in the usual methodology for the determination of tclo it is necessary the
direct contact of the thermometer with the cloaca of the broilers occurring in this way a stress factor. Equation 4 can be used in an algorithm to be shipped in microcontrollers to help the decision making regarding the activation of ventilation and evaporative cooling systems.
CONCLUSIONS
Based on the values of surface temperature (tsur) and cloacal temperature (tclo) it was found
that the thermal comfort temperature for broilers in the second week of life is 30 °C. The acclimatization of broilers to thermal stress occurred from the second day of stress. The highest variation of the tclo occurred when the broilers were submitted to low stress temperatures, and the
tsur varied according to the applied stress intensities. The correlation equations developed can be
used to support the decision making.
ACKNOWLEDGMENTS
The authors express their thanks to CAPES, to CNPq and FAPEMIG for the financial support to this research.
REFERENCES
Abreu VMN, Abreu PG (2011) Os desafios da ambiência sobre os sistemas de aves no Brasil. Revista Brasileira de Zootecnia 40:1-14. Available:
http://www.revista.sbz.org.br/artigo/visualizar.php?artigo=66253. Accessed: Sep 22, 2015. Alves AGC, Pires DAF, Ribeiro MN (2010) Conhecimento local e produção animal: Uma perspectiva baseada na Etnozootecnia. Archivos de Zootecnia 59(1):45-56. Available:
http://www.uco.es/organiza/servicios/publica/az/php/img/web/02_18_58_1588REVISIONConheci mentoAlves.pdf. Accessed: Sep 22, 2015.
Barnabé JMC, Pandorfi H, Almeida GLP, Guiselini C, Jacob AL (2015) Conforto térmico e desempenho de bezerras Girolando alojadas em abrigos individuais com diferentes coberturas. Revista Brasileira de Engenharia Agrícola e Ambiental 19(5):481-488. Available:
http://www.scielo.br/pdf/rbeaa/v19n5/1415-4366-rbeaa-19-05-0481.pdf. DOI: http://dx.doi.org/10.1590/1807-1929/agriambi.v19n5p481-488
Biagiotti D, Sarmento JLR, Rego Neto AA, Santos NPS, Figueiredo Filho LAS, Santos GV, Sena LS (2015) Diferenciação de populações ovinas encontradas no estado do Piauí. Archivos de Zootecnia 64(245):5-12. Available:
http://www.uco.es/organiza/servicios/publica/az/php/img/web/18_10_02_01_16_3206_4_17_bisC AMBIAR.pdf. Accessed: Oct 4, 2015.
Bueno JPR, Nascimento MRBM, Carvalho MC, Silva MCA, Silva PLAPA (2014) Características de termorregulação em frangos de corte, machos e fêmeas, criados em condições naturais de temperatura e umidade. Enciclopédia Biosfera 10(19):437-447. Available:
http://www.conhecer.org.br/enciclop/2014b/AGRARIAS/Caracteristicas%20de%20termorregulaca o.pdf. Accessed: Sep 20, 2015.
Carvalho LE, Oliveira SMP, Turco SHN (2004) Utilização da nebulização e ventilação forçada sobre o desempenho e a temperatura da pele de suínos em fase de terminação. Revista Brasileira de Zootecnia 33(6):1486-1491. Available: http://www.scielo.br/pdf/rbz/v33n6/a15v33n6.pdf.
Accessed: Oct 5, 2015.
Case LA, Wood BJ, Miller SP (2012) Investigation of body surface temperature measured with infrared imaging and its correlation with feed efficiency in the turkey (Meleagrisgallopavo). Journal of Thermal Biology 37(5):397-401. Available:
http://www.sciencedirect.com/science/article/pii/S0306456512000265. DOI:http://dx.doi.org/10.1016/j.jtherbio.2012.02.007
Cassuce DC, Tinôco IFF, Baêta FC, Zolnier S, Cecon PR, Vieira MFA (2013) Thermal comfort temperature update of broiler chickens up to 21 days of age. Engenharia Agrícola 33(1):28-36. Available: http://www.scielo.br/pdf/eagri/v33n1/v33n1a04.pdf. Accessed: Oct 5, 2015.
Castilho VAR, Garcia RG, Lima NDS, Nunes KC, Caldara FR, Nääs IA, Barreto B, Jacob FG (2015) Bem-estar de galinhas poedeiras em diferentes densidades de alojamento. Revista Brasileira de Engenharia de Biossistemas 9(2):122-131. Available:
http://seer.tupa.unesp.br/index.php/BIOENG/article/view/258/229. DOI:http://dx.doi.org/10.18011/bioeng2015v9n2
Cobb (2012) Broiler management guide. Cobb-Vantress USA, 65p. Available: http://67.43.0.82/docs/default-source/guides/cobb-broiler-management-guide---english.pdf?sfvrsn=8. Accessed: Jan 5, 2015.
Cony AV, Zocche AT (2004) Manejo de frangos de corte. In: Mendes A, Nääs IdeA, Macari M (ed). Produção de frangos de corte. Fundação APINCO de Ciência e Tecnologia Avícolas, p118-136.
Costa JHS, Saraiva EP, Santos LD (2012) Efeito do ambiente sobre indicadores fisiológicos na produção de frangos de corte.Revista Verde de Agroecologia e Desenvolvimento Sustentável 7(4):54-58. Available:
http://www.gvaa.com.br/revista/index.php/RVADS/article/view/1395/pdf_620. Accessed: Sep 20, 2015.
Curtis SE (1983) Environmental management in animal agriculture. Ames, The Iowa State University, 410p.
Ferreira VMOS, Francisco NS, Belloni M, Aguirre GMZ, Caldara FR, Nääs IA, Garcia RG, Almeida Paz ICL, Polycarpo GV (2011) Infrared thermography applied to the evaluation of metabolic heat loss of chicks fed with different energy densities. Brazilian Journal of Poultry Science 13(2):113-118. Available: http://www.scielo.br/pdf/rbca/v13n2/a05v13n2.pdf. Accessed: Sep 20, 2015.
Ferreira DF (2010) Programa de análises estatísticas (Statistical Analysis Software) e planejamento
de Experimentos-SISVAR 5.3. Lavras, Universidade Federal de Lavras.
Marchini CFP, Silva PL, Nascimento MRBM, Tavares M (2007) Frequência respiratória e temperatura cloacal em frangos de corte submetidos à temperatura ambiente cíclica elevada. Archives of Veterinary Science 12(1):41-46. Available:
http://ojs.c3sl.ufpr.br/ojs/index.php/veterinary/article/view/9227/6453. DOI: http://dx.doi.org/10.5380/avs.v12i1
Mayes SL, Strawford ML, Noble SD, Classen HL, Crowe TG (2014) Cloacal and surface temperatures of tom turkeys exposed to different rearing temperature regimes during the first 12 weeks of growth. Poultry Science Association 94(6):1105–1114. Available:
http://ps.oxfordjournals.org/content/94/6/1105.full.pdf+html. DOI:http://dx.doi.org/10.3382/ps/peu058
Medeiros CM, Baêta FDC, Oliveira RD, Tinôco IDFF, Albino LFT, Cecon PR (2005) Efeitos da temperatura, umidade relativa e velocidade do ar em frangos de corte. Engenharia na Agricultura 13(4):277-286. Available: http://www.ufv.br/dea/reveng/arquivos/vol13/v13n4p277-286.pdf. Accessed: May 23, 2014.
Nääs IA, Garcia RG, Caldara FR (2014) Infrared thermal image for assessing animal health and welfare. Journal of Animal Behavior and Biometeorology 2(3):66-72. Available:
http://periodicos.ufersa.edu.br/revistas/index.php/jabb/article/view/3730/5477. DOI: http://dx.doi.org/10.14269/2318-1265/jabb.v2n3p66-72
Nääs IA, Romanini CEB, Neves DP, Nascimento GR, Vercellino RA (2010) Broiler surface temperature distribution of 42 day old chickens. Scientia Agricola 67(5):497-502. Available: http://www.scielo.br/pdf/sa/v67n5/v67n5a01.pdf. Accessed: Sep 21, 2015.
Nascimento GR, Nääs IA, Baracho MS, Pereira DF, Neves DP (2014) Termografia infravermelho na estimativa de conforto térmico de frangos de corte. Revista Brasileira de Engenharia Agrícola e Ambiental 18(6):658-663. Available: http://www.scielo.br/pdf/rbeaa/v18n6/v18n6a14.pdf.
Accessed: Sep 21, 2015.
Nascimento ST, Da Silva IJO, Maia ASC, De Castro AC, Vieira FMC (2013) Mean surface temperature prediction models for broiler chickens—a study of sensible heat flow. International Journal of Biometeorology 58(2):195-201. Available:
http://link.springer.com/article/10.1007/s00484-013-0702-7. DOI:http://dx.doi.org/10.1007/s00484-013-0702-7
Nascimento GR, Pereira DF, Nääs IA, Rodrigues LHA (2011a) Índice fuzzy de conforto térmico para frangos de corte. Engenharia Agrícola 31(2):219-229. Available:
http://www.scielo.br/pdf/eagri/v31n2/a02v31n2.pdf. Accessed: Sep 21, 2015.
Nascimento GR, Nääs IA, Pereira DF, Baracho MS, Garcia R (2011b) Assessment of Broilers Surface Temperature Variation When Exposed to Different Air Temperature. Brazilian Journal of Poultry Science 13(4):259-263. Available: http://www.scielo.br/pdf/rbca/v13n4/v13n4a07.pdf. Accessed: Sep 21, 2015.
Oliveira RFM, Donzelle JL, Abreu MLT, Ferreira RA, Vaz RGMV, Cella PS (2006) Efeitos da temperatura e da umidade relativa sobre o desempenho e o rendimento de cortes nobres de frangos de corte de 1 a 49 dias de idade. Revista Brasileira de Zootecnia 35(3):797-803. Available:
http://www.scielo.br/pdf/rbz/v35n3/30072.pdf. Accessed: Sep 21, 2015.
R Development Core Team (2012) R: A language and environment for statistical computing. R Foundation for Statistical Computing.
Roberto JVB, Souza BB (2014) Utilização da termografia de infravermelho na medicina veterinária e na produção animal. Journal of Animal Behavior and Biometeorology 2(3):73-84. Available: http://periodicos.ufersa.edu.br/revistas/index.php/jabb/article/view/3763/5478.
DOI:http://dx.doi.org/10.14269/2318-1265/jabb.v2n3p73-84
Rostagno HS, Albino LFT, Donzele JL, Gomes PC, Oliveira RF, Lopes DC, Ferreira AS, Barreto SLT, Euclides RF (2011) Tabelas brasileiras para aves e suínos: composição de alimentos e exigências nutricionais. Viçosa, Universidade Federal de Viçosa, 3ed. 252p.
Schiassi L, Yanagi Junior T, Reis GM, Abreu LHP, Campos AT, Castro JO (2015) Modelagem Fuzzy aplicada na avaliação do desempenho de frangos de corte. Revista Brasileira de Engenharia Agrícola e Ambiental 19(2):140-146. Available: http://www.scielo.br/pdf/rbeaa/v19n2/1415-4366-rbeaa-19-02-0140.pdf. DOI: http://dx.doi.org/10.1590/1807-1929/agriambi.v19n2p140-146 Schiassi L, Yanagi Junior T, Damasceno FA, Saraz JAO, Amaral AG (2014) Thermal-Acoustic Comfort Index for Workers of Poultry Houses Using Fuzzy Modeling. International Journal of Engineering Research and Applications (IJERA) 4(9):60-64. Available:
http://www.ijera.com/pages/v4no9.html. Accessed: Sep 22, 2015.
Silva IJO, Vieira FMC (2010) Ambiência animal e as perdas produtivas no manejo pré-abate: o caso da avicultura de corte brasileira. Archivos de Zootecnia 59(1):113-31. Available:
http://www.uco.es/organiza/servicios/publica/az/php/img/web/08_11_34_1869REVISIONAmbienc iaSilva.pdf. Accessed: Sep 22, 2015.
Souza Junior JBF, Domingos HGT, Torquato JL, Sá Filho GF, Costa LLM (2013) Avaliação termográfica de codornas japonesas (Coturnix coturnix japonica). Journal of Animal Behavior and
Biometeorology 1(2):61-64. Available:
http://periodicos.ufersa.edu.br/revistas/index.php/jabb/article/view/3563/5243. DOI:http://dx.doi.org/10.14269/2318-1265.v01n02a05
Welker JS, Rosa AP, Moura DJ, Machado LP, Catelan F, Uttpatel R (2008) Temperatura corporal de frangos de corte em diferentes sistemas de climatização. Revista Brasileira de Zootecnia
37(8):1463-1467. Available: http://www.scielo.br/pdf/rbz/v37n8/v37n8a18.pdf. Accessed: Sep 22, 2015.
Yahav S, Shinder D, Tanny J, Cohen S (2005) Sensible heat loss: the broiler's paradox. World's Poultry Science Journal 61(3):419-434. Available: