ABSTRACT
This study was conducted to determine the effect of the air temperature variation on the mean surface temperature (MST) of 7- to 35-day-old broiler chickens using infrared thermometry to estimate MST, and to study surface temperature variation of the wings, head, legs, back and comb as affected by air temperature and broiler age.
One hundred Cobb® broilers were used in the experiment. Starting
on day 7, 10 birds were weekly selected at random, housed in an environmental chamber and reared under three distinct temperatures (18, 25 and 32 ºC) to record their thermal profile using an infrared thermal camera. The recorded images were processed to estimate MST by selecting the whole area of the bird within the picture and comparing it with the values obtained using selected equations in literature, and to record the surface temperatures of the body parts. The MST estimated by infrared images were not statistically different (p > 0.05) from the values obtained by the equations. MST values significantly increased (p < 0.05) when the air temperature increased, but were not affected by bird age. However, age influenced the difference between MST and air temperature, which was highest on day 14. The technique of infrared thermal image analysis was useful to estimate the mean surface temperature of broiler chickens.
INTRODUCTION
Broiler production in tropical countries like Brazil faces the challenge of controlling heat stress, especially during the warmer periods of the year. Live performance is impaired when birds are reared at temperatures above their comfort zone due to reduced feed intake because dietary energy is used to maintain constant body temperature,
instead of converting feed into meat (Fukayama et al., 2005; Laganá
et al., 2007). Zhou & Yamamoto (1997) found that broiler body
temperature increased three degrees Celsius (41 - 44 ºC), and skin temperature increased 6 °C (37-43 ºC) when exposed to heat stress (36 °C) for three hours.
Increasing sensible heat loss may promote heat tolerance in broilers, and this seems to be more beneficial than heat loss by evaporation, which may lead to dehydration. The difference between surface temperature and ambient temperature is the main parameter to determine sensible
heat loss (Yahav et al., 2008). Different body parts present different
heat during the rearing period, and this is related to environmental air
temperature and birds’ feathering index (Nääs et al., 2010).
Infrared cameras measure the amount of invisible heat energy emitted by surfaces and convert them into surface temperature, producing thermal images. These measuring instruments have been used to estimate the surface temperature of broiler chickens in studies
nAuthor(s)
Nascimento GR1
Nääs IA1
Pereira DF2
Baracho MS1
Garcia R3
1 School of Agriculture Engineering - FEAGRI/ UNICAMP. Campinas, SP, Brazil.
2 UNESP. Tupã, SP, Brazil. 3 FCA/UFGD.
nMail Adress
GR Nascimento FEAGRI/UNICAMP. Campinas, SP, Brazil.
E-mail: [email protected]
nKeywords
Image analysis, poultry, thermal comfort.
The MST results obtained with the thermal images were compared with the equations proposed by
Richards (1971) (Eq. 1) and by Dahlke et al. (2005) (Eq.
2) to estimate broiler MST, as follows:
MST1 = (0.12 TW) + (0.03 TH) + (0.15 TP) + (0.70 TB) (1)
MST2 = (0.03 TC) + (0.70 TB) + (0.12 TA) + (0.06 TH) +
(0.09 TL) (2)
Where: MST = mean surface temperature (°C) TW = wing surface temperature (°C), TH = head surface temperature (°C), TL = leg surface temperature (°C), TB = back surface temperature (°C), TC = comb surface temperature (°C).
The surface temperatures of each body part of the birds were estimated using their infrared thermal
images, as suggested by Nääs et al. (2010).
Using the record of the birds’ mean surface temperature, the difference between MST and air temperature (temperature rise, °C) was calculated, and this difference was analyzed for each tested age. MST data obtained by the use of infrared thermography were compared by Student’s t-test at 95% confidence level, and to the results obtained with the equations
proposed by Richards (1971) and Dahlke et al. (2005).
Mean surface temperature variations of the broilers’ body parts, as a function of age and air temperature, were submitted to analysis of variance at 95% confidence level. When differences were significant, means were compared by the test of Tukey (at 95% confidence level), using the statistical software
MINITAB® 15.
RESULTS AND DISCUSSION
Mean surface temperatures obtained by infrared thermal imaging were not different by the Student’s t-test (p > 0.05), as compared to the estimates obtained with the equations proposed by Richards (1971) and
Dalhke et al. (2005). High positive correlations of
0.985 and 0.986, respectively, were obtained for both
comparisons (Table 1). According to Cangas et al.
(2008), it is important to have efficient environmental control, more efficient energy use, and better design of broiler houses in order to obtain more accurate information on bird surface temperature for better understanding heat transfer circumstances.
There was no difference (p > 0.05) between the MST results obtained using the estimation equations
(Richards, 1971; Dahlke et al. 2005), and those
on sensible heat loss (Czarick et al. 2007; Cangas et al.
2008; Yahav et al., 2008).
This study aimed at evaluating the effect of different air temperatures on mean surface temperature (MST) and on the surface temperature of different body parts of 7- to 35-day-old broilers using infrared thermography and equations available in current literature (Richards,
1971; Dahlke et al., 2005).
MATERIALS AND METHODS
Birds and husbandry
A group of 100 Cobb® broilers were reared in a
small-scale broiler house between 1 and 35 days of
age. Feed and water were offered ad libitum. Ten birds
were weekly selected at random in the broiler house and sent to the State University of Campinas, College of Agricultural Engineering, where they were housed in environmental chambers and exposed to three levels of heat stress.
Experimental procedure
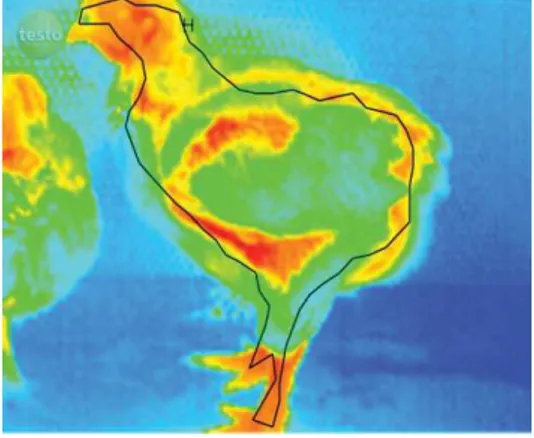
Three groups of ten birds were exposed to three air temperatures (18, 25 and 32 °C) each for at least 15 minutes before thermal images started to be recorded. Thermal images were obtained using the camera
TESTO® 880 (Figure 1). Birds were tested at 7, 14,
21, 28 and 35 days of age. A completely randomized experimental design in a 5 x 3 factorial arrangement (five ages and three air temperatures) was applied, with 10 replicates per treatment, totaling 150 experimental units. Infrared thermography was used to measure broiler MST by selecting the entire area of the bird in
the photo using the software Testo IRSoft® to obtain
the mean temperature of the selected area (Figure 1). The adopted emissivity of the broiler surface was 0.95,
as proposed by Cangas et al. (2008).
obtained thermal imaging (TI) relative to bird age (Figure 2).
Table 1 - Results of Student’s t-test and correlation between MST values obtained by thermal imaging and their estimation using Eq. 1 and Eq. 2 in broilers.
N Average p -
value
Pearson’s correlation
Thermal imaging (TI) 150 32.2 ± 4.0
0.744 0.985
Dalhke (2005) 150 32.0 ± 5.0
Thermal imaging (TI) 150 32.2 ± 4.0
0.975 0.986
Richards (1971) 150 32.2 ± 4.8
N= number of broilers assessed during trial.
Figure 2 - Variation of the estimated surface temperature using infrared thermal imaging (TI) and the equations of Dalhke et al.
(2005) and Richards (1971) as a function of bird age.
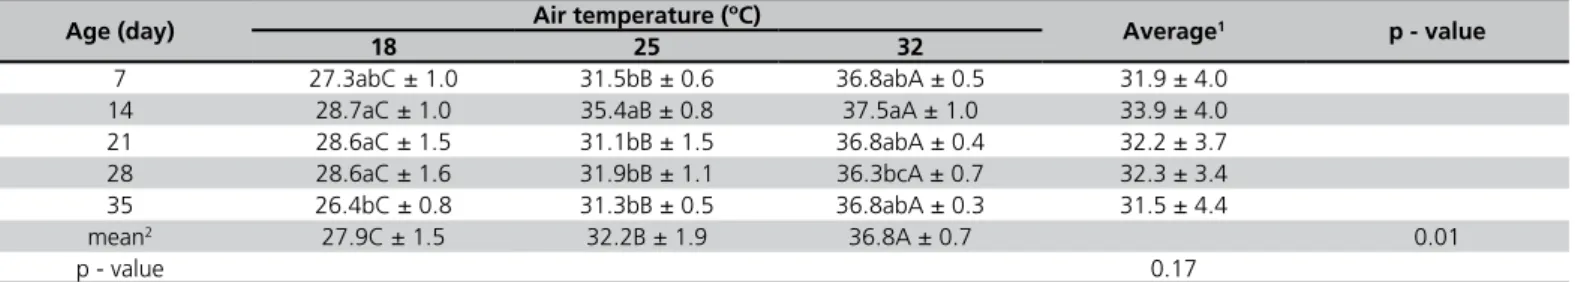
Age did not influence mean surface temperature (p = 0.17). The lowest MST was found in 35-day-old birds (Table 2), which is consistent with the results of Tessier
et al. (2003), who reported that older birds (35 days of
age) presented the lowest mean surface temperatures, probably due to their thick feather coverage. Those authors mention that birds’ core temperature is
normally constant (41 °C), but it decreases over the peripheral zone. However, in the present study, MST differences as a function of age were not significant, and the highest MST was observed in 14-day-old birds. The MST of the birds exposed to different environmental temperatures were different (p = 0.01), with increasing MST as air temperature
increased. According to Cangas et al. (2008), surface
vascularization is directly related to the increase in MST, which is directly affected by air temperature (Table 2). Thermal comfort is very important during broiler rearing as the maintenance of body temperature is essential to promote good performance. In addition, optimal ideal environment temperatures change during the grow-out period, and therefore, the knowledge on broilers’ surface temperatures may contribute to assess their thermal comfort.
The regression analysis of MST data as a function of age resulted in a quadratic equation (Eq. 3), with the highest temperature obtained when birds were
14 days of age (í•1), probably due to their thinner
body feathering. When MST data were analyzed as a function of air temperature, a linear equation
was obtained (í•2, Eq. 4), showing that bird surface
temperature increased with air temperature (Tair).
•
í1 = 31.18 + 1.39age – 0.27 age²; (R² = 0.80) (3)
í•2 = 16.4 + 0.635 Tair; (R² = 0.84) (4)
Equation 5 (•í3) was obtained using multivariate
analysis and it shows the influence of air temperature on mean surface temperature (MST). The trend of decreasing birds MST as a function of age is due to an increase in the feathering index of the different
body parts, acting as an insulating layer (Garcia et al.,
2002).
•
í3 = 17.1 + 0.635 Tair – 0.0326 age, (R² = 0.87) (5)
✁✂ ✄☎✆✝✞
✟✠ ✡☛ ✡☞ ☞✌
✍
✎✏✑✒✆✓☎✔✄ ☞✕
✍
☞
✞
✖✆✒✗✘✂✄✡✙✙✠✞ ✚✛ ✎✏✑✒✆✓☎✔✄
☞✕
✍
☞
✞
✖✆✒✗✘✂✄ ✡✙✙✠
✞
✚✛ ✎✏✑✒✆✓☎✔✄
☞✕
✍
☞
✞
✖✆✒✗✘✂✄ ✡✙✙✠
✞
✚✛ ✎✏✑✒✆✓☎✔✄☞✕✍☞✞
✖✆✒✗✘✂✄ ✡✙✙✠
✞
✚✛ ✎✏✑✒✆✓☎✔✄☞✕✍☞✞ ✖✆✒✗✘✂✄✡✙✙✠✞ ✚✛
✜✢ ✣✢
✤ ✢ ✥✢
✢
✦ ✧ ★ ✩ ✪✫ ✬✭★✮ ✧ ✯✧ ✰ ✱ ✧✬★ ✯✫✬✧ ✲✳✴ ✵
Table 2 - Change in mean surface temperature (MST) as measured by infrared thermography according to broiler age and air temperature.
Age (day) Air temperature (ºC) Average1 p - value
18 25 32
7 27.3abC ± 1.0 31.5bB ± 0.6 36.8abA ± 0.5 31.9 ± 4.0
14 28.7aC ± 1.0 35.4aB ± 0.8 37.5aA ± 1.0 33.9 ± 4.0
21 28.6aC ± 1.5 31.1bB ± 1.5 36.8abA ± 0.4 32.2 ± 3.7
28 28.6aC ± 1.6 31.9bB ± 1.1 36.3bcA ± 0.7 32.3 ± 3.4
35 26.4bC ± 0.8 31.3bB ± 0.5 36.8abA ± 0.3 31.5 ± 4.4
mean2 27.9C ± 1.5 32.2B ± 1.9 36.8A ± 0.7 0.01
p - value 0.17
Air velocity is the parameter that most strongly influences sensible heat loss and contributes to the acclimation capacity of broilers, consequently enhancing bird capacity to regulate its body
temperature when exposed to heat stress (Yahav et
al., 2005). In the present study, air velocity was kept at
zero to test the variation in bird surface temperature without the influence of this specific variable. Air relative humidity recorded was 76 ± 3% at 18 ºC, 68 ± 2% at 25 ºC, and 65 ± 3% at 32 °C air temperature, inside the environmentally-controlled chamber.
According to ANOVA results (Figure 3), temperature rise (difference between MST and air temperature) was influenced by bird age (p = 0.03). The greatest difference occurred when birds were 14 days old (8.8 ± 2.5 ºC), but it was not different from the temperature rise at 28 days (7.3 ± 2.9 ºC). On days 7, 21 and 35, temperature rises of 6.9 ± 2.0 °C, 7.2 ± 2.8 °C and 6.5 ± 1.6 °C, respectively, were observed, and these values were not different from the temperature rise that occurred on day 28. The difference in surface temperature rise as
a function of broiler age was reported by Cangas et
al. (2008), who found the largest difference on day
28 and suggested that it was probably due to feather molting occurring at that age.
Figure 3 - Boxplot of the effect of age on the difference between broiler mean surface temperature and air temperature (ºC).
Although the results indicate that the difference between MST and air temperature were similar on days 14 and 28, the highest average difference was verified on 14 day as compared to the other evaluated ages. This was probably due to the development of thermoregulation by the birds, increasing their heat loss capacity through peripheral blood circulation.
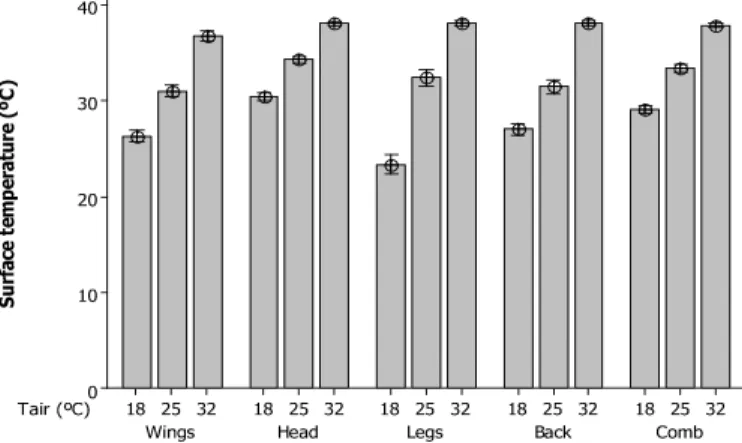
Wings, head, legs, back and comb surface temperature significantly rose (p <0.05) with the increasing air temperature. The largest difference
between air and surface temperatures was found in the legs (14.8 °C) when air temperature was between 18 and 32 °C (Figure 4). This result is consistent with
the findings of Nääs et al. (2010), who found that
featherless body parts increase surface temperature gradient, when air temperature changes.
Figure 4 - Variation body parts surface temperature of broilers as a function of air temperature (Tair).
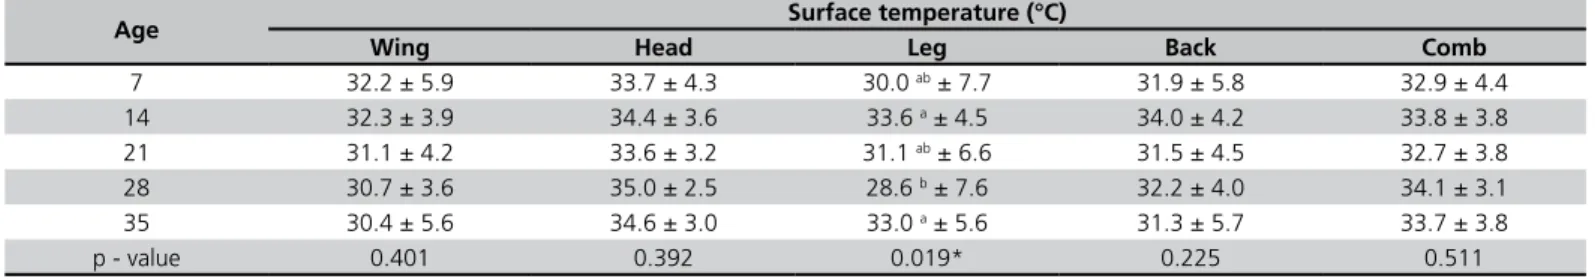
The lowest MST in broilers was detected at an air temperature of 18 ºC, which was probably due to peripheral vasoconstriction because blood flow to the body surface is reduced to prevent heat loss. This vasoconstriction was more pronounced in the featherless areas, such as the legs and the comb. Only leg MST was significantly influenced (p-value < 0.05) by bird age, possibly to the above mentioned mechanism of vasoconstriction that decreases blood flow in featherless areas (Table 3). This effect of age on the mean surface temperature was also observed
by Cangas et al. (2008) in the wings and back of 3- to
37-day-old broilers.
The results obtained in the present study show that body surface temperature can be evaluated through the direct measurement using infrared thermographic cameras or by both equations previously mentioned (Eq 1 and Eq 2).
CONCLUSIONS
Infrared thermographic cameras are useful tools to measure broiler surface temperature and can be used to evaluate their mean surface temperature. Under the specific conditions of the present experiment, broiler surface temperature varied as a function of the air temperature of the rearing environment, but was not affected by broiler age
✶ ✷ ✸✹
✸✺ ✺✻
✼
✺✻
✺✸
✺✽
✹
✾
✻
✸
✿ ❀❁ ❂❃❄❅ ❆
❇
❈❉
❊❋
●
❍
■ ❏❑▲ ▼◆❖ P
❖ ◗❘ ❙ ❚❏❯❱
❲❳❨ ❩ ❬❳❏❭
❪ ❑❫❨❩ ❵❛ ❴❵
❜❝ ❴❵ ❵❛ ❜❝ ❴❵ ❵❛ ❜❝ ❴❵ ❵❛ ❜❝ ❴❵ ❵❛ ❜❝ ❞❡
❴
❡
❵
❡
❜❡
❡
❢❣
❤
✐❥
❦
❧
♠
❧
♥
♦
❧
❤❥
♠♣
❤
q
r
s
t
REFERENCES
Cangar O, Aerts JM, Buyse J, Berckmans D. Quantification of the spatial distribution of surface temperatures of broilers. Poultry Science 2008; 87:2493-2499.
Czarick M. Thermal imaging in the poultry industry. Athens: The University of Georgia; 2007.
Dahlke F, Gonzales E, Gadelha AC, Maiorka A, Borges AS, Rosa PS, Filho DEF; Furlan RL. Empenamento, níveis hormonais de triiodotironina e tiroxina e temperatura corporal de frangos de corte de diferentes genótipos criados em diferentes condições de temperatura. Ciência rural 2005; 35(3):664-670.
Fukayama EH, Sakomura NK, Neme R, Freitas ER. Efeito da temperatura ambiente e do empenamento sobre o desempenho de frangas leves e semipesadas. Ciência e Agrotecnologia 2005; 29(6):1272-1280.
Garcia RG, Mendes AA, Garcia EA, Nääs IA, Moreira J, Almeida ICL, Takita TS. Efeito da Densidade de Criação e do Sexo Sobre o Empenamento, Incidência de Lesões na Carcaça e Qualidade da Carne de Peito de Frangos de Corte. Revista Brasileira de Ciência Avícola 2002; 4(1):1-9.
Laganá C, Ribeiro ALM, Kessler AM, Kratz LR, Pinheiro CC. Effects of the reduction of dietary heat increment on the performance, carcass yield, and diet digestibility of broilers submitted to heat stress. Revista Brasileira de Ciência Avícola 2007; 9(1):45-51.
Nääs IA, Romanini CEB, Neves DP, Nascimento GR, Vercellino RA. Broilers surface temperature distribution of 42 day old chickens. Scientia Agricola 2010; 67(5):497-502.
Richards SA. The significance of changes in the temperature of the skin and body core of the chicken in the regulation of heat loss. Journal of Physiology 1971; 216:1-10.
Tessier M, Tremblay DD, Klopfenstein C, Beauchamp G, Boulianne M. Abdominal skin temperature variation in healthy broiler chickens as determined by thermography. Poultry Science 2003; 82:846-849.
Welker JS, Rosa AP, Moura DJ, Machado LP, Catelan F, Uttpatel R. Temperatura corporal de frangos de corte em diferentes sistemas de climatização. Revista Brasileira de Zootecnia 2008; 37(8):1463-1467.
Yahav S, Rusal M, Shinder D. The effect of ventilation on performance body and surface temperature of young turkeys. World’s Poultry Science Journal 2005; 61:419-434.
Yahav S, Shinder D, Tanny J, Cohen S. Sensible heat loss: the broiler’s paradox. World’s Poultry Science Journal 2005; 61:419-434.
Zhou WT, Yamamoto S. Effects of environmental temperature and heat production due to food intake on abdominal temperature, shank skin temperature and respiration rate of broilers. British Poultry Science 1997; 38:107-114.
Table 3 - Variation of body parts surface temperature as a function of bird age.
Age Surface temperature (°C)
Wing Head Leg Back Comb
7 32.2 ± 5.9 33.7 ± 4.3 30.0 ab ± 7.7 31.9 ± 5.8 32.9 ± 4.4
14 32.3 ± 3.9 34.4 ± 3.6 33.6 a ± 4.5 34.0 ± 4.2 33.8 ± 3.8
21 31.1 ± 4.2 33.6 ± 3.2 31.1 ab ± 6.6 31.5 ± 4.5 32.7 ± 3.8
28 30.7 ± 3.6 35.0 ± 2.5 28.6 b ± 7.6 32.2 ± 4.0 34.1 ± 3.1
35 30.4 ± 5.6 34.6 ± 3.0 33.0 a ± 5.6 31.3 ± 5.7 33.7 ± 3.8
p - value 0.401 0.392 0.019* 0.225 0.511