Multivariate techniques in the analysis of carcass traits
of Morada Nova breed sheep
Aplicação de técnicas multivariadas em características de carcaça de ovinos da raça Morada Nova
Déborah Galvão Peixôto Guedes1* Maria Norma Ribeiro1
Francisco Fernando Ramos de Carvalho1
ISSNe 1678-4596
INTRODUCTION
The value of sheep for meat production is estimated by carcass yield, which expresses, in percentage, the relation between carcass weight and animal weight. Qualitative and quantitative traits of the carcass, such as conformation and fat distribution, are very important in meat production, as they are
directly related to the final product. The yield of
high-value meat cuts can also be considered an
important indicator of the overall value of the carcass (SAÑUDO et al., 2012). Several factors can affected such productive traits, including genotype, slaughter weight, sex, age, and feed management.
In this context, the standardization of sheep carcass to be placed in the market is essential for attracting consumers. The criteria that
define carcass quality include conformation, which
shows the development of muscle mass, and the
degree of finish, which refers to the distribution 1Departamento de Zootecnia, Universidade Federal Rural de Pernambuco (UFRPE), 52171-900, Recife, PE, Brasil. E-mail: [email protected]. *Corresponding author.
ABSTRACT: This study aimed to use multivariate techniques of principal component analysis and canonical discriminant analysis in a data set from Morada Nova sheep carcass to reduce the dimensions of the original data set, identify variables with the best discriminatory power among the treatments, and quantify the association between biometric and performance traits. The principal components obtained were
efficient in reducing the total variation accumulated in 19 original variables correlated to five linear combinations, which explained 80% of the total variation present in the original variables. The first two principal components together accounted for 56.12% of the total variation of the evaluated variables. Eight variables were selected using the stepwise method. The first three canonical variables were significant, explaining 92.25% of the total variation. The first canonical variable showed a canonical correlation coefficient of 0.94, indicating a strong association
between biometric traits and animal performance. Slaughter weight and hind width were selected because these variables presented the highest
discriminatory power among all treatments, based on standard canonical coefficients.
Key words: canonical discriminant analysis, principal components, sheep production.
RESUMO: Este estudo teve o objetivo de aplicar as técnicas multivariadas de componentes principais e discriminante canônica em um
conjunto de dados de carcaça de ovinos da raça Morada Nova, a fim de reduzir a dimensionalidade do conjunto de variáveis originais, identificar quais as variáveis com o melhor poder discriminatório entre os tratamentos, além de quantificar a associação entre características
biométricas e de desempenho. Os componentes principais gerados foram eficientes em reduzir a variação total acumulada em 19 variáveis
originais, correlacionadas para cinco combinações lineares, os quais explicaram 80% da variação total contida nas variáveis originais. Os dois primeiros componentes principais juntos explicam 56,12% da variação total das variáveis avaliadas. Oito variáveis foram selecionadas pelo método stepwise. As três primeiras variáveis canônicas foram significativas, explicando 92,25% da variação total. A primeira variável canônica apresentou o coeficiente de correlação canônica de 0,94, o que indica uma alta associação entre as características de medidas biométricas e de desempenho animal. O peso corporal ao abate e a largura de garupa foram as variáveis selecionadas por apresentar o mais alto poder discriminatório dos tratamentos, com base nos coeficientes canônicos padronizados.
Palavras-chave: análise discriminante canônica, componentes principais, ovinocultura.
and amount of fat cover (OSÓRIO et al., 2002). Carcasses should present good distribution of fat cover, to prevent cold shortening and consequent loss of softness, and intramuscular fat at moderate
levels to provide flavor and softness (BUENO et
al., 2000; MCMANUS et al., 2013).
Carcass measurements are important because they allow comparisons among breeds, slaughter body weights and ages, feeding systems, and correlations with other measurements or tissues that constitute the carcass, enabling to estimate their traits (SILVA & PIRES, 2000). PINHEIRO & JORGE (2010) observed that, except for leg length and thorax depth, the measurements of internal and external carcass length, hind width, rump perimeter, thorax perimeter, anterior width, thorax width, and carcass
and leg compactness index showed a significant
correlation with slaughter body weight and cold carcass of sheep, noting that the correlation with hind perimeter was the highest, being 0.83 for slaughter body weight and 0.90 for cold carcass weight.
Considering that animal performance is associated with food quality and that feed is the most expensive item in the production context, several studies have investigated alternative low-cost foods that are easily available, that meet the nutritional needs and requirements of animals, and that increase the daily weight gain, thus reducing slaughter age and ensuring quality carcass (MEDEIROS et al. 2009, BEZERRA et al. 2012, LIMA JÚNIOR et al. 2014, URBANO et al. 2015).
Studies on sheep carcass use numerous traits, and multivariate analysis techniques are
extremely efficient options when a combination
of multiple pieces of information from an experimental portion is required (that is, from an observational vector), with the purpose of associating or predicting biological phenomena based on a group of variables that are important for the development of an experimental plan (DILLON & GOLDSTEIN, 1984).
This study aimed to apply the multivariate techniques of principal components analysis and canonical discriminant analysis in a data set from Morada Nova sheep carcass to reduce the dimensions of the original group of variables, identify which variables have the best discriminatory power among the treatments, and quantify the association between biometric and performance traits.
MATERIALS AND METHODS
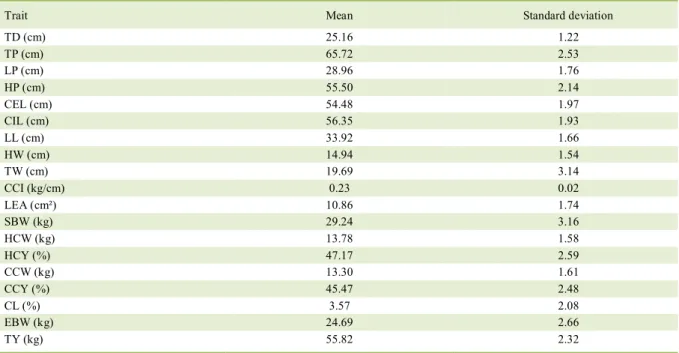
The database contained information from 48 non-related male sheep, aged 8 months, from studies conducted by MEDEIROS et al. (2009) and LIMA JÚNIOR et al. (2014). From the total database, 19 traits related to the animal carcass were selected [thorax depth (TD), thorax perimeter (TP), leg perimeter (LP), hind perimeter (HP), carcass external length (CEL), carcass inner length (CIL), leg length (LL), hind width(HW), thorax width (TW), carcass compactness index (CCI), loin eye area (LEA), slaughter body weight (SBW), hot carcass weight (HCW), hot carcass yield (HCY), cold carcass weight (CCW), cold carcass yield (CCY), cooling loss (CL), empty body weight (EBW), and true yield (TY)], and descriptive statistics are shown in table 1.
Treatments were defined according to the
following experimental diets — Treatment 1 (T1): Bulk fraction of forage palm (Nopalea cochenillifera L. Salm-Dyck) combined with Tifton 85 hay (Cynodon spp.) and concentrated fraction of corn grain, soybean meal, urea, and mineral mixture; Treatment 2 (T2): Bulk fraction of forage palm (N. cochenillifera L. Salm-Dyck) combined with maniçoba hay (Manihot
pseudoglaziovii) and concentrated fraction of corn
grain, soybean meal, urea, and mineral mixture; Treatment 3 (T3): Ground Tifton 85 hay and 20% concentrate (constituted of ground corn, soybean meal, and vegetable oil); Treatment 4 (T4): Ground Tifton 85 hay and 40% concentrate; Treatment 5 (T5): Ground Tifton 85 hay and 60% concentrate; and Treatment 6 (T6): Ground Tifton 85 hay and 80% concentrate. T1 and T2 were formulated to allow a weight gain of 150 g/day, whereas T3, T4, T5, and T6 provided a weight gain of 250g/day.
To start the analysis, the correlation matrix
P19x19 of the original variables Xi (TD, TP, LP, HP, CEL,
CIL, LL, HW, TW, CCI, LEA, SBW, HCW, HCY, CCW, CCY, CL, EBW, and TY) was used, with i = 1, 2,
…, 19 (Table 2). The technique of principal components analysis consisted of transforming a group of original p variables (X1, X2, …, X19) into a group of components (Y1, Y2, …, Yk). Each principal component Yj (PCk) consists of a linear combination of standardized variables (Zi), uncorrelated to each other and arranged in a descending order of variance, with the i - ith principal component of matrix P19x19, j = 1, 2, …, 19, defined by Yj = aj’Z =
aj1Z1 + aj2Z2 + … + aj19Z19, where aij are eigenvectors,
= 1, 2, …, 19, and the covariance between Yj and Yk is equal to zero for any j ≠ k.
The relative importance of a component was evaluated by the percentage of the total variance explained by such component, i.e., the percentage of its eigenvalue in relation to the total eigenvalues of all components. Selection of components that explained most of the variation of the data set was determined by
those with eigenvalues of ≥1 (one), according to the
criterion proposed by KAISER (1960).
Canonical discriminant analysis is a
multivariate technique that identifies linear combinations
of the variables that best promote separation in the groups. This type of multivariate technique describes the relationship between two groups of variables and then calculates the linear combinations of maximum correlation. The stepwise method was used to select the variables that will constitute the discriminant model. In this procedure, variables are inserted in the model one by one, according to the partial value of F. The analysis is conducted in stages and the model is examined with the variables in each of the
stages. According to JOHNSON (1998), in the stepwise
method, the recommended level of significance is
25%-50% for input variables and 15% for output variables. Data were standardized using the STANDARD procedure of statistical software SAS (Statistical Analysis System, version 9.4). Then, statistical analyses were performed using the same software procedures — PRINCOMP, STEPDISC, DISCRIM, and CANDISC. This last procedure was used
to obtain the total standard canonical coefficients and the
total variation explained by each canonical variable.
RESULTS AND DISCUSSION
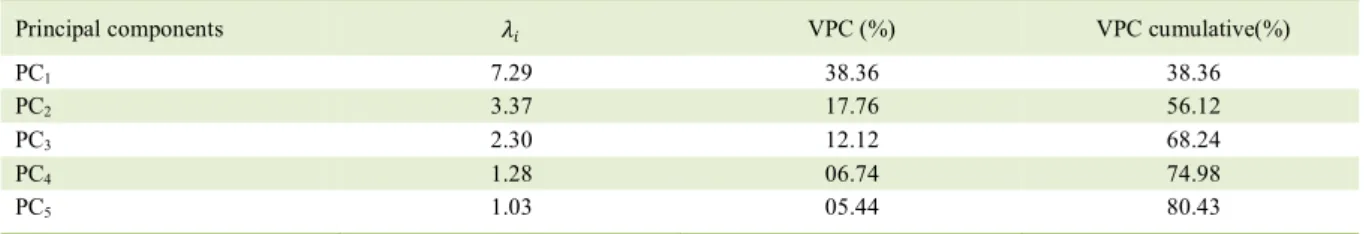
Of the 19 principal components generated, the
first five were selected because they presented eigenvalues of >1 (one) (Table 3), i.e., the first five components were
able to explain 80.43% of the total variation of data, representing 20% less explanation of the total variation. Results observed in this study are similar to those of others that also evaluated sheep carcass and meat quality
Table 1 – Mean and standard deviation of carcass traits of Morada Nova breed sheep.
Trait Mean Standard deviation
TD (cm) 25.16 1.22
TP (cm) 65.72 2.53
LP (cm) 28.96 1.76
HP (cm) 55.50 2.14
CEL (cm) 54.48 1.97
CIL (cm) 56.35 1.93
LL (cm) 33.92 1.66
HW (cm) 14.94 1.54
TW (cm) 19.69 3.14
CCI (kg/cm) 0.23 0.02
LEA (cm²) 10.86 1.74
SBW (kg) 29.24 3.16
HCW (kg) 13.78 1.58
HCY (%) 47.17 2.59
CCW (kg) 13.30 1.61
CCY (%) 45.47 2.48
CL (%) 3.57 2.08
EBW (kg) 24.69 2.66
TY (kg) 55.82 2.32
traits, such as CAÑEQUE et al. (2004) who obtained 77%
of the total variation explained by the first five principal
components. Regarding meat quality traits, those authors also observed that eight principal components were obtained to explain 74% of the total variation.
Traits presenting the highest weighting
coefficients, in absolute value, in the first component
were CCW (0.37), followed by HCW (0.36), EBW and CCI (0.34), and SBW (0.33), characterizing PC1 as an index that determines carcass conformation. In the second component, the variables LL, HW, and HP
(0.39) presented the highest weighting coefficients,
indicating that PC2 can be considered an index of biometric measurements. Therefore, the principal components can be arranged as linear models:
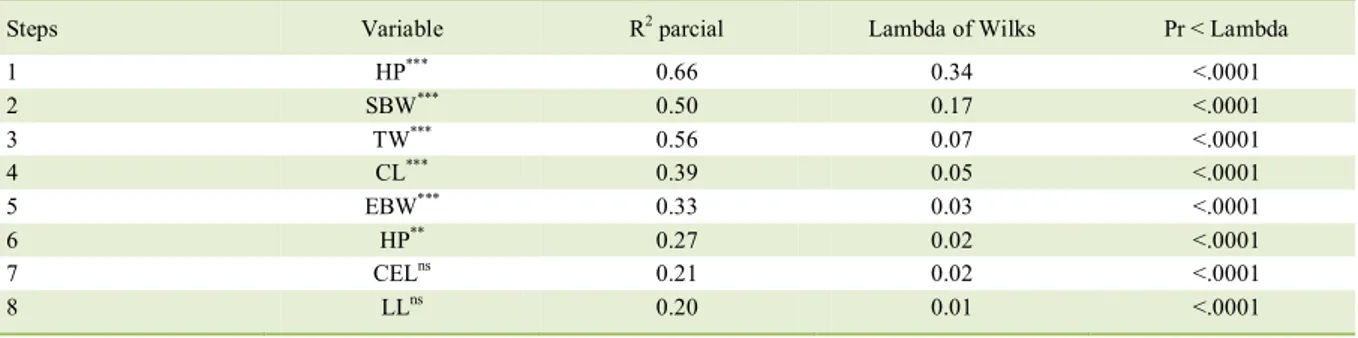
The variables selected using the stepwise method constituted the discriminant model (Table 4). For each variable inserted in the Fisher equation, the Mahalanobis distance
Table 3 – Principal components, eigenvalues (𝜆𝜆𝑖𝑖), percentage of variance explained by components (VPC) and percentage of variance
explained by accumulated components (VPC Cumulative) of carcass traits of Morada Nova breed sheep.
Principal components 𝜆𝜆𝑖𝑖 VPC (%) VPC cumulative(%)
PC1 7.29 38.36 38.36
PC2 3.37 17.76 56.12
PC3 2.30 12.12 68.24
PC4 1.28 06.74 74.98
PC5 1.03 05.44 80.43
Table 2 – Simple linear correlation (below the diagonal line) and level of probability of significance (above the diagonal line) between carcass traits of Morada Nova breed sheep.
TD TP LP HP CEL CIL LL HW TW CCI LEA SBW HCW HCY CCW CCY CL EBW TY
TD 1.000 ns ** *** ns ns *** *** ns ns ns ns ns ns ns ns ns ns ns
TP 0.069 1.000 ** ** *** *** ns ns ** *** *** *** *** ns *** ns ns *** ns
LP 0.209 0.334 1.000 ns * ns ns ns ns ** ns *** *** ns *** ns ns *** ns
HP 0.428 0.308 0.068 1.000 ns *** ** *** ** ns ns ns ns ** ns ns ns ns ns
CEL -0.080 0.579 0.258 0.226 1.000 *** ns ** ns *** *** *** *** ns *** ns ns ns *
CIL 0.167 0.587 0.120 0.526 0.380 1.000 * ns ns ns ** *** *** ns *** ns ** *** ns
LL 0.420 -0.008 -0.047 0.350 -0.191 0.265 1.000 *** ns *** ns *** ** ns *** ns *** *** ns
HW 0.557 -0.166 -0.217 0.453 -0.291 0.024 0.655 1.000 ns ** ns *** *** * *** ns *** *** ns
TW 0.266 0.317 -0.033 0.342 0.128 0.190 0.163 0.005 1.000 ns ns ns ns ns ns ns ns ns ns
CCI -0.080 0.704 0.428 0.102 0.519 0.127 -0.405 -0.319 0.191 1.000 *** *** *** ** *** *** *** *** **
LEA 0.026 0.408 0.146 0.169 0.469 0.278 -0.119 -0.219 0.144 0.584 1.000 *** *** ns *** ns ns *** ns
SBW -0.226 0.776 0.402 0.041 0.635 0.370 -0.409 -0.515 0.148 0.798 0.541 1.000 *** ns *** ns *** *** ns
HCW -0.127 0.826 0.428 0.173 0.632 0.441 -0.300 -0.359 0.130 0.911 0.600 0.870 1.000 *** *** *** * *** ***
HCY 0.187 0.178 0.095 0.270 0.068 0.163 0.162 0.266 -0.012 0.318 0.163 -0.156 0.349 1.000 ** *** ns ns ***
CCW -0.162 0.797 0.426 0.112 0.630 0.362 -0.397 -0.419 0.147 0.943 0.587 0.887 0.984 0.288 1.000 *** *** *** **
CCY 0.095 0.222 0.147 0.164 0.150 0.049 -0.087 0.091 0.037 0.506 0.217 -0.010 0.446 0.922 0.451 1.000 ns ns ***
CL 0.227 -0.114 -0.140 0.272 -0.209 0.290 0.630 0.447 -0.120 -0.475 -0.144 -0.381 -0.244 0.220 -0.412 -0.175 1.000 ** ns
EBW -0.086 0.817 0.371 0.146 0.581 0.416 -0.354 -0.399 0.226 0.855 0.593 0.917 0.925 0.114 0.922 0.226 -0.289 1.000 ns
TY -0.130 0.172 0.206 0.096 0.247 0.123 0.053 0.027 -0.196 0.318 0.127 0.055 0.369 0.633 0.339 0.621 0.043 -0.009 1.000
ns
is applied to ensure that it maximizes the distance between the nearest groups, so that the subset of selected variables presents the highest percentage of correct classification, besides avoiding the effects of multicollinearity between the independent variables (RAUSCH & KELLEY, 2009). The most important variable to discriminate treatments was HW, with partial r2
of 0.66 and P value of <0.0001. Variables CEL and LL were not significant at the 5% probability level and, therefore, have no influence on treatment discrimination
The first three canonical variables explained 95.25% of the total variation (Table 5). In the first pair of canonical variables, variable SBW, followed by HW, obtained the highest standardized canonical coefficients in module and, consequently, are the variables with the highest degree of discrimination. URBANO et al. (2015) used a univariate analysis in their study and reported that SBW had a decreasing linear effect when replacing corn with manipueira hay, which may be associated with reduced consumption of dry matter and, consequently, of protein and
Table 5 –Standardized canonical coefficients and total variation explained by each canonical variable.
---Canonical variable---
Original variable CV1 CV2 CV3
HP (cm) 0.51 -0.36 -0.01
CEL (cm) -0.52 -0.21 -0.37
LL (cm) -0.20 0.10 -1.03
HW (cm) 1.14 -0.51 0.43
TW (cm) 0.66 1.27 0.56
SBW (kg) -1.47 -2.22 1.53
CL (%) 0.64 -0.38 1.41
EBW (kg) 0.26 2.15 -0.59
Canonical correlation 0.94*** 0.82*** 0.61***
Variation (%) 70.11 19.69 5.45
HP - hind perimeter; CEL - carcass external length; LL - leg length; HW - hind width; TW - thorax width; SBW - slaughter body weight;
CL - cooling loss; EBW - empty body weight. *** P<0,01; ** P<0,05; ns = not significant.
Table 4 – Selected variables by the stepwise method.
Steps Variable R2 parcial Lambda of Wilks Pr < Lambda
1 HP*** 0.66 0.34 <.0001
2 SBW*** 0.50 0.17 <.0001
3 TW*** 0.56 0.07 <.0001
4 CL*** 0.39 0.05 <.0001
5 EBW*** 0.33 0.03 <.0001
6 HP** 0.27 0.02 <.0001
7 CELns 0.21 0.02 <.0001
8 LLns 0.20 0.01 <.0001
HP - hind perimeter; CEL - carcass external length; LL -leg length; HW - hind width; TW - thorax width; SBW - slaughter body weight; CL
total digestible nutrients. In young sheep, growth is accelerated and requires a complete supply of nutritional requirements for deposition in tissues, especially in muscles, which occurs at high speed until maturity is reached. Therefore, replacing food component had a direct impact on SBW, confirming the direct relation between animal performance and nutrient consumption (CARNEIRO et al., 2004).
The magnitude of the canonical coefficients indicates the importance of each variable in obtaining the maximum correlation between the groups of variables X and Y. According to Al-Kandari & Jollife (1997), the canonical coefficients are analogous to beta from multiple regression analysis, since they indicate the contribution of an original variable to the creation of its respective canonical variable, based on total variance.
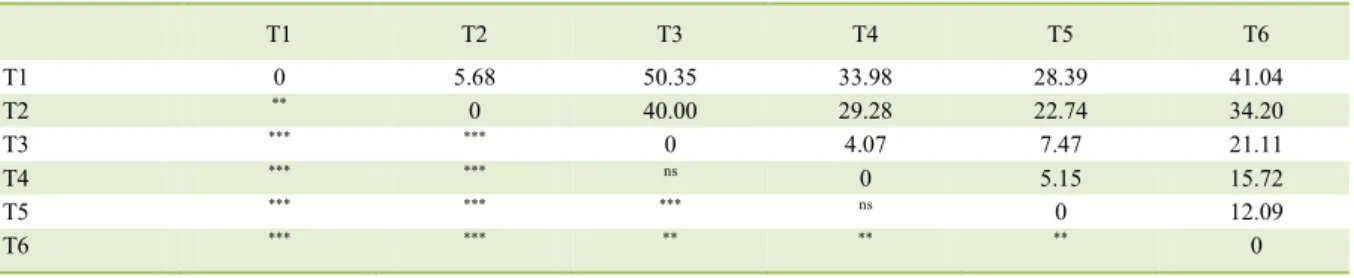
The shortest distance was observed
between T3 and T4, but was not significant (p>0.05) (Table 6). T4 and T5 showed a small distance (p<0.001), confirming that the inclusion of 40% and 60% concentrates in the diets produced similar results in the development of traits of biometric measurements and animal performance. Some similarities were also observed between T1 and T2 (p<0.001), indicating that diets with Tifton 85 hay
and maniçoba hay produce similar results in the
development of traits of biometric measurements
and animal performance. The greatest distance was observed between T1 and T3, with dissimilarity
verified with the F-test (p<0.001).
When considering the use of canonical discriminant analysis, it is critical to measure, in the sample elements, variables that can actually distinguish between populations, otherwise, the quality of adjustment of the discrimination rule will be compromised. A common mistake is to assume that an increase in the number of response variables will also increase the discrimination capacity (MINGOTI, 2005).
CONCLUSION
Principal components analysis was
efficient in reducing the dimensions of the data set, since five uncorrelated components were sufficient
to explain about 80% of the total variation of the 19 original variables. Variables CCW, HP, LL and HW, CCY, TW, and LP were the most important
among the five selected components and should be
further analyzed in future studies on sheep carcass. The variables with the greatest discriminatory power among the treatments, selected according to standardized canonical coefficients, in ascending order of importance were SBW and HW. The latter was selected since it presented the greatest discriminatory power by the stepwise method.
Table 6 – Distance of paired quadratic Mahalanobis (above the diagonal line) and the probability by the F test between treatments (below the diagonal line) for the second set of data.
T1 T2 T3 T4 T5 T6
T1 0 5.68 50.35 33.98 28.39 41.04
T2 ** 0 40.00 29.28 22.74 34.20
T3 *** *** 0 4.07 7.47 21.11
T4 *** *** ns 0 5.15 15.72
T5 *** *** *** ns 0 12.09
T6 *** *** ** ** ** 0
T1 - Forage palm combined with Tifton 85 hay (Cynodon spp.); T2 - Forage palm combined with Maniçoba hay (Manihotpseudoglaziovii);
ACKNOWLEDGMENTS
The authors would like to thank Coordenação de Aperfeiçoamento de Pessoal de Nível Superior (CAPES) for the scholarship granted to the first author.
DECLARATION OF CONFLICTING INTERESTS
The authors declare no conflict of interest. The founding sponsors had no role in the design of the study, in the collection, analyses, or interpretation of data, in the writing of the manuscript and in the decision to publish the results.
REFERENCES
BEZERRA, S.B.L., et al. Morphometric measurements of carcasses of sheep fed diets with different levels of cactus.
Revista Científica de Produção Animal, v.14, n.2, p.231-234, 2012. Available from: <http://www.ojs.ufpi.br/index.php/ rcpa/article/view/2843/1642>. Accessed: Jun. 05, 2017. doi: 10.15528/2843.
BUENO, S.M. et al. Carcass traits of Suffolk lambs slaughtered at different ages. Revista Brasileira de Zootecnia, v.29, n.6, p.1803-1810, 2000. Available from: <http://www.scielo.br/pdf/%0D/rbz/ v29n6/5712.pdf>. Accessed: Feb. 12, 2017. doi: 10.1590/S1516-35982000000600029.
CAÑEQUE, V. et al. Carcass and meat quality of light lambs using principal component analysis. Meat Science, v.67, p.595-605, 2004. Available from: <https://www.sciencedirect.com/science/ article/pii/S0309174004000166>. Accessed: Mar. 03, 2017. doi: 10.1016/j.meatsci.2004.01.002.
CARNEIRO, R. M., et al. Weight gain and alimentary efficiency of single and twin lambs weanedor not at the 63 days of age.
Revista Brasileira de Agrociência, v.10, n.2, p.227-230, 2004. Available from: <http://www2.ufpel.edu.br/faem/agrociencia/ v10n2/artigo14.pdf>. Accessed: Dec. 12, 2016.
DILLON, W.R.; GOLDSTEIN, M. Multivariate analysis: methods and applications, 2d ed., John Wiley, New York, 462p, 1984.
JOHNSON, D.E. Applied multivariate methods for data analysis. New York: Duxbury Press, 1998.
KAISER, H. F. The application of electronic computers to factor analysis. Educational and Psychological Measurement, v.20, p. 141-151, 1960. Available from: <http://journals.sagepub.com/doi /10.1177/001316446002000116>. Accessed: Dec. 12, 2016. doi: 10.1177/001316446002000116.
LIMA JÚNIOR, D.M. et al. Effect of the replacement of Tifton 85 with maniçoba hay on the performance of Morada Nova
sheep. Tropical Animal e Health Production, v. 46, n.6, p.995-1000, 2014. Available from: <https://link.springer.com/ article/10.1007/s11250-014-0600-y>. Accessed: Feb. 12, 2017. doi: 10.1007/s11250-014-0600-y.
MCMANUS, C. et al. Ultrasonography evaluation of sheep carcass quality of Santa Inês breed. Ciência Animal Brasileira, v.14, n.1, p. 8-16, 2013. Available from: <http://www.scielo.br/ pdf/cab/v14n1/02.pdf>. Accessed: Dec. 12, 2016. doi: 10.5216/ cab.v14i1.12336.
MEDEIROS, G.R. et al. Effect of concentrate levels on carcass characteristics of the Morada Nova breed sheep in feedlot. Revista Brasileira de Zootecnia, v.38, n.4, p.718-727, 2009. Available from: <http://www.scielo.br/pdf/rbz/v38n4/19.pdf>. Accessed: Dec. 12, 2016. doi: 10.1590/S1516-35982009000400019.
MINGOTI, S.A. Análise de dados através de métodos de estatística multivariada: uma abordagem aplicada. Belo Horizonte: Editora UFMG, 2005.
OSÓRIO, J.C.S. et al. Qualidade, Morfologia e Avaliação de Carcaças. Universidade Federal de Pelotas, Ed. Universitária, 2002. 194p.
PINHEIRO, R.S.B.; JORGE, A.M. Biometric measurements obtained
in vivo and in the carcass of culled ewes at different physiological stages. Revista Brasileira de Zootecnia, v.39, n.2, p.440-445, 2010. Available from: <http://www.scielo.br/pdf/rbz/v39n2/30.pdf>. Accessed: Feb. 02, 2017. doi: 10.1590/S1516-35982010000200030.
RAUSCH, J. R.; KELLEY, K. A comparison of linear and mixture models for discriminant analysis under nonnormality. Behavior Research Methods, v.41, n.1, p.85-98, 2009. Available from: <https://link.springer.com/content/pdf/10.3758%2FBRM.41.1.85. pdf>. Accessed: Dec. 12, 2016. doi: 10.3758/BRM.41.1.85.
SAÑUDO, C. et al. Carcass characteristics and instrumental meat quality of suckling kids and lambs. Spanish Journal of Agricultural Research, v.10, n.3, p.690-700, 2012. Available from: <http://revistas.inia.es/index.php/sjar/article/view/2561>. Accessed: Dec. 12, 2016. doi: 10.5424/sjar/2012103-670-11.
SAS Institute Inc. SAS/STAT 14.1 User’s guide. Cary, NC: SAS Institute Inc. 2015.
SILVA, L.F.; PIRES, C.C. Quantitative evaluation and prediction of the bone, muscle and fat proportion of the ovine carcass.
Revista Brasileira de Zootecnia, v.29, n.4, p.1253-1260, 2000. Available from: <http://www.scielo.br/scielo.php?script=sci_ arttext&pid=S1516-35982000000400040&lng=en&nrm=iso>. Accessed: Aug. 18, 2016. doi: 10.1590/S1516-35982000000400040.